WEEKLY chart of Mini SP 500 | Support and Resistance Levels

Jump to a section in this post:
1. Market Commentary
2. Support and Resistance Levels – S&P, Nasdaq, Dow Jones, Russell 2000
3. Support and Resistance Levels – Gold, Euro, Crude Oil, T-Bonds
4. Support and Resistance Levels – March Corn, March Wheat, Jan Beans, March Silver
5.Economic Report for February 22, 2012

1. Market Commentary

Hello Traders,
We came back fro President’s Day long weekend to find crude up over $2.00.
Gold followed on the same uncertainties and finished up $35
Our stock market on the other hand, finished unchanged on another less than avg. volume.
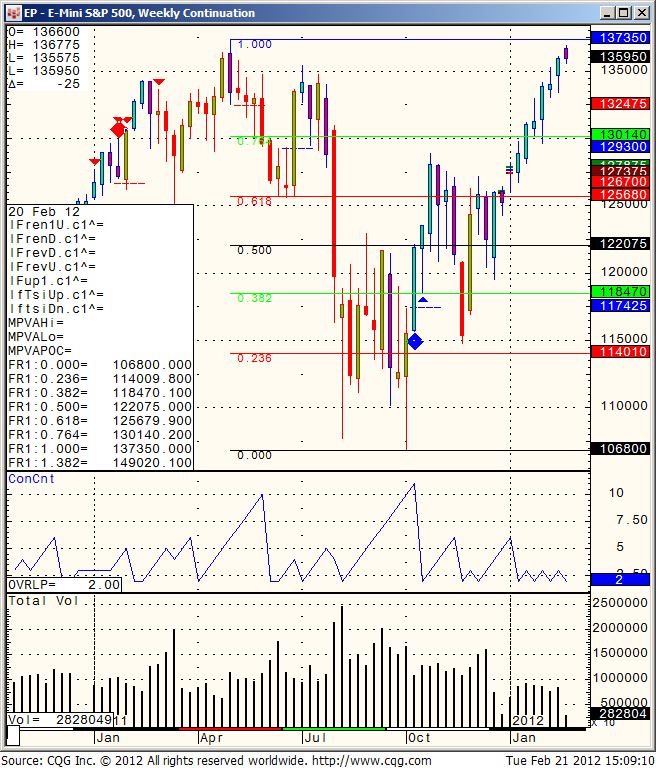
WEEKLY chart of mini SP 500 for your review below. We are trading against the high from last May and it will be interesting to see what type of price action and volume we will see here.
Market Commentary Continue reading “WEEKLY chart of Mini SP 500 | Support and Resistance Levels”

Tuesday Morning Support and Resistance Numbers

Here’s a morning cup o’ joe for all you futures traders, our morning support and resistance levels. Good trading!

divider black 190

Support and Resistance Levels – S&P 500, Nasdaq 100, Dow Jones, Mini Russell 2000, 30-Year US Bond, 10-Year US Note

Contract (Mar. 2012) Mini S&P 500 Mini Nasdaq 100 Dow Jones Mini Russell 2000 30-Year US Bond 10-Year US Note
Resistance Level 3—————————————— Resistance Level 2——————————————

Resistance Level 1

——————————————

Support Level 1

——————————————

Support Level 2

——————————————

Support Level 3

1381.51373.5


1369.5


1360.5


1356


1347.5

2622.52611


2600


2583


2572


2563

1315313101


13024


12944


12901


12864

848.50843.4


832


828.5


824.5


817.5

1422114211


14201


14114


14023


13924

1310413031


13025.5


13015


13007.5


12926

Continue reading “Tuesday Morning Support and Resistance Numbers”

Presidents Day Futures Trading Hours and Holiday Trading Schedule

The above calendar is compiled from sources believed to be reliable. Cannon Trading assumes no responsibility for any errors or omissions. It is meant as an alert to events that may affect trading strategies and is not necessarily complete. The closing times for certain contracts may have been rescheduled

Friday, February 17 Trading Hours

CME Group (Floor)
Regular Close

NYMEX (Floor)
Regular Close

GLOBEX
3:15 pm Close: Interest Rate, Foreign Exchange, GSCI, Wood Pulp, Crude Palm Oil and Green Exchange products
*All other products regular close

ICE
3:15 pm Close: Financial and Index products
*All other products regular close

EUREX
Regular Close

OneChicago
Regular Close

NYSE
Regular Close

Nadex
Regular Close

Forex
Regular Close

Sunday, February 19 Continue reading “Presidents Day Futures Trading Hours and Holiday Trading Schedule”

Friday Morning Support and Resistance Numbers

Here’s a morning cup o’ joe for all you futures traders, our morning support and resistance levels. Good trading!

divider black 190

Support and Resistance Levels – S&P 500, Nasdaq 100, Dow Jones, Mini Russell 2000, 30-Year US Bond, 10-Year US Note

Contract (Mar. 2012) Mini S&P 500 Mini Nasdaq 100 Dow Jones Mini Russell 2000 30-Year US Bond 10-Year US Note
Resistance Level 3—————————————— Resistance Level 2——————————————

Resistance Level 1

——————————————

Support Level 1

——————————————

Support Level 2

——————————————

Support Level 3

13751363.75


1359.5


1356


1352


1345.25

2622.52611


2600


2583


2576


2563

1302713001


12931


12873


12842


12788

848.50843.4


832


824.9


821.6


818.70

1430114216


14207


14122


14117


14023

1310513101.5


13028.5


13018


13007.5


12926

Continue reading “Friday Morning Support and Resistance Numbers”

Holiday Announcement | Support and Resistance Levels

Jump to a section in this post:
1. Market Commentary
2. Support and Resistance Levels – S&P, Nasdaq, Dow Jones, Russell 2000
3. Support and Resistance Levels – Gold, Euro, Crude Oil, T-Bonds
4. Support and Resistance Levels – March Corn, March Wheat, Jan Beans, March Silver
5.Economic Report for February 17, 2012

1. Market Commentary

Check out our holiday trading hours here.

2. Support and Resistance Levels – S&P, Nasdaq, Dow Jones, Russell 2000

Contract (Dec. 2011) SP500
(big & Mini)
Nasdaq100
(big & Mini)
Dow Jones
(big & Mini)
Mini Russell
Resistance Level 3 1379.63 2651.00 13033 857.83
Resistance Level 2 1368.32 2623.00 12962 843.37
Resistance Level 1 1361.53 2607.00 12918 835.23
Pivot Point 1350.22 2579.00 12847 820.77
Support Level 1 1343.43 2563.00 12803 812.63
Support Level 2 1332.12 2535.00 12732 798.17
Support Level 3 1325.33 2519.00 12688 790.03

3. Support & Resistance Levels for Gold, Euro, Crude Oil, and U.S. T-Bonds

Contract April. Gold March Euro Feb. Crude Oil March. Bonds
Resistance Level 3 1763.5 1.3396 104.90 145 3/32
Resistance Level 2 1747.5 1.3278 103.79 144 12/32
Resistance Level 1 1738.6 1.3210 103.05 143 13/32
Pivot Point 1722.6 1.3092 101.94 142 22/32
Support Level 1 1713.7 1.3024 101.20 141 23/32
Support Level 2 1697.7 1.2906 100.09 141
Support Level 3 1688.8 1.2838 99.35 140 1/32

Continue reading “Holiday Announcement | Support and Resistance Levels”

Intra-Day Tools | Support and Resistance Levels

Jump to a section in this post:
1. Market Commentary
2. Support and Resistance Levels – S&P, Nasdaq, Dow Jones, Russell 2000
3. Support and Resistance Levels – Gold, Euro, Crude Oil, T-Bonds
4. Support and Resistance Levels – March Corn, March Wheat, Jan Beans, March Silver
5.Economic Report for February 16, 2012

1. Market Commentary

Hello Traders,

Weekly newsletter along with some examples of tools I use for intra-day support and resistance levels as well as Holiday hours for presidents day at:

https://www.cannontrading.com/news/holiday-trading-schedule-intra-day-support-and-resistance-levels

2. Support and Resistance Levels – S&P, Nasdaq, Dow Jones, Russell 2000

Contract (Dec. 2011) SP500
(big & Mini)
Nasdaq100
(big & Mini)
Dow Jones
(big & Mini)
Mini Russell
Resistance Level 3 1366.40 2638.00 12980 843.90
Resistance Level 2 1359.95 2619.50 12927 836.40
Resistance Level 1 1351.10 2590.00 12840 824.70
Pivot Point 1344.65 2571.50 12787 817.20
Support Level 1 1335.80 2542.00 12700 805.50
Support Level 2 1329.35 2523.50 12647 798.00
Support Level 3 1320.50 2494.00 12560 786.30

Continue reading “Intra-Day Tools | Support and Resistance Levels”

Thursday Morning Support and Resistance

Here’s a morning cup o’ joe for all you futures traders, our morning support and resistance levels. Good trading!

divider black 190

Support and Resistance Levels – S&P 500, Nasdaq 100, Dow Jones, Mini Russell 2000, 30-Year US Bond, 10-Year US Note

Contract (Mar. 2012) Mini S&P 500 Mini Nasdaq 100 Dow Jones Mini Russell 2000 30-Year US Bond 10-Year US Note
Resistance Level 3—————————————— Resistance Level 2——————————————

Resistance Level 1

——————————————

Support Level 1

——————————————

Support Level 2

——————————————

Support Level 3

13541348.75


1343.25


1348.75


1343


1337.75

26002578


2565


2543


2535


2515

1293112842


12788


12757


12703


12649

832.00822.2


816.1


810.3


806.5


792.20

1440614327


14321


14221


14209


14129

1312613124.5


13118.5


13110


13105.5


13100

Continue reading “Thursday Morning Support and Resistance”

New Video | Support and Resistance Levels

Jump to a section in this post:
1. Market Commentary
2. Support and Resistance Levels – S&P, Nasdaq, Dow Jones, Russell 2000
3. Support and Resistance Levels – Gold, Euro, Crude Oil, T-Bonds
4. Support and Resistance Levels – March Corn, March Wheat, Jan Beans, March Silver
5.Economic Report for February 15, 2012

1. Market Commentary

Hello Traders,

About 6-7 minutes video is now posted on how to use the trailing stop feature in our AT ( Active Trader) platform, along with small example of how I use overbought/ oversold conditions along with support and resistance to enter trades.

Any feedback is welcomed as we plan on producing additional educational videos


2. Support and Resistance Levels – S&P, Nasdaq, Dow Jones, Russell 2000

Contract (Dec. 2011) SP500
(big & Mini)
Nasdaq100
(big & Mini)
Dow Jones
(big & Mini)
Mini Russell
Resistance Level 3 1356.83 2587.17 12903 835.20
Resistance Level 2 1351.77 2577.83 12862 830.10
Resistance Level 1 1348.13 2572.67 12838 823.40
Pivot Point 1343.07 2563.33 12797 818.30
Support Level 1 1339.43 2558.17 12773 811.60
Support Level 2 1334.37 2548.83 12732 806.50
Support Level 3 1330.73 2543.67 12708 799.80

Continue reading “New Video | Support and Resistance Levels”

Tuesday Morning Support and Resistance Numbers

Here’s a morning cup o’ joe for all you futures traders, our morning support and resistance levels. Good trading!

divider black 190

Support and Resistance Levels – S&P 500, Nasdaq 100, Dow Jones, Mini Russell 2000, 30-Year US Bond, 10-Year US Note

Contract (Mar. 2012) Mini S&P 500 Mini Nasdaq 100 Dow Jones Mini Russell 2000 30-Year US Bond 10-Year US Note
Resistance Level 3—————————————— Resistance Level 2——————————————

Resistance Level 1

——————————————

Support Level 1

——————————————

Support Level 2

——————————————

Support Level 3

13641358.75


1353


1345.25


1340.75


1333.75

26482583.50


2575


2559


2550


2535

1300112894


12866


12804


12783


12734

843.40832


825


819.5


815.9


810.3

1440614321


14303


14217


14207


14120

1312613121.5


13116


13104


13031.5


13028.5

Continue reading “Tuesday Morning Support and Resistance Numbers”

Mini Nasdaq 100 | Support and Resistance Levels

Jump to a section in this post:
1. Market Commentary
2. Support and Resistance Levels – S&P, Nasdaq, Dow Jones, Russell 2000
3. Support and Resistance Levels – Gold, Euro, Crude Oil, T-Bonds
4. Support and Resistance Levels – March Corn, March Wheat, Jan Beans, March Silver
5.Economic Report for February 10, 2012

1. Market Commentary

Hello Traders,

Hope everyone had a good start for their week.

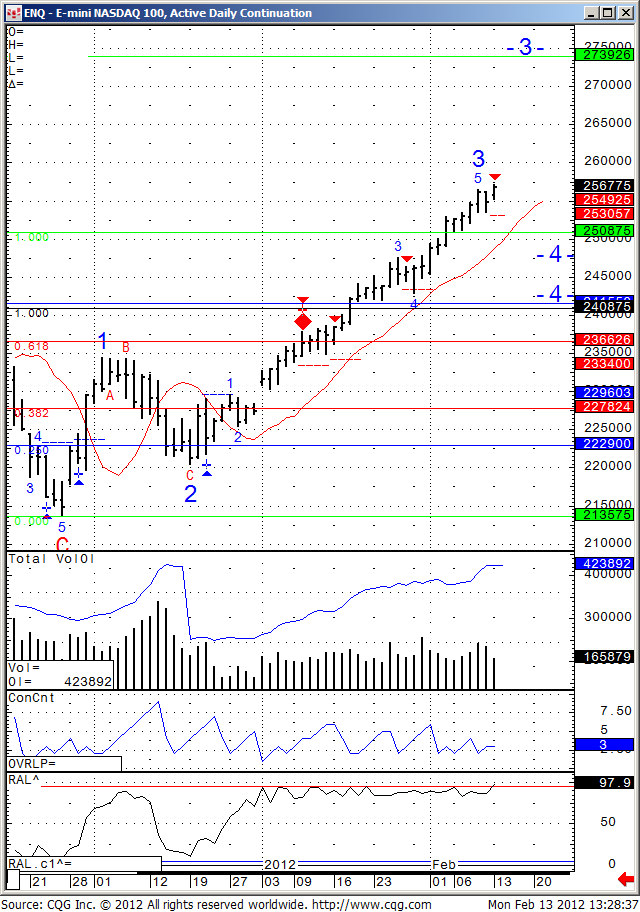
Below is a daily chart of the Mini Nasdaq 100.

Its been almost a straight line up BUT notice how the open interest is increasing and volume is actually declining….Sometimes that can be a sign that a strong correction may happen.

I would NOT try to fight the current uptrend but if I see this market breaking below 2530 over the next couple of days, I would feel stronger about the short side for a correction.

Market Commentary Continue reading “Mini Nasdaq 100 | Support and Resistance Levels”