Futures Trading Levels & Economic Reports for 06-12 including Mini S&P daily chart

Jump to a section in this post:

1. Market Commentary
2. Support and Resistance Levels – S&P, Nasdaq, Dow Jones, Russell 2000, Dollar Index
3. Support and Resistance Levels – Gold, Euro, Crude Oil, T-Bonds
4. Support and Resistance Levels – Corn, Wheat, Beans, Silver
5. Economic Reports for Tuesday June 12, 2012

Hello Traders,

Stock index futures pretty much gave up all their gain from Friday session and finished today on a bearish note.

The question is whats ahead for stock index futures and in the case of the chart below, the mini SP 500?

My opinion is that the fundamental news, which are coming out, mostly news from Europe will have importance. Most traders are technical by nature, i.e they make decisions based on chart formations. I fall into this category myself BUT it is important to be aware of economic reports times and different news affecting the markets you trade.

In the case of the mini SP 500 chart seen below, I see both open interest and volume rising while the trend strength is low in this case. Meaning the down trend that developed over last few weeks on the daily chart is not as a strong. That suggests more price action like we have seen over the past few sessions, strong days up, followed by strong days down etc.
My reading is that an hourly close below 1298 level, can trigger the next leg down.
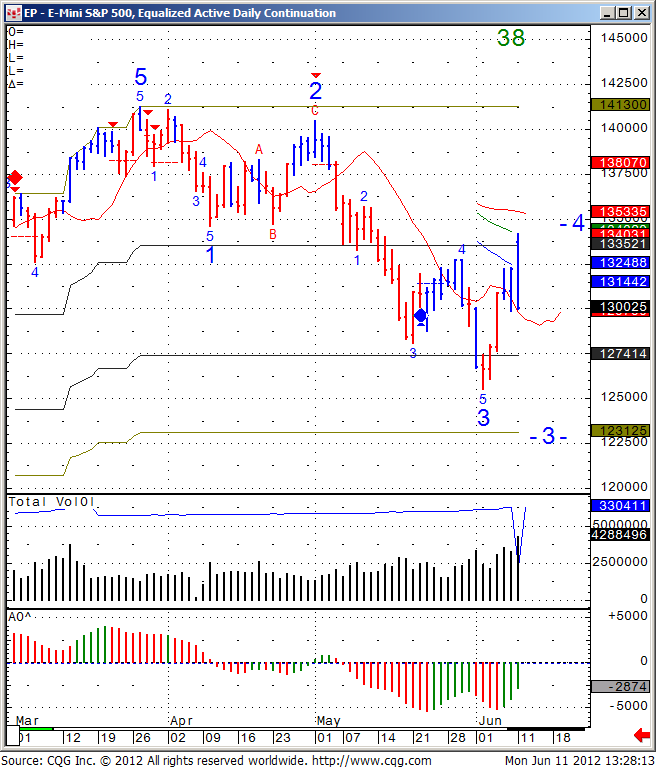
Mini S&P daily chart Continue reading “Futures Trading Levels & Economic Reports for 06-12 including Mini S&P daily chart”

Thursday Morning Support and Resistance Numbers

ROLLOVER DAY: ES, YM, NQ and TF are now trading the September (U2) contract.

If you would like these numbers before the market opens, make sure you SIGN UP with your email above.

Here’s a morning cup o’ joe for all you futures traders, our morning support and resistance levels. Good trading!

divider black 190

Support and Resistance Levels – S&P 500, Nasdaq 100, Dow Jones, Mini Russell 2000, 30-Year US Bond, 10-Year US Note

Contract (September) Mini S&P 500 Mini Nasdaq 100 Dow Jones Mini Russell 2000 30-Year US Bond 10-Year US Note
Resistance Level 3 ——————————————Resistance Level 2

——————————————

Resistance Level 1

——————————————

Support Level 1

——————————————

Support Level 2

——————————————

Support Level 3

13411334


1322.25


1306.5


1298.75


1291.75

26122596


2570


2531


2514


2499

1263412599


12481


12315


12257


12153

789.6778.4


775.1


759.8


754.3


749.4

1502914928


14909


14808


14622


14530

13401.513327


13319


13304.5


13217.5


13206

Continue reading “Thursday Morning Support and Resistance Numbers”

Futures Trading Levels & Economic Reports for 06-07

Jump to a section in this post:

1. Market Commentary
2. Support and Resistance Levels – S&P, Nasdaq, Dow Jones, Russell 2000, Dollar Index
3. Support and Resistance Levels – Gold, Euro, Crude Oil, T-Bonds
4. Support and Resistance Levels – Corn, Wheat, Beans, Silver
5. Economic Reports for Thursday June 7, 2012

Hello Traders,

Not much to say today…just like sometimes as a day-trader you may not have the set ups you need and when that happens, as hard as it may get, you simply need to stay patient and not take trades simply because you feel you are not doing your job etc…

So stay patient, stay disciplined, plan your trade and trade your plan.

Continue reading “Futures Trading Levels & Economic Reports for 06-07”

Crude Oil Bounce? & Trading Levels and Economic Reports for 6-06

Jump to a section in this post:

1. Market Commentary
2. Support and Resistance Levels – S&P, Nasdaq, Dow Jones, Russell 2000, Dollar Index
3. Support and Resistance Levels – Gold, Euro, Crude Oil, T-Bonds
4. Support and Resistance Levels – Corn, Wheat, Beans, Silver
5. Economic Reports for Wednesday June 6, 2012

Hello Traders,

Heads up traders! Front month for bonds, ten years and other financials is now September.

Front month for gold is August.

June is still front month for indices and currencies.

Tomorrow we have weekly Crude Oil inventories, which can usually move this market both ways pretty fast…

Crude has been in a very strong downtrend last couple of months and what I see in the below daily chart, is a chance for this market to bounce up a bit, maybe to the 88 area. The trend is still down no doubt (and it is a strong trend as indicated by 99 trend strength level in the chart), but it is rare that markets go up or down with a small correction and this is what I would look for if tomorrows numbers, or more important, market reaction to the numbers are bullish.

Daily Crude Oil chart for your review below:

579

Continue reading “Crude Oil Bounce? & Trading Levels and Economic Reports for 6-06”

Tuesday Morning Support and Resistance Numbers

If you would like these numbers before the market opens, make sure you SIGN UP with your email above.

Here’s a morning cup o’ joe for all you futures traders, our morning support and resistance levels. Good trading!

divider black 190

Support and Resistance Levels – S&P 500, Nasdaq 100, Dow Jones, Mini Russell 2000, 30-Year US Bond, 10-Year US Note

Contract (June) Mini S&P 500 Mini Nasdaq 100 Dow Jones Mini Russell 2000 30-Year US Bond Sep ’12 10-Year US Note Sep ’12
Resistance Level 3 ——————————————Resistance Level 2

——————————————

Resistance Level 1

——————————————

Support Level 1

——————————————

Support Level 2

——————————————

Support Level 3

1298.251289.75


1280


1265.25


1261


1251.5

25182502


2485


2465


2453


2429

1236412219


12138


12062


12024


11985

753.5747.5


741


728.5


725.8


723.9

15219 (all time high)15126 

15111


15011


14921


14830

13430.5 (all time high)13415.5 

13406


13322.5


13310.5


13304.5

Continue reading “Tuesday Morning Support and Resistance Numbers”

Trading Levels & Economic Reports for 06-05 with Renko chart for Mini S&P

Jump to a section in this post:

1. Market Commentary
2. Support and Resistance Levels – S&P, Nasdaq, Dow Jones, Russell 2000, Dollar Index
3. Support and Resistance Levels – Gold, Euro, Crude Oil, T-Bonds
4. Support and Resistance Levels – Corn, Wheat, Beans, Silver
5. Economic Reports for Tuesday June 5, 2012

Hello Traders,

Heads up traders! Front month for bonds, ten years and other financials is now September.

Front month for gold is August.

June is still front month for indices and currencies.

Below is a screen shot of the Mini Sp 500 chart I shared during today’s session with clients and prospects during our live trading signals session

Renko mini S&P chart for your review below:

Renko Mini S&P 500 chart

Would you like to have access to my DIAMOND and TOPAZ ALGOs as shown above and be able to apply for any market and any time frame on your own PC ? You can now have a two weeks free trial where I enable the ALGO along with few studies for your own sierra/ ATcharts.

OR you can simply “stop by” and view my live screen.

To start your trial, please visit:
https://www.cannontrading.com/tools/intraday-futures-trading-signals Continue reading “Trading Levels & Economic Reports for 06-05 with Renko chart for Mini S&P”

Monday Morning Support and Resistance Numbers

If you would like these numbers before the market opens, make sure you SIGN UP with your email above.

Here’s a morning cup o’ joe for all you futures traders, our morning support and resistance levels. Good trading!

divider black 190

Support and Resistance Levels – S&P 500, Nasdaq 100, Dow Jones, Mini Russell 2000, 30-Year US Bond, 10-Year US Note

Contract (June) Mini S&P 500 Mini Nasdaq 100 Dow Jones Mini Russell 2000 30-Year US Bond Sep ’12 10-Year US Note Sep ’12
Resistance Level 3 ——————————————Resistance Level 2

——————————————

Resistance Level 1

——————————————

Support Level 1

——————————————

Support Level 2

——————————————

Support Level 3

1298.251289.75


1280


1272.75


1268.5


1261

25022485


2467


2453


2445


2429

1236412219


12138


12073


12039


11985

756.9751.8


746.2


735.4


731.6


723.9

15219 (all time high)15206

15130


15104


15011


14830

13430.5 (all time high)13422.5

13417.5


13407


13331.5


13324

Continue reading “Monday Morning Support and Resistance Numbers”

Monthly Unemployment Report Ahead + Trading Levels for June 1st

Jump to a section in this post:

1. Market Commentary
2. Support and Resistance Levels – S&P, Nasdaq, Dow Jones, Russell 2000, Dollar Index
3. Support and Resistance Levels – Gold, Euro, Crude Oil, T-Bonds
4. Support and Resistance Levels – Corn, Wheat, Beans, Silver
5. Economic Reports for Friday June 1, 2012

Hello Traders,

Heads up traders! front month for bonds, ten years and other financials is now September.

Front month for gold is August.

June is still front month for indices and currencies.

Monthly employment figures are out tomorrow at 8:30 Am Eastern Time! This is a market moving report, so be prepared!

May is officially behind us ( trading wise) and with the new trading month starting, I decided to share monthly chart of mini SP 500 below for your longer term overview.

May June be a trading month filled with patience and discipline!


Monthly chart of the mini S&P for your review below:

mini S&P futures monthly chart Continue reading “Monthly Unemployment Report Ahead + Trading Levels for June 1st”

Long Term Traders to Follow Futures Indices Prices on Last Trading Day of May

Jump to a section in this post:

1. Market Commentary
2. Support and Resistance Levels – S&P, Nasdaq, Dow Jones, Russell 2000, Dollar Index
3. Support and Resistance Levels – Gold, Euro, Crude Oil, T-Bonds
4. Support and Resistance Levels – Corn, Wheat, Beans, Silver
5. Economic Reports for Thursday May 31, 2012

Hello Traders,

Heads up traders! front month for bonds, ten years and other financials is now September.

Front month for gold is August.

June is still front month for indices and currencies.

Mini Russell daily chart for your review below. An attempt to rally off the lows fizzled today and tomorrow can provide some clues for future direction. Tomorrow being the last day in May will provide some longer term traders with a fresh look at the weekly and monthly charts, so the close tomorrow may be significant.

Close below 760 may suggest new lows to follow, close above 780 may signal continued bounce higher.

Trade with patience, trade with discipline and good trading to all.


Daily chart of the mini Russell 2000 Index for your review below for your review:

mini Russell 2000 Index daily Continue reading “Long Term Traders to Follow Futures Indices Prices on Last Trading Day of May”