Webinar May 30th – Locating Trading Levels for Day-trading

Jump to a section in this post:

1. Market Commentary
2. Support and Resistance Levels – S&P, Nasdaq, Dow Jones, Russell 2000, Dollar Index
3. Support and Resistance Levels – Gold, Euro, Crude Oil, T-Bonds
4. Support and Resistance Levels – Corn, Wheat, Beans, Silver
5. Economic Reports for Wednesday May 30, 2012

Hello Traders,

Locating Accurate, Real-Time Support and Resistance Levels for Intraday Trading

Join us for a Webinar on May 30

Space is limited.

https://www2.gotomeeting.com/register/877581714

Join Greg Weitzman, president and founder of TheTradingZone.com for this educational webinar Market Profile and Volume Nodes, How to locate unique and accurate Support and resistance levels for your intraday trading.

Because Volume is what drives the markets!

In this hour presentation Greg will show you just how easy it is to use Volume based Market Profile in your own trading to locate these highly accurate levels.

As a bonus, all attendees will also get

1. A 30 day demo account from Cannon Trading with our live, advanced charting package
2. A7 day pass to the Live Trading Room
3. a substantial discount on membership at TheTradingZone.com

SEATS ARE LIMITED, SO DON’T MISS THIS SPECIAL FREE WEBINAR!

Risk: Trading Futures, Options on Futures, and retail off-exchange foreign currency transactions involves substantial risk of loss and is not suitable for all investors. You should carefully consider whether trading is suitable for you in light of your circumstances, knowledge, and financial resources. You may lose all or more of your initial investment. Opinions, market data, and recommendations are subject to change at any time.

Title: Locating accurate, real-time support & resistance levels for intraday trading
Date: Wednesday, May 30, 2012
Time: 1:30 PM – 2:30 PM PDT

After registering you will receive a confirmation email containing information about joining the Webinar.

System Requirements

PC-based attendees
Required: Windows® 7, Vista, XP or 2003 Server

Macintosh®-based attendees
Required: Mac OS® X 10.5 or newer Continue reading “Webinar May 30th – Locating Trading Levels for Day-trading”

Tuesday Morning Support and Resistance Numbers

We hope our local clients had a fantastic Memorial Day weekend!

If you would like these numbers before the market opens, make sure you SIGN UP with your email above.

Here’s a morning cup o’ joe for all you futures traders, our morning support and resistance levels. Good trading!

divider black 190

Support and Resistance Levels – S&P 500, Nasdaq 100, Dow Jones, Mini Russell 2000, 30-Year US Bond, 10-Year US Note

Contract (June) Mini S&P 500 Mini Nasdaq 100 Dow Jones Mini Russell 2000 30-Year US Bond 10-Year US Note
Resistance Level 3 ——————————————Resistance Level 2

——————————————

Resistance Level 1

——————————————

Support Level 1

——————————————

Support Level 2

——————————————

Support Level 3

1349.51334.5


1329.75


1315


1308.5


1303.5

25752563


2555


2520


2511


2498

1272212639


12586


12471


12436


12400

785.7783.1


775


766.8


762.5


754.8

14823 (all time high)14817 

14807


14701


14618


14513

1341613406.5


13400 (all time high)

13310.5


13307


13302

Continue reading “Tuesday Morning Support and Resistance Numbers”

Friday Morning Support and Resistance Numbers

If you would like these numbers before the market opens, make sure you SIGN UP with your email above.

Here’s a morning cup o’ joe for all you futures traders, our morning support and resistance levels. Good trading!

divider black 190

Support and Resistance Levels – S&P 500, Nasdaq 100, Dow Jones, Mini Russell 2000, 30-Year US Bond, 10-Year US Note

Contract (June) Mini S&P 500 Mini Nasdaq 100 Dow Jones Mini Russell 2000 30-Year US Bond 10-Year US Note
Resistance Level 3 ——————————————Resistance Level 2

——————————————

Resistance Level 1

——————————————

Support Level 1

——————————————

Support Level 2

——————————————

Support Level 3

1334.51328.75


1326.5


1318


1312.25


1305.25

25752563


2555


2520


2511


2498

1272212639


12586


12471


12436


12400

775.4769.4


767.3


765.6


761.5


754.2

14823 (all time high)14803

14725


14701


14618


14513

13328.5 (all time high)13325.5

13323


13310.5


13307


13302

Continue reading “Friday Morning Support and Resistance Numbers”

Thursday Morning Support and Resistance Numbers

If you would like these numbers before the market opens, make sure you SIGN UP with your email above.

Here’s a morning cup o’ joe for all you futures traders, our morning support and resistance levels. Good trading!

divider black 190

Support and Resistance Levels – S&P 500, Nasdaq 100, Dow Jones, Mini Russell 2000, 30-Year US Bond, 10-Year US Note

Contract (June) Mini S&P 500 Mini Nasdaq 100 Dow Jones Mini Russell 2000 30-Year US Bond 10-Year US Note
Resistance Level 3 ——————————————Resistance Level 2

——————————————

Resistance Level 1

——————————————

Support Level 1

——————————————

Support Level 2

——————————————

Support Level 3

1334.51328.75


1326.5


1316.25


1312.25


1305.25

25962575


2563


2534


2520


2498

1272212639


12553


12463


12431


12376

775.4769.4


764


762.3


759.4


754.2

14823 (all time high)14803 

14725


14713


14618


14513

13328.5 (all time high)13323 

13319.5


13311.5


13307


13302

Continue reading “Thursday Morning Support and Resistance Numbers”

Trading Levels and Reports for May 24th – Gold Futures Leading General Market Direction

Jump to a section in this post:

1. Market Commentary
2. Support and Resistance Levels – S&P, Nasdaq, Dow Jones, Russell 2000, Dollar Index
3. Support and Resistance Levels – Gold, Euro, Crude Oil, T-Bonds
4. Support and Resistance Levels – Corn, Wheat, Beans, Silver
5. Economic Reports for Wednesday May 24, 2012

Hello Traders,

I think the leader of the markets these past few trading sessions, have been gold – an example is from today’s trading session when SP lows followed Gold lows by minutes…. Below you will see an hourly chart of the gold market with potential, very short term targets on both a continued bounce as well as in case the longer term down trend resumes.

Personally, I think gold will be trading between 1523 to 1625 for a while , which by itself is a very wide range if I am right and I have been wrong many times before.

When you feel the “heat of the markets” is affecting you and you are in a position, take a step back and ask yourself, “what would I do if I was not in a position currently…”? the answer should help you manage your current position while in a trade.


Hourly chart of Gold Futures below for your review:

gce hourly

Continue reading “Trading Levels and Reports for May 24th – Gold Futures Leading General Market Direction”

Hourly Chart Mini S&P 500 for May 23, 2012

Jump to a section in this post:

1. Market Commentary
2. Support and Resistance Levels – S&P, Nasdaq, Dow Jones, Russell 2000, Dollar Index
3. Support and Resistance Levels – Gold, Euro, Crude Oil, T-Bonds
4. Support and Resistance Levels – Corn, Wheat, Beans, Silver
5. Economic Reports for Tuesday May 23, 2012

Hello Traders,

Good ranges on many markets I follow intra day, which most day-traders look for.

As I said many times before , volatility and wide ranges can be a double edge sword….

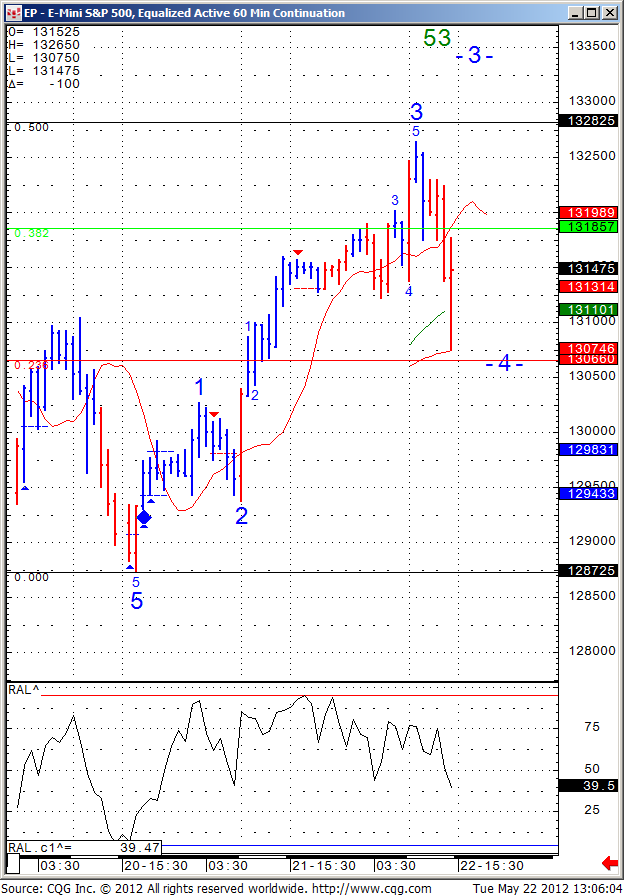
Below you will see an hourly chart of the mini SP 500 along with some potential Elliott Wave targets for either pull backs or continued bounce.

Trade with patience, trade with discipline and good trading to all.


Hourly chart of Mini S&P 500 below for your review:

mini sp hourly Continue reading “Hourly Chart Mini S&P 500 for May 23, 2012”

Tuesday Morning Support and Resistance Numbers

If you would like these numbers before the market opens, make sure you SIGN UP with your email above.

Here’s a morning cup o’ joe for all you futures traders, our morning support and resistance levels. Good trading!

divider black 190

Support and Resistance Levels – S&P 500, Nasdaq 100, Dow Jones, Mini Russell 2000, 30-Year US Bond, 10-Year US Note

Contract (June) Mini S&P 500 Mini Nasdaq 100 Dow Jones Mini Russell 2000 30-Year US Bond 10-Year US Note
Resistance Level 3 ——————————————Resistance Level 2

——————————————

Resistance Level 1

——————————————

Support Level 1

——————————————

Support Level 2

——————————————

Support Level 3

1334.81328.75


1318.5


1312


1307.5


1299.75

26092575


2557


2532


2521


2499

1267812567


12549


12467


12438


12387

775.4768.6


764


759.8


756.7


751.2

1480014717


14709


14624


14605


14511

13319.513314.5


13312


13303.5


13223


13212

Continue reading “Tuesday Morning Support and Resistance Numbers”

Crude Oil and Stock Index Futures: Small Bounce or Short-Term Bottom?

Jump to a section in this post:

1. Market Commentary
2. Support and Resistance Levels – S&P, Nasdaq, Dow Jones, Russell 2000
3. Support and Resistance Levels – Gold, Euro, Crude Oil, T-Bonds
4. Support and Resistance Levels – Corn, Wheat, Beans, Silver
5. Economic Reports for Tuesday May 22, 2012

Hello Traders,

We started the week with nice bounce on stock indices, crude oil  and gold continue to hold.

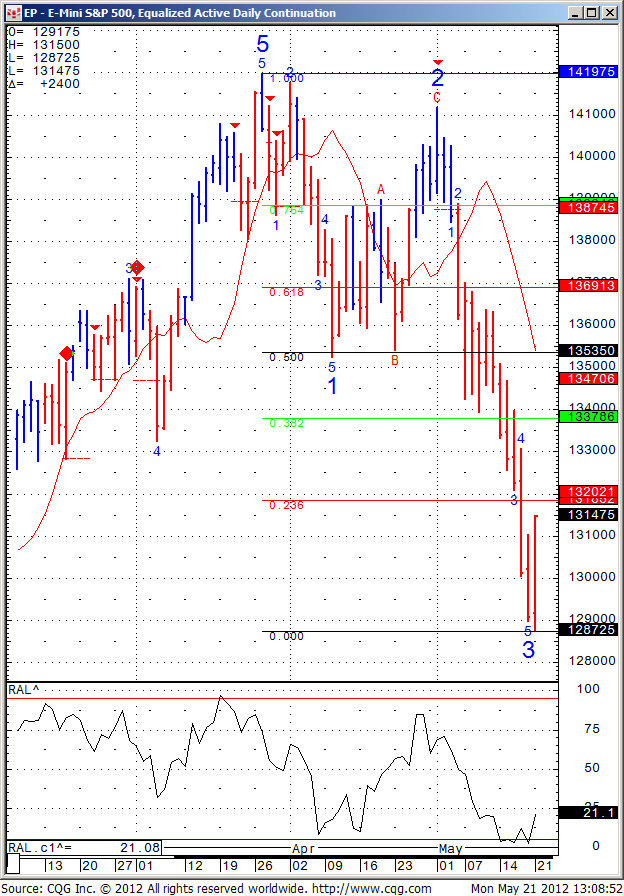
The big question: Is this a small correction/ bounce after the strong sell off last week or is this a short term bottom?


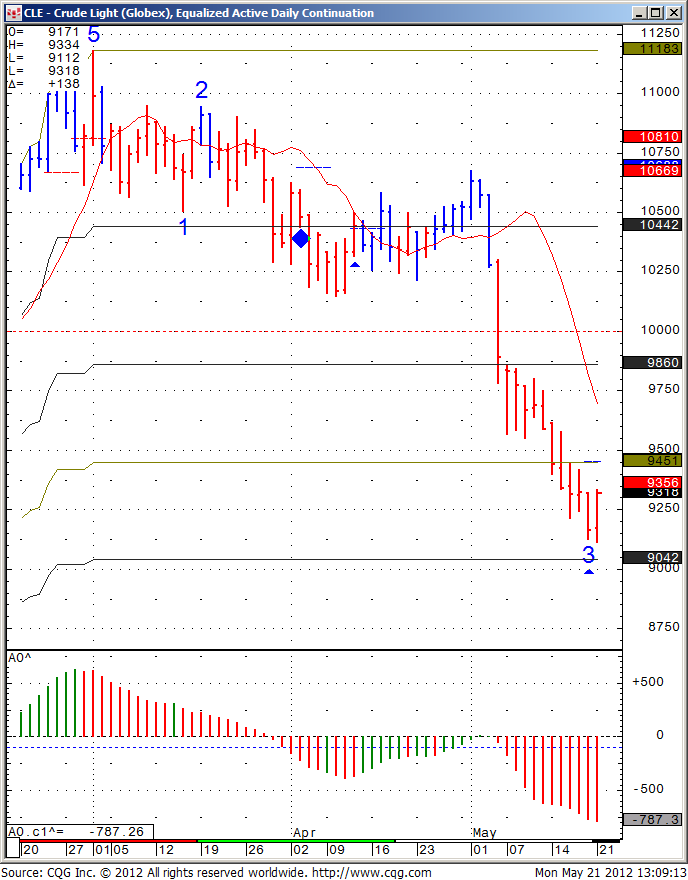
My opinion is that it is just a normal bounce after strong sell off and that there is more room on the downside but we will need to see the market reaction if we can climb up to 1320 and 1337 on the SP and  94.50 on the crude oil


Daily charts of both below for your review:


Mini SP daily Chart

mini sp daily


Crude Oil Futures Daily chart 
crude oil futures daily chart


Continue reading “Crude Oil and Stock Index Futures: Small Bounce or Short-Term Bottom?”

Monday Morning Support and Resistance Numbers


If you would like these numbers before the market opens, make sure you SIGN UP with your email above.

Here’s a morning cup o’ joe for all you futures traders, our morning support and resistance levels. Good trading!

divider black 190

Support and Resistance Levels – S&P 500, Nasdaq 100, Dow Jones, Mini Russell 2000, 30-Year US Bond, 10-Year US Note

Contract (June) Mini S&P 500 Mini Nasdaq 100 Dow Jones Mini Russell 2000 30-Year US Bond 10-Year US Note
Resistance Level 3——————————————Resistance Level 2

——————————————

Resistance Level 1

——————————————

Support Level 1

——————————————

Support Level 2

——————————————

Support Level 3

1318.51308


1304


1290.75


1281


1278

25562537


2511


2465


2444


2428

1259812529


12451


12352


12318


12248

768.6762.4


755.5


742.3


732.5


731.6

14823 (all time high)14806

14727


14714


14624


14518

13327 (all time high)13323

13320.5


13306


13226.5


13216.5

Continue reading “Monday Morning Support and Resistance Numbers”