Futures Trading Levels and Economic Reports for August 13, 2013

Connect with Us! Use Our Futures Trading Levels and Economic Reports RSS Feed.

Like us on FacebookFollow us on TwitterView our profile on LinkedInFind us on Google+Cannon Trading Futures Trading Resistance & Support Levels and Economic ReportsFind us on Yelp

1. Market Commentary
2. Futures Support and Resistance Levels – S&P, Nasdaq, Dow Jones, Russell 2000, Dollar Index
3. Commodities Support and Resistance Levels – Gold, Euro, Crude Oil, T-Bonds
4. Commodities Support and Resistance Levels – Corn, Wheat, Beans, Silver
5. Futures Economic Reports for Tuesday August 13, 2013

Hello Traders,

For 2013 I would like to wish all of you discipline and patience in your trading! 

Another slow, summer trading day to start the week in the stock index futures segment. Be careful of this type of trading days. The low volume and narrow ranges can get you too comfortable to trading sloppy….

Sometimes no trade is better than a bad trade. Actually all the time…

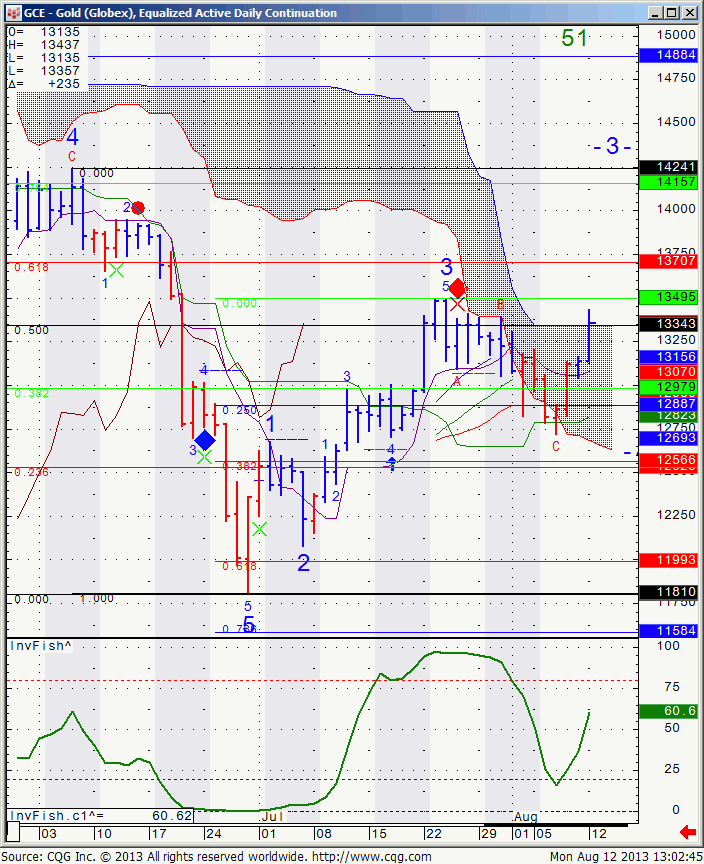
In between gold futures had a nice up move over the last few sessions. Daily chart of Dec. Gold futures for your review below.

Notice that prices closed ABOVE the IMOKU cloud, which is usually a bullish sign. Market needs to confirm this bullish sign by closing above 1349.5.

Gold Futures Daily Chart

Continue reading “Futures Trading Levels and Economic Reports for August 13, 2013”

Futures Trading Levels and Economic Reports for August 9, 2013

Connect with Us! Use Our Futures Trading Levels and Economic Reports RSS Feed.

Like us on FacebookFollow us on TwitterView our profile on LinkedInFind us on Google+Cannon Trading Futures Trading Resistance & Support Levels and Economic ReportsFind us on Yelp

1. Market Commentary
2. Futures Support and Resistance Levels – S&P, Nasdaq, Dow Jones, Russell 2000, Dollar Index
3. Commodities Support and Resistance Levels – Gold, Euro, Crude Oil, T-Bonds
4. Commodities Support and Resistance Levels – Corn, Wheat, Beans, Silver
5. Futures Economic Reports for Friday August 9, 2013

Hello Traders,

For 2013 I would like to wish all of you discipline and patience in your trading! 


Below is a screen shot of the Mini Sp 500 chart I shared during today’s session with clients and prospects during our live trading signals session

As I mentioned before, when we have more volatility and two sided trading range, this ALGO model does very well.
It does not perform as well on strong trending days.

In the chart below you will see 3 confirmed signals. Once I get a red arrow or red diamond and price crosses below the green light = sell signal.


Once I get a green diamond or arrow and price crosses above the green line = buy signal.


As always, the hard part is where to take profits, stops etc. Which I will be happy to share more with those who are interested.


image.php?l=1375991951816


Would you like to have access to my DIAMOND and TOPAZ ALGOs as shown above

and be able to apply for any market and any time frame on your own PC ?   You can now have a two weeks free trial where I enable the ALGO along with few studies for your own sierra/ ATcharts.


If so, please send me an email with the following information:

1. Are you currently trading futures?

2. Charting software you use?

3. If you use sierra or ATcharts, please let me know the user name so I can enable you

4. Markets you currently trading?


HYPOTHETICAL PERFORMANCE RESULTS HAVE MANY INHERENT LIMITATIONS, SOME OF WHICH ARE DESCRIBED BELOW.  NO REPRESENTATION IS BEING MADE THAT ANY ACCOUNT WILL OR IS LIKELY TO ACHIEVE PROFITS OR LOSSES SIMILAR TO THOSE SHOWN.  IN FACT, THERE ARE FREQUENTLY SHARP DIFFERENCES BETWEEN HYPOTHETICAL PERFORMANCE RESULTS AND THE ACTUAL RESULTS SUBSEQUENTLY ACHIEVED BY ANY PARTICULAR TRADING PROGRAM.


ONE OF THE LIMITATIONS OF HYPOTHETICAL PERFORMANCE RESULTS IS THAT THEY ARE GENERALLY PREPARED WITH THE BENEFIT OF HINDSIGHT.  IN ADDITION, HYPOTHETICAL TRADING DOES NO INVOLVE FINANCIAL RISK, AND NO HYPOTHETICAL TRADING RECORD CAN COMPLETELY ACCOUNT FOR THE IMPACT OF FINANCIAL RISK IN ACTUAL TRADING.  FOR EXAMPLE, THE ABILITY TO WITHSTAND LOSSES OR TO ADHERE TO A PARTICULAR TRADING PROGRAM IN SPITE OF TRADING LOSSES ARE MATERIAL POINTS WHICH CAN ALSO ADVERSELY AFFECT ACTUAL TRADING RESULTS.  THERE ARE NUMEROUS OTHER FACTORS RELATED TO THE MARKETS IN GENERAL OR TO THE IMPLEMENTATION OF ANY SPECIFIC TRADING PROGRAM WHICH CANNOT BE FULLY ACCOUNTED FOR IN THE PREPARATION OF HYPOTHETICAL PERFORMANCE RESULTS AND ALL OF WHICH CAN ADVERSELY AFFECT ACTUAL TRADING RESULTS


On a different note: I am getting very nice feedback on the content of this blog from clients as well as prospects and I appreciate it! In return I would like to ask you to take a few minutes and post positive reviews on:

Google Plus  ( you need to be logged in to your gmail account first)

I thank you in advance and hope you take a few minutes to do so.


You like the information we share? We would appreciate your positive reviews on Google+ , Facebook, Yelp etc…use the icons below to share, recommend, review us and more!

Like us on FacebookFollow us on TwitterView our profile on LinkedInFind us on Google+Cannon Trading Futures Trading Resistance & Support Levels and Economic ReportsFind us on Yelp

If you like the information we share? We would appreciate your positive reviews on our new yelp!!

GOOD TRADING


Trading Futures, Options on Futures, and retail off-exchange foreign currency transactions involves substantial risk of loss and is not suitable for all investors. You should carefully consider whether trading is suitable for you in light of your circumstances, knowledge, and financial resources. You may lose all or more of your initial investment. Opinions, market data, and recommendations are subject to change at any time.


Futures Trading Levels

Contract Sept. 2013 SP500 (big & Mini) Nasdaq100 (big & Mini) Dow Jones (big & Mini) Mini Russell Dollar Index
Resistance 3 1712.00 3169.33 15686 1062.47 81.84
Resistance 2 1704.50 3152.92 15604 1057.13 81.62
Resistance 1 1699.50 3141.33 15534 1052.17 81.34
Pivot 1692.00 3124.92 15452 1046.83 81.12
Support 1 1687.00 3113.33 15382 1041.87 80.84
Support 2 1679.50 3096.92 15300 1036.53 80.62
Support 3 1674.50 3085.33 15230 1031.57 80.34
Contract Dec. Gold Sept. Silver Sept. Crude Oil Sept. Bonds Sept. Euro
Resistance 3 1355.4 2143.0 107.83 135 18/32 1.3489
Resistance 2 1334.6 2087.0 106.40 135 3/32 1.3446
Resistance 1 1323.6 2057.5 105.09 134 22/32 1.3416
Pivot 1302.8 2001.5 103.66 134 7/32 1.3373
Support 1 1291.8 1972.0 102.35 133 26/32 1.3343
Support 2 1271.0 1916.0 100.92 133 11/32 1.3300
Support 3 1260.0 1886.5 99.61 132 30/32 1.3270
Contract Dec Corn Sept. Wheat Nov.Beans Dec. SoyMeal Dec. bean Oil
Resistance 3 470.5 642.9 1203.17 373.47 42.46
Resistance 2 467.3 642.1 1196.08 366.13 42.38
Resistance 1 463.5 641.7 1190.17 361.47 42.24
Pivot 460.3 640.8 1183.08 354.13 42.16
Support 1 456.5 640.4 1177.2 349.5 42.0
Support 2 453.3 639.6 1170.08 342.13 41.94
Support 3 449.5 639.2 1164.17 337.47 41.80
For complete contract specifications for the futures markets listed above click here!

5. Economic Reports

source:http://www.forexfactory.com/calendar.php

All times are Eastern time Zone (EST)


Date 4:02pm Currency Impact Detail Actual Forecast Previous Graph
FriAug 9  2:45am EUR French Industrial Production m/m 0.3% -0.4%
EUR French Gov Budget Balance -72.6B
4:00am EUR Italian Trade Balance 4.22B 3.90B
10:00am USD Wholesale Inventories m/m 0.5% -0.5%

This is not a solicitation of any order to buy or sell, but a current market view provided by Cannon Trading Inc. Any statement of facts herein contained are derived from sources believed to be reliable, but are not guaranteed as to accuracy, nor they purport to be complete. No responsibility is assumed with respect to any such statement or with respect to any expression of opinion herein contained. Readers are urged to exercise their own judgment in trading


Futures Trading Levels and Economic Reports for August 8, 2013

Connect with Us! Use Our Futures Trading Levels and Economic Reports RSS Feed.

Like us on FacebookFollow us on TwitterView our profile on LinkedInFind us on Google+Cannon Trading Futures Trading Resistance & Support Levels and Economic ReportsFind us on Yelp

1. Market Commentary
2. Futures Support and Resistance Levels – S&P, Nasdaq, Dow Jones, Russell 2000, Dollar Index
3. Commodities Support and Resistance Levels – Gold, Euro, Crude Oil, T-Bonds
4. Commodities Support and Resistance Levels – Corn, Wheat, Beans, Silver
5. Futures Economic Reports for Thursday August 8, 2013

Hello Traders,

For 2013 I would like to wish all of you discipline and patience in your trading! 

To expand on what I wrote few days ago:

Each market has different personalities, different behavior along with different times of the day when it is most active. If you are finding that the ES is not giving you enough risk/opportunities then start monitoring a couple of other markets and perhaps explore them in demo / simulated mode.

I will try over the next few blogs to shed some light on other markets I think are suitable for day-trading along with what is unique about these markets, personality and most active trading hours.

Yesterday I touched on the financial sector, mostly bonds and ten years. Today I would like to talk a little about the currency futures markets.  

I personally prefer currency futures over FOREX any day. More than a few reasons but the main ones are: currency futures trade on one, regulated main exchange ( CME) while FOREX trades through different interbanks and other means of transactions that are not necessarily regulated. FOREX are “commission free” but in reality there is a spread built in that dealer marks up each time you buy or sell which makes FOREX more expensive than futures.

The main ones I like to follow are:

The Euro , The Yen, The British Pound, The Australian. All are paired versus the US$.

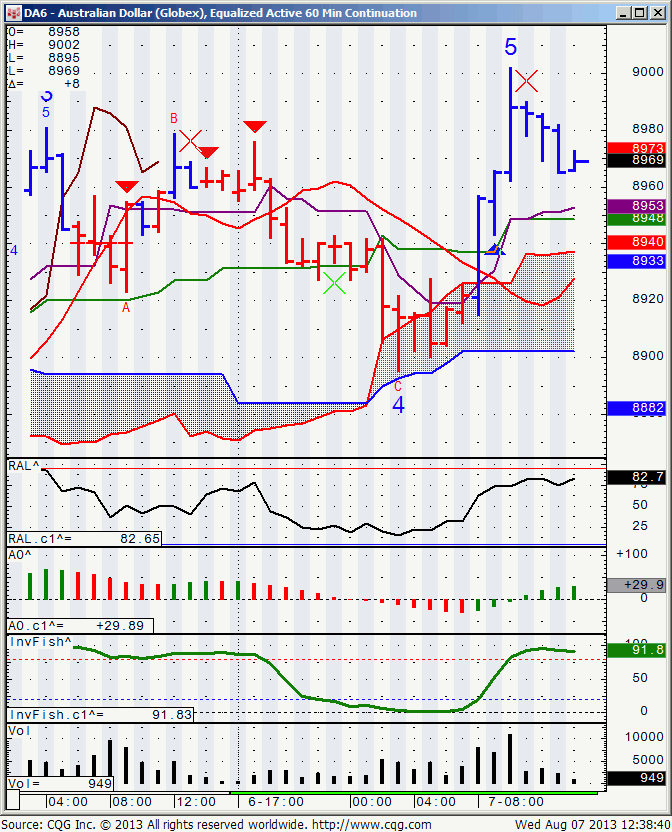
Each market will have different times of higher volume which can allow for traders in all time zones to pick their market. Simply open an hourly chart, like the example i am showing below of the Australian $ and add the volume indicator to observe what times the market has the most action.

In the case of the Aussie, you can see there is good volume all the way from 7 pm central during our night time until the next morning 10 am central when volume dies out as Australia goes to sleep…..


1 Euro tick is $12.50

1 Yen tick is $12.50

1 Aussie tick is $10

1 British tick is $6.25


Currency futures will often trend better than other segments and will experience different levels of volatility during economic reports in the different parts of the world.

If you plan on following any currencies, start in demo mode, know what reports are coming that affect the specific currency you are trading, take a look at the daily, weekly charts to get a feel and monitor the action for a while.

Any questions and i will be happy to assist.

Aussie Dollar 60 Minutes

Continue reading “Futures Trading Levels and Economic Reports for August 8, 2013”

Futures Trading Levels and Economic Reports for August 7, 2013

Connect with Us! Use Our Futures Trading Levels and Economic Reports RSS Feed.

Like us on FacebookFollow us on TwitterView our profile on LinkedInFind us on Google+Cannon Trading Futures Trading Resistance & Support Levels and Economic ReportsFind us on Yelp

1. Market Commentary
2. Futures Support and Resistance Levels – S&P, Nasdaq, Dow Jones, Russell 2000, Dollar Index
3. Commodities Support and Resistance Levels – Gold, Euro, Crude Oil, T-Bonds
4. Commodities Support and Resistance Levels – Corn, Wheat, Beans, Silver
5. Futures Economic Reports for Wednesday August 7, 2013

Hello Traders,

For 2013 I would like to wish all of you discipline and patience in your trading! 

To expand on what I wrote yesterday:

Each market has different personality, different behavior along with different times of the day when it is most active. If you are finding that the ES is not giving you enough risk/opportunities then start monitoring a couple of other markets and perhaps explore them in demo / simulated mode.

I will try over the next few blogs to shed some light on other markets i think are suitable for day-trading along with what is unique about these markets, personality and most active trading hours.

Today I am going to start with interest rates, mostly the ten year and 30 year.

In most platforms, the symbols are ZB for 30 year bonds and ZN for 10 year notes. The current front month is September which is U. So ZBU3 for example.

Product Symbol ZB
Contract Size The unit of trading shall be U.S. Treasury Bonds having a face value at maturity of one hundred thousand dollars ($100,000) or multiples thereof
Price Quotation Points ($1,000) and 1/32 of a point. For example, 134-16 represents 134 16/32. Par is on the basis of 100 points.
Product Symbol ZN


Underlying Unit One U.S. Treasury note having a face value at maturity of $100,000.
Deliverable Grades U.S. Treasury notes with a remaining term to maturity of at least six and a half years, but not more than 10 years, from the first day of the delivery month. The invoice price equals the futures settlement price times a conversion factor, plus accrued interest. The conversion factor is the price of the delivered note ($1 par value) to yield 6 percent.
Price Quote Points ($1,000) and halves of 1/32 of a point. For example, 126-16 represents 126 16/32 and 126-165 represents 126 16.5/32. Par is on the basis of 100 points.
Tick Size
(minimum fluctuation)
One-half of one thirty-second (1/32) of one point ($15.625, rounded up to the nearest cent per contract), except for intermonth spreads, where the minimum price fluctuation shall be one-quarter of one thirty-second of one point ($7.8125 per contract).
Contract Months The first five consecutive contracts in the March, June, September, and December quarterly cycle.

These contracts are often affected by many of the economic reports that come out at 8:30 Am Eastern and there is very active volume between the hours of 8 am EST and 3 PM EST

Volume on both contracts is very good. Ten years will often have 1 million contracts traded per day ( might be the second most active US futures market after the mini SP 500) and the bonds will avg. around 300,000 contracts.

These markets can experience very volatile movements during and right after different reports but then will often trade smooth or in an intraday trend the rest of the day.

Follow these two markets in demo mode for a while if you have not traded them before and get a feel for the movement, reaction to reports, execution etc.

Also, side note: if you are a spreader, there is big volume in trading different spreads between the :

2 year, 5 year, 10 year and 30 year products.

If you have any questions, feel free to contact me.

Below is a 15 minute chart of the US bond market or what i refer to as the 30 year bonds ZBU3

Continue reading “Futures Trading Levels and Economic Reports for August 7, 2013”

Futures Trading Levels and Economic Reports for August 6, 2013

Connect with Us! Use Our Futures Trading Levels and Economic Reports RSS Feed.

Like us on FacebookFollow us on TwitterView our profile on LinkedInFind us on Google+Cannon Trading Futures Trading Resistance & Support Levels and Economic ReportsFind us on Yelp

1. Market Commentary
2. Futures Support and Resistance Levels – S&P, Nasdaq, Dow Jones, Russell 2000, Dollar Index
3. Commodities Support and Resistance Levels – Gold, Euro, Crude Oil, T-Bonds
4. Commodities Support and Resistance Levels – Corn, Wheat, Beans, Silver
5. Futures Economic Reports for Tuesday August 6, 2013

Hello Traders,

For 2013 I would like to wish all of you discipline and patience in your trading! 

Extremely low volume on stock index futures. Some of this may have to do with the summer vacations, perhaps some has to do with the fact that we are trading at new highs? To be honest I am not sure and will do some research to find out what kind of volume the actual stocks/ NYSE are having.

Overall, market making new highs on low volume does not give me much confidence in the long side. In between the intra day ranges are tight and volatility is low. I know that many of you are mini SP 500 traders, ES. However, keep your mind open to other markets as well like mini Russell (usually has more volatility than the ES), crude oil and gold futures as well as currency futures and 30 year bonds.

Each market has different personality, different behavior along with different times of the day when it is most active. If you are finding that the ES is not giving you enough risk/opportunities then start monitoring a couple of other markets and perhaps explore them in demo / simulated mode.

I will be happy to share feedback and answer questions via email or phone.

Futures Trading Levels and Economic Reports for August 2, 2013

Connect with Us! Use Our Futures Trading Levels and Economic Reports RSS Feed.

Like us on FacebookFollow us on TwitterView our profile on LinkedInFind us on Google+Cannon Trading Futures Trading Resistance & Support Levels and Economic ReportsFind us on Yelp

1. Market Commentary
2. Futures Support and Resistance Levels – S&P, Nasdaq, Dow Jones, Russell 2000, Dollar Index
3. Commodities Support and Resistance Levels – Gold, Euro, Crude Oil, T-Bonds
4. Commodities Support and Resistance Levels – Corn, Wheat, Beans, Silver
5. Futures Economic Reports for Friday August 2, 2013

Hello Traders,

For 2013 I would like to wish all of you discipline and patience in your trading! 

As happened more than a few times in the past, the real direction/ reaction to the FOMC comes the following day and the reaction this time was a 21+ point rally on the SP500.

Tomorrow we have monthly unemployment along with a few other reports here in the US and in Europe that can either confirm this rally or cool off the recent surge in buying – either way I expect some volatility tomorrow.

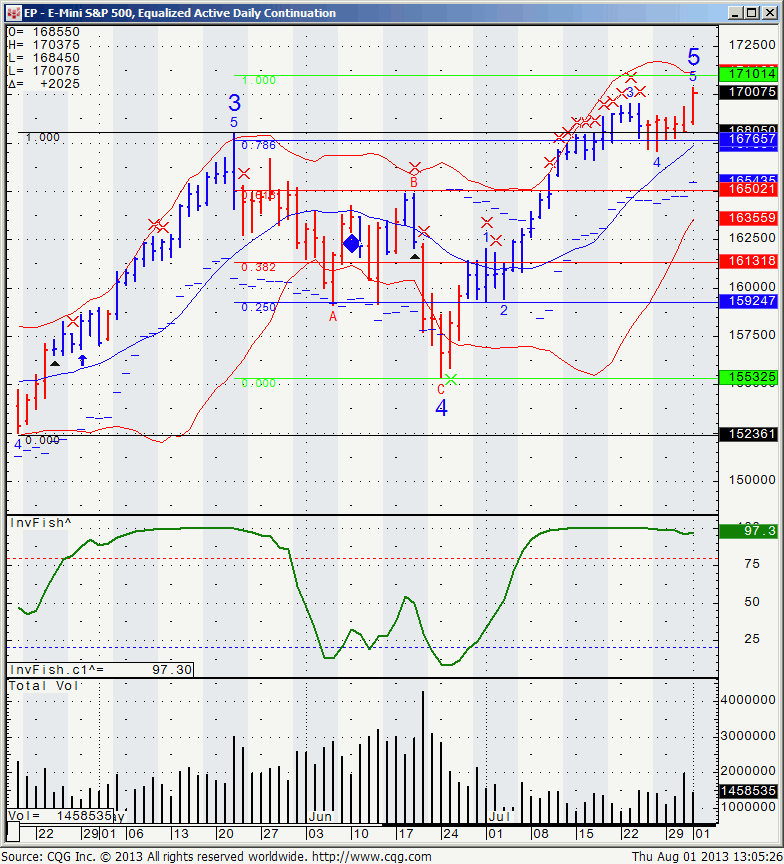
Below is a daily chart of the mini SP500 with some potential Fibonacci extensions. Next key level on the way up is 1710 and key support or possible “trend changing level” is 1676.

I wish all of you successful, patient and disciplined trading during the month of August!

EP - E Mini S&P 500, Equalized Active Daily Continuation
EP – E Mini S&P 500, Equalized Active Daily Continuation

Futures Trading Levels and Economic Reports for August 1, 2013

Connect with Us! Use Our Futures Trading Levels and Economic Reports RSS Feed.

Like us on FacebookFollow us on TwitterView our profile on LinkedInFind us on Google+Cannon Trading Futures Trading Resistance & Support Levels and Economic ReportsFind us on Yelp

1. Market Commentary
2. Futures Support and Resistance Levels – S&P, Nasdaq, Dow Jones, Russell 2000, Dollar Index
3. Commodities Support and Resistance Levels – Gold, Euro, Crude Oil, T-Bonds
4. Commodities Support and Resistance Levels – Corn, Wheat, Beans, Silver
5. Futures Economic Reports for Thursday August 1, 2013

Hello Traders,

For 2013 I would like to wish all of you discipline and patience in your trading! 

FOMC came and gone and we actually saw some of the “good old volatility FOMC days use to hav” which to me was nice since as daytraders we need the volatility and ranges or what I call the double edge sword.

Below you will see a screen shot of my intraday mini SP 500 chart with my proprietary ALGORITHM I call DIAMONDS. This algo works well on volatile, two sided days but not as well on strong trending days as it tries to predict turning points:

Mini S&P 6 Tick Renko Chart

Continue reading “Futures Trading Levels and Economic Reports for August 1, 2013”

Futures Trading Levels and Economic Reports for July 31, 2013

Connect with Us! Use Our Futures Trading Levels and Economic Reports RSS Feed.

Like us on FacebookFollow us on TwitterView our profile on LinkedInFind us on Google+Cannon Trading Futures Trading Resistance & Support Levels and Economic ReportsFind us on Yelp

1. Market Commentary
2. Futures Support and Resistance Levels – S&P, Nasdaq, Dow Jones, Russell 2000, Dollar Index
3. Commodities Support and Resistance Levels – Gold, Euro, Crude Oil, T-Bonds
4. Commodities Support and Resistance Levels – Corn, Wheat, Beans, Silver
5. Futures Economic Reports for Wednesday July 31, 2013

Hello Traders,

For 2013 I would like to wish all of you discipline and patience in your trading! 

I was working with one of my clients today, trying to provide some feedback and possible different angles to add for his day-trading.

He is a crude trader mostly and I gave him a few ideas and the main one I would like to share today is adding different type of charts to your arsenal if you are a short term trader.

Mostly I am referring to tick charts, volume charts, range charts and renko charts.

The main advantage of using these type of charts versus lets say a 10 minute chart, is that if there is action/ volume/ price movement in the market, the bars will complete faster, hence generating a signal faster rather than you waiting for 10 minute bar to complete. Also when the market is slow, not much price or volume action, the bars will complete slower and will not generate a signal simply because time has passed.

I recommend looking at 15 minute charts and then as you go lower in time frame, add range or tick charts as the “lower time frame”.
I will be more than happy to expand on this topic in upcoming posts or answer questions you may have via email.

An example of a crude oil range chart from today for your review below:

Crude Oil 18 Tick Range Bar Chart

Futures Trading Levels and Economic Reports for July 30, 2013

Connect with Us! Use Our Futures Trading Levels and Economic Reports RSS Feed.

Like us on FacebookFollow us on TwitterView our profile on LinkedInFind us on Google+Cannon Trading Futures Trading Resistance & Support Levels and Economic ReportsFind us on Yelp

1. Market Commentary
2. Futures Support and Resistance Levels – S&P, Nasdaq, Dow Jones, Russell 2000, Dollar Index
3. Commodities Support and Resistance Levels – Gold, Euro, Crude Oil, T-Bonds
4. Commodities Support and Resistance Levels – Corn, Wheat, Beans, Silver
5. Futures Economic Reports for Tuesday July 30, 2013

Hello Traders,

For 2013 I would like to wish all of you discipline and patience in your trading! 

Earning season is in full speed and we are seeing a little bit more volatility in stock index futures but not much to be honest. In addition, this last few weeks mark some of the lowest volume I have personally seen in markets like the mini SP 500 futures.

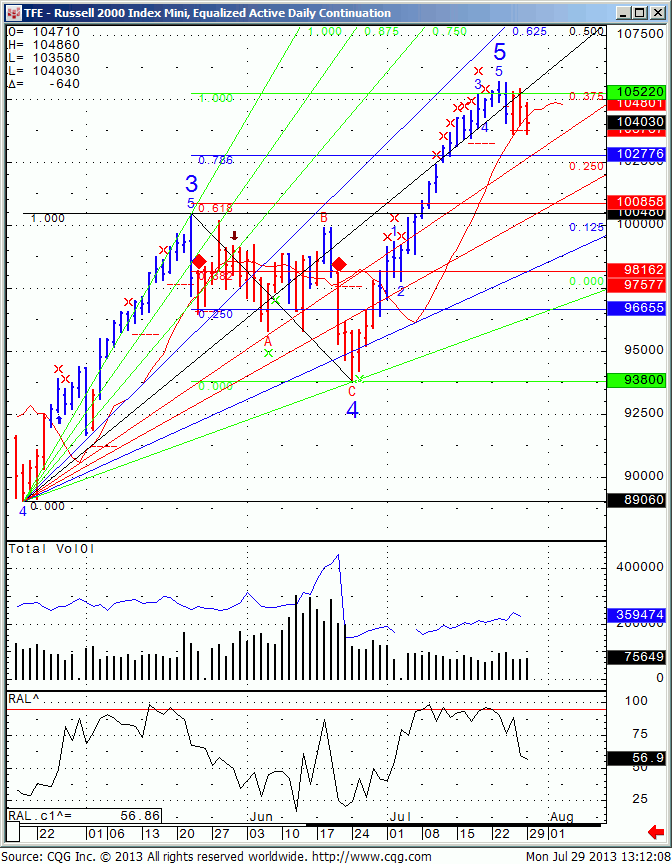
Below is a daily chart of the mini Russell 2000. Many lines, somehow of a confusing chart maybe but the bottom line is that 1027 area is the first support we need to see violated before the markets can make a more significant move lower.

TFE - Mini Russell 2000 Daily
TFE – Mini Russell 2000 Daily

Futures Trading Levels and Economic Reports for July 25, 2013

Connect with Us! Use Our Futures Trading Levels and Economic Reports RSS Feed.

Like us on FacebookFollow us on TwitterView our profile on LinkedInFind us on Google+Cannon Trading Futures Trading Resistance & Support Levels and Economic ReportsFind us on Yelp

1. Market Commentary
2. Futures Support and Resistance Levels – S&P, Nasdaq, Dow Jones, Russell 2000, Dollar Index
3. Commodities Support and Resistance Levels – Gold, Euro, Crude Oil, T-Bonds
4. Commodities Support and Resistance Levels – Corn, Wheat, Beans, Silver
5. Futures Economic Reports for Thursday July 25, 2013

Hello Traders,

For 2013 I would like to wish all of you discipline and patience in your trading! 


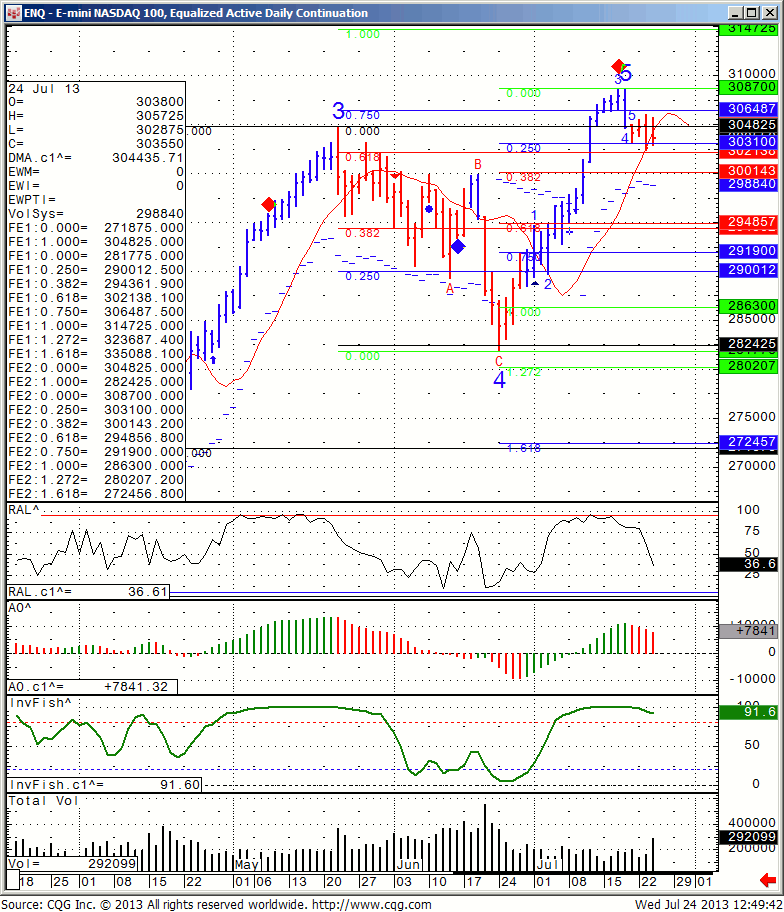
I wrote about stock index futures and the confusing technical picture we have. Today was the first down day in the SP 500 in a while, however, AAPL earnings sent the NASDAQ futures higher.

I think if NASDAQ futures can take out the 3021 level basis the September contract, we can actually see a more meaningful decline across the board.

Mini NASDAQ 100 futures daily chart for your review below.

mini NASDAQ futures


You like the information we share? We would appreciate your positive reviews on Google+ , Facebook, Yelp etc…use the icons below to share, recommend, review us and more!

Like us on FacebookFollow us on TwitterView our profile on LinkedInFind us on Google+Cannon Trading Futures Trading Resistance & Support Levels and Economic ReportsFind us on Yelp

SERVICES
SOFTWARE
Day Trading/Order Flow
COMPANY
QUICK LINKS

Follow Us On Social Media

Cannon Trading Company, Inc., Commodity Broker, Beverly Hills, CA