Futures Trading Levels and Economic Reports for May 23, 2013

Connect with Us! Use Our Futures Trading Levels and Economic Reports RSS Feed.

Like us on FacebookFollow us on TwitterView our profile on LinkedInFind us on Google+Cannon Trading Futures Trading Resistance & Support Levels and Economic ReportsFind us on Yelp

1. Market Commentary
2. Futures Support and Resistance Levels – S&P, Nasdaq, Dow Jones, Russell 2000, Dollar Index
3. Commodities Support and Resistance Levels – Gold, Euro, Crude Oil, T-Bonds
4. Commodities Support and Resistance Levels – Corn, Wheat, Beans, Silver
5. Futures Economic Reports for Thursday May 23, 2013

Hello Traders,

For 2013 I would like to wish all of you discipline and patience in your trading! 


Today was the first meaningful bearish action in stock index futures in more than a few weeks…The big question is will this just be another opportunity to go long or is this the start of a reversal?
We need to follow and monitor price action and closing prices over the next few sessions before attempting to decide but here are the few factors that jumped at me today and make me think that maybe today’s price action is the start of a more meaningful correction:

Continue reading “Futures Trading Levels and Economic Reports for May 23, 2013”

Futures Trading Levels and Economic Reports for May 22, 2013

Connect with Us! Use Our Futures Trading Levels and Economic Reports RSS Feed.

Like us on FacebookFollow us on TwitterView our profile on LinkedInFind us on Google+Cannon Trading Futures Trading Resistance & Support Levels and Economic ReportsFind us on Yelp

1. Market Commentary
2. Futures Support and Resistance Levels – S&P, Nasdaq, Dow Jones, Russell 2000, Dollar Index
3. Commodities Support and Resistance Levels – Gold, Euro, Crude Oil, T-Bonds
4. Commodities Support and Resistance Levels – Corn, Wheat, Beans, Silver
5. Futures Economic Reports for Wednesday May 22, 2013

Hello Traders,

For 2013 I would like to wish all of you discipline and patience in your trading! 


I was not able to generate the support/resistance levels today as I had to step away from the machine much earlier today.


If you like me to send you the updated trading levels first thing tomorrow morning, please reply to this email with:

Continue reading “Futures Trading Levels and Economic Reports for May 22, 2013”

Futures Trading Levels and Economic Reports for May 14, 2013

Connect with Us! Use Our Futures Trading Levels and Economic Reports RSS Feed.

Like us on FacebookFollow us on TwitterView our profile on LinkedInFind us on Google+Cannon Trading Futures Trading Resistance & Support Levels and Economic ReportsFind us on Yelp

1. Market Commentary
2. Futures Support and Resistance Levels – S&P, Nasdaq, Dow Jones, Russell 2000, Dollar Index
3. Commodities Support and Resistance Levels – Gold, Euro, Crude Oil, T-Bonds
4. Commodities Support and Resistance Levels – Corn, Wheat, Beans, Silver
5. Futures Economic Reports for Tuesday May 14, 2013

Hello Traders,

For 2013 I would like to wish all of you discipline and patience in your trading! 

The last 10 days or so we have seen most sessions to behave like today: Narrow range, low volume, “manipulated market feeling”. Characteristics I personally DEFINITELY don’t like for day trading. But the bottom line the market is what the market is and as traders we need to understand the type of market we are in and adjust as quickly as possible.

Continue reading “Futures Trading Levels and Economic Reports for May 14, 2013”

Levels and Economic Reports for April 30, 2013

Connect with Us! Use Our Futures Trading Levels and Economic Reports RSS Feed.

Like us on FacebookFollow us on TwitterView our profile on LinkedInFind us on Google+Cannon Trading Futures Trading Resistance & Support Levels and Economic ReportsFind us on Yelp

1. Market Commentary
2. Futures Support and Resistance Levels – S&P, Nasdaq, Dow Jones, Russell 2000, Dollar Index
3. Commodities Support and Resistance Levels – Gold, Euro, Crude Oil, T-Bonds
4. Commodities Support and Resistance Levels – Corn, Wheat, Beans, Silver
5. Futures Economic Reports for Tuesday April 30, 2013

Hello Traders,

For 2013 I would like to wish all of you discipline and patience in your trading! 


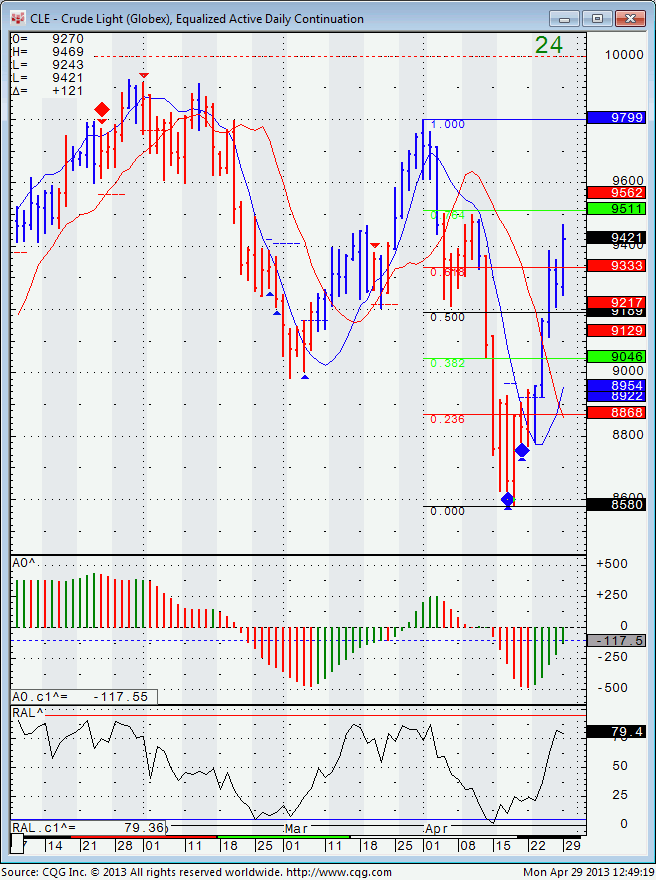
This month we witnessed some big moves in crude oil market. Sharp sell off followed by strong bounce. The market is now approaching the 95 level, which is approximately 76% Fibonacci level and may act as a decision level to whether crude wil continue higher or resume the sell off that started earlier this month.

Daily chart for your review below


crude oil daily chart


Like us on FacebookFollow us on TwitterView our profile on LinkedInFind us on Google+Cannon Trading Futures Trading Resistance & Support Levels and Economic ReportsFind us on Yelp

Futures Trading Levels and Economic Reports for April 23, 2013


Jump to a section in this post:

1. Market Commentary
2. Futures Support and Resistance Levels – S&P, Nasdaq, Dow Jones, Russell 2000, Dollar Index
3. Commodities Support and Resistance Levels – Gold, Euro, Crude Oil, T-Bonds
4. Commodities Support and Resistance Levels – Corn, Wheat, Beans, Silver
5. Futures Economic Reports for Tuesday April 23, 2013

Hello Traders,

For 2013 I would like to wish all of you discipline and patience in your trading! 

To get a little bit longer term picture, I am sharing my mini SP 500 weekly chart with you. The way I view this chart is that failure to break above 1585 can signal medium term exhaustion of buying and can trigger a visit of 1507. But again…this is just my personal view based on the weekly chart and I have been wrong before, that’s for sure.


mini sp 500 weekly chart


RISK DISCLOSURE: Past results are not necessarily indicative of future results. The risk of loss in futures trading can be substantial, carefully consider the inherent risks of such an investment in light of your financial condition.

Futures Trading Levels and Economic Reports for April 19, 2013


Jump to a section in this post:

1. Market Commentary
2. Futures Support and Resistance Levels – S&P, Nasdaq, Dow Jones, Russell 2000, Dollar Index
3. Commodities Support and Resistance Levels – Gold, Euro, Crude Oil, T-Bonds
4. Commodities Support and Resistance Levels – Corn, Wheat, Beans, Silver
5. Futures Economic Reports for Friday April 19, 2013

Hello Traders,

For 2013 I would like to wish all of you discipline and patience in your trading! 


On a different note this time.


I get asked by many clients as to which charting software I use/ recommend.


I really like CQG and share my CQG charts many times on this blog, however CQG is a premium product that is mostly used by professionals and institutions. For the retail client I find sierra charts to be an amazing package! It offers so many studies, customization, ease of use and much more.

Not just that, if you are a client of Cannon trading who uses the AT software, you can get sierracharts for free as long as you trade 10 contracts per month. otherwise it is $15.95 per month.


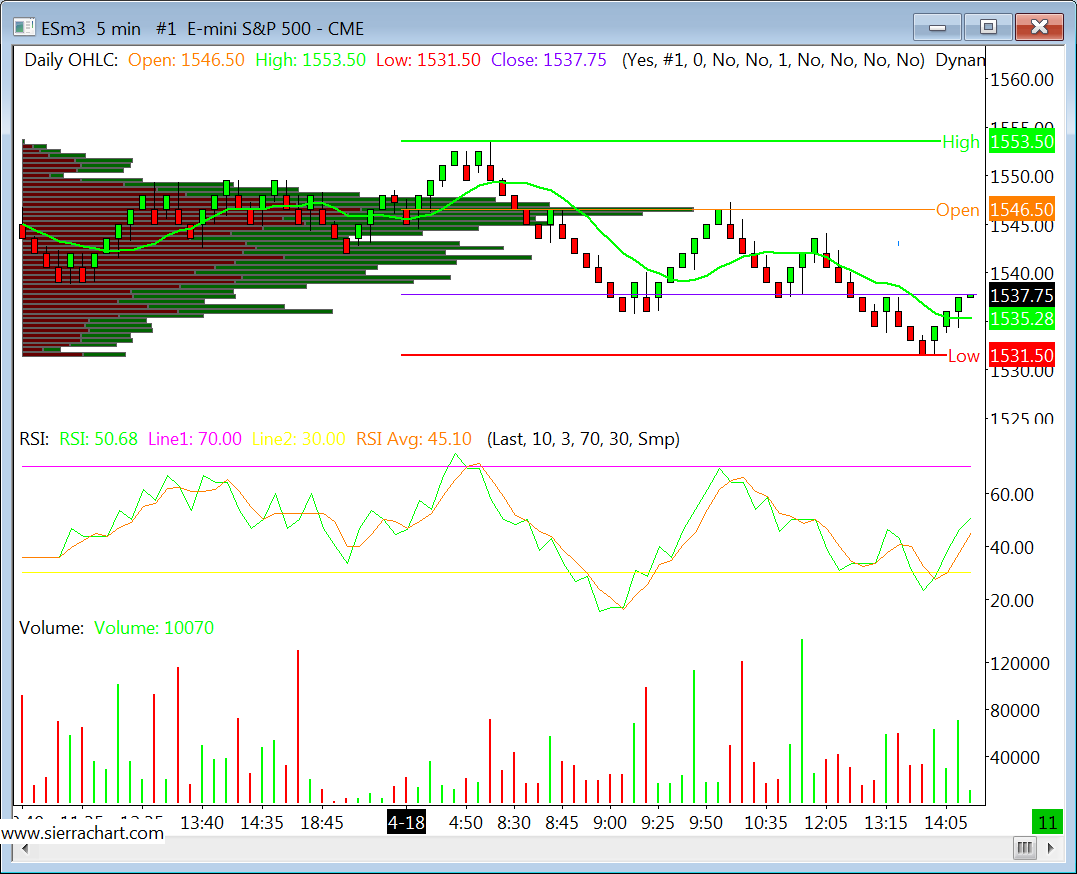
Here is a quick screen shot I took today of sierra chart. If you like a free trial, please visit us or email me back.


mini S&P 5 minute chart


Trading Levels and Economic Reports for March 26, 2013


Jump to a section in this post:

1. Market Commentary
2. Support and Resistance Levels – S&P, Nasdaq, Dow Jones, Russell 2000, Dollar Index
3. Support and Resistance Levels – Gold, Euro, Crude Oil, T-Bonds
4. Support and Resistance Levels – Corn, Wheat, Beans, Silver
5. Economic Reports for Tuesday March 26, 2013


Hello Traders,

For 2013 I would like to wish all of you discipline and patience in your trading! 

The mental part of trading and especially day-trading is so big!….
So many ways one can make a mistake.

Here are just a few…

Doubling down
Revenge trading
Not placing a stop when you normally do
Setting up daily target profits and daily loss limits and then not following it….

and the list goes on and on.

I think the biggest battle, once one has a method he or she feels comfortable and confident with is to follow one of the simplest, oldest rules in our business:

“Plan your trade, trade your plan”

On a different note, Happy Passover !


Also please like us on Facebook
!!

Continue reading “Trading Levels and Economic Reports for March 26, 2013”

Trading Levels and Economic Reports for March 22, 2013


Jump to a section in this post:

1. Market Commentary
2. Support and Resistance Levels – S&P, Nasdaq, Dow Jones, Russell 2000, Dollar Index
3. Support and Resistance Levels – Gold, Euro, Crude Oil, T-Bonds
4. Support and Resistance Levels – Corn, Wheat, Beans, Silver
5. Economic Reports for Friday March 22, 2013


Hello Traders,

For 2013 I would like to wish all of you discipline and patience in your trading! 

I am noticing a bit more volatility coming back into the stock index futures, which I personally like better for day trading. However with increased volatility, comes increased risk….

When the market is experiencing higher volatility and two sided action, I like to use a couple of indicators i created over the last few years and apply them to renko charts, which I use sierra charts/ ATcharts for.

below is a good example from todays session.  The chart below is for the June mini SP, using renko chart.
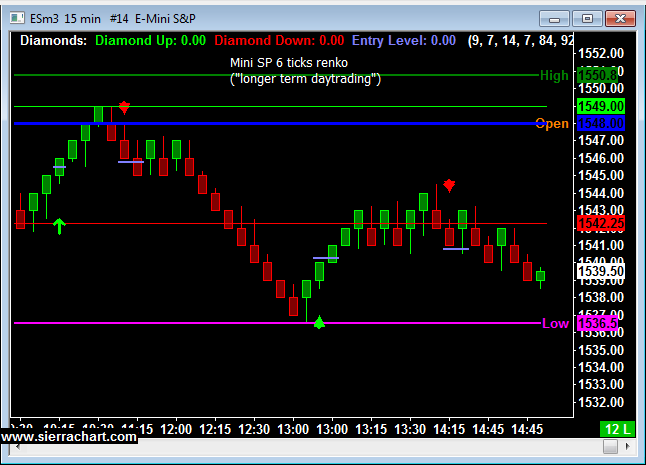
Mini S&P 15 minute renko chart


If you like more information or to try some of my day trading templates, please reply below:1. Are you currently trading futures?2. Charting software you use?3. If you use sierra or ATcharts, please let me know the user name so I can enable you

4. Markets you currently trading?


HYPOTHETICAL PERFORMANCE RESULTS HAVE MANY INHERENT LIMITATIONS, SOME OF WHICH ARE DESCRIBED BELOW.  NO REPRESENTATION IS BEING MADE THAT ANY ACCOUNT WILL OR IS LIKELY TO ACHIEVE PROFITS OR LOSSES SIMILAR TO THOSE SHOWN.  IN FACT, THERE ARE FREQUENTLY SHARP DIFFERENCES BETWEEN HYPOTHETICAL PERFORMANCE RESULTS AND THE ACTUAL RESULTS SUBSEQUENTLY ACHIEVED BY ANY PARTICULAR TRADING PROGRAM.


ONE OF THE LIMITATIONS OF HYPOTHETICAL PERFORMANCE RESULTS IS THAT THEY ARE GENERALLY PREPARED WITH THE BENEFIT OF HINDSIGHT.  IN ADDITION, HYPOTHETICAL TRADING DOES NO INVOLVE FINANCIAL RISK, AND NO HYPOTHETICAL TRADING RECORD CAN COMPLETELY ACCOUNT FOR THE IMPACT OF FINANCIAL RISK IN ACTUAL TRADING.  FOR EXAMPLE, THE ABILITY TO WITHSTAND LOSSES OR TO ADHERE TO A PARTICULAR TRADING PROGRAM IN SPITE OF TRADING LOSSES ARE MATERIAL POINTS WHICH CAN ALSO ADVERSELY AFFECT ACTUAL TRADING RESULTS.  THERE ARE NUMEROUS OTHER FACTORS RELATED TO THE MARKETS IN GENERAL OR TO THE IMPLEMENTATION OF ANY SPECIFIC TRADING PROGRAM WHICH CANNOT BE FULLY ACCOUNTED FOR IN THE PREPARATION OF HYPOTHETICAL PERFORMANCE RESULTS AND ALL OF WHICH CAN ADVERSELY AFFECT ACTUAL TRADING RESULTS


Also please like us on Facebook
!!