Trading Levels and Reports for January 24, 2013


Jump to a section in this post:

1. Market Commentary
2. Support and Resistance Levels – S&P, Nasdaq, Dow Jones, Russell 2000, Dollar Index
3. Support and Resistance Levels – Gold, Euro, Crude Oil, T-Bonds
4. Support and Resistance Levels – Corn, Wheat, Beans, Silver
5. Economic Reports for Thursday January 24, 2013


Hello Traders,

For 2013 I would like to wish all of you discipline and patience in your trading!

Very tight range today ahead of Apples earnings.If you are a stock index traders, make sure you are aware what earnings are scheduled and when as these earnings definitely affect the index futures.
Here is highlights of earnings schedule for tomorrow:

24. JAN. 2013    Today´s Highlighted Earnings Releases btn fullList
spacer
misc enhanced SYMBOL COMPANY EVENT TITLE EPS ESTIMATE EPS ACTUAL PREV. YEAR ACTUAL DATE/TIME (ET)
misc enhanced BMY Bristol-Myers Squibb Co Q4 2012 Bristol-Myers Squibb Earnings Release $ 0.43 n/a $ 0.53 24-Jan BMO
misc enhanced JNPR Juniper Networks Inc Q4 2012 Juniper Networks Earnings Release $ 0.22 n/a $ 0.28 24-Jan AMC
misc enhanced BAX Baxter International Inc Q4 2012 Baxter International Inc. Earnings Release $ 1.26 n/a $ 1.17 24-Jan BMO
misc enhanced LMT Lockheed Martin Corp Q4 2012 Lockheed Martin Earnings Release $ 1.82 n/a $ 2.14 24-Jan BMO
misc enhanced SBUX Starbucks Corp Q1 2013 Starbucks Earnings Release $ 0.57 n/a $ 0.50 24-Jan AMC
misc enhanced RTN Raytheon Co Q4 2012 Raytheon Earnings Release $ 1.31 n/a $ 1.58 24-Jan 7:00 AM


Trading Levels and Reports for January 23, 2013


Jump to a section in this post:

1. Market Commentary
2. Support and Resistance Levels – S&P, Nasdaq, Dow Jones, Russell 2000, Dollar Index
3. Support and Resistance Levels – Gold, Euro, Crude Oil, T-Bonds
4. Support and Resistance Levels – Corn, Wheat, Beans, Silver
5. Economic Reports for Wednesday January 23, 2013


Hello Traders,

For 2013 I would like to wish all of you discipline and patience in your trading!

Market continues to extend it’s rally and we are getting close to what I consider major resistance right at 1498 (which is almost the same as the psychological 1500 level). Personally, I like to see the market price action going down before entering a short trade, i.e just because we are getting close to the major resistance levels does not mean I will enter a short, BUT if price action generates a sell signal, it will give me more confidence in taking that short. Until then I will be watching for this possible swing/medium term type of trade and will do my best not to let it interfere with day-trades set up which are a whole different time frame.
mini sp 500 daily chart jan 22 2013


Trading Levels and Reports for January 18, 2013


Jump to a section in this post:

1. Market Commentary
2. Support and Resistance Levels – S&P, Nasdaq, Dow Jones, Russell 2000, Dollar Index
3. Support and Resistance Levels – Gold, Euro, Crude Oil, T-Bonds
4. Support and Resistance Levels – Corn, Wheat, Beans, Silver
5. Economic Reports for Friday January 18, 2013


Hello Traders,

For 2013 I would like to wish all of you discipline and patience in your trading!

Today I don’t have any words of wisdom or market outlook to share, so I will just wish everyone a nice rest of the day and a great trading day tomorrow.
Levels and reports for your review below.


Trading Levels and Reports for January 17, 2013


Jump to a section in this post:

1. Market Commentary
2. Support and Resistance Levels – S&P, Nasdaq, Dow Jones, Russell 2000, Dollar Index
3. Support and Resistance Levels – Gold, Euro, Crude Oil, T-Bonds
4. Support and Resistance Levels – Corn, Wheat, Beans, Silver
5. Economic Reports for Thursday January 17, 2013


Hello Traders,

For 2013 I would like to wish all of you discipline and patience in your trading!

Last few days we witnessed lower than average volume and volatility. Tight ranges relatively.
Different type of market environments, require different techniques in my opinion. Understand the market environment you are trading in and adjust accordingly.


Trading Levels and Reports for January 16, 2012


Jump to a section in this post:

1. Market Commentary
2. Support and Resistance Levels – S&P, Nasdaq, Dow Jones, Russell 2000, Dollar Index
3. Support and Resistance Levels – Gold, Euro, Crude Oil, T-Bonds
4. Support and Resistance Levels – Corn, Wheat, Beans, Silver
5. Economic Reports for Wednesday January 16, 2013


Hello Traders,

For 2013 I would like to wish all of you discipline and patience in your trading!


Risk Management for Technical Traders [Interview Excerpt]

Tips from EWI Senior Analyst Jeffrey Kennedy’s Stocks and Commodities interview
By Elliott Wave International

“Being an analyst and trader involves two totally separate skill sets. As an analyst, you are a master of observation. You are focusing on what could happen. As a trader, your primary focus is on what is happening…” Read more.


Trading Levels and Reports for January 15, 2013


Jump to a section in this post:

1. Market Commentary
2. Support and Resistance Levels – S&P, Nasdaq, Dow Jones, Russell 2000, Dollar Index
3. Support and Resistance Levels – Gold, Euro, Crude Oil, T-Bonds
4. Support and Resistance Levels – Corn, Wheat, Beans, Silver
5. Economic Reports for Tuesday January 15, 2013


Hello Traders,

For 2013 I would like to wish all of you discipline and patience in your trading!


Using Volume Charts for Day-Trading:


My theory is that when it comes to short term day trading, volume is much more important than time, hence I use volume bars/charts quite a bit. I use bars of between 1,000 to 18,000 contracts traded (pending the specific market, based on recent volatility, average daily trade volume and a few other factors). That means that instead of bars completing based on time frame (i.e. 1 minute or 15 minutes etc.), I use volume instead of time. So each time X,000 contracts traded, a new bar will complete. When the specific market has high volume and is moving fast, the bars will complete faster. When market is in low volume without much action, the bars will complete slower.


For me personally, this has helped getting signals ahead of time when there is fast action in the market and avoiding false signals when volume is low.


Trading Levels and Reports for January 10, 2013


Jump to a section in this post:

1. Market Commentary
2. Support and Resistance Levels – S&P, Nasdaq, Dow Jones, Russell 2000, Dollar Index
3. Support and Resistance Levels – Gold, Euro, Crude Oil, T-Bonds
4. Support and Resistance Levels – Corn, Wheat, Beans, Silver
5. Economic Reports for Thursday January 10, 2013


Hello Traders,

For 2013 I would like to wish all of you discipline and patience in your trading!


Some days are just losing days….Don’t fight it. You will have losing days. I have been in the futures industry for 15 years now and never have I met a trader who did not have a losing day…and  I will never meet one….impossible. 

Understand it and accept it.  One of your hardest jobs as a day trader is to make sure a losing day does NOT become a disaster…Our human emotions and our brain is not programmed very well to learn how to lose. Yet one of the key differences between traders and those who try to become “traders”…is that traders first learn how to lose. They understand losing is part of trading. The others, refuse to take a lose and will make many mistakes along the way to make a “normal losing” day into a disaster. That may be carrying positions overnight when they normally don’t, reversing, pyramiding and many other mistakes that they would normally not make. That turns a “normal losing day” (maybe for an acct of $10,000, a normal losing day would be down $500?) into one of those days where they wipe out half of their account.


Sometimes we need to learn how to lose before we can excel in trading.


Trading Levels and Reports for January 9, 2013


Jump to a section in this post:

1. Market Commentary
2. Support and Resistance Levels – S&P, Nasdaq, Dow Jones, Russell 2000, Dollar Index
3. Support and Resistance Levels – Gold, Euro, Crude Oil, T-Bonds
4. Support and Resistance Levels – Corn, Wheat, Beans, Silver
5. Economic Reports for Wednesday January 9, 2012


Hello Traders,

For 2013 I would like to wish all of you discipline and patience in your trading!


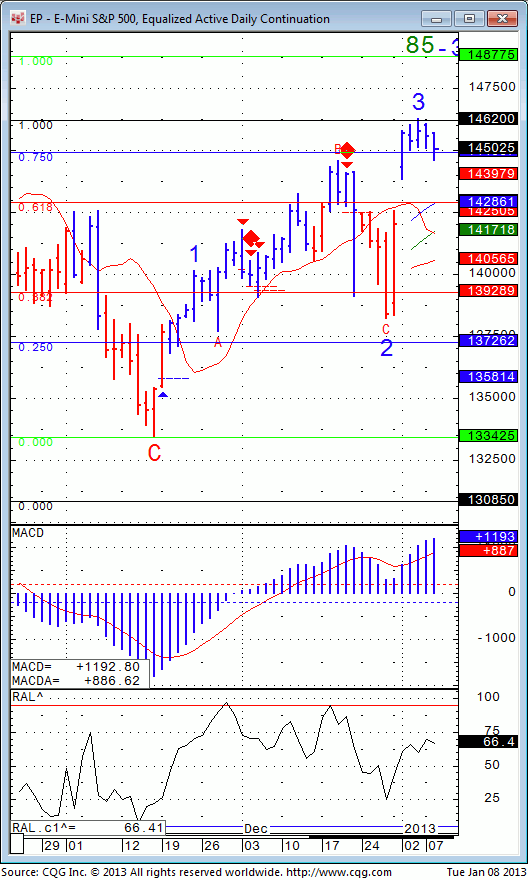
Daily chart of the mini SP 500 for your review below. While I still think the medium term outlook for this market is higher, I believe that we may see”filling the gap” around 1428 before a move higher.
mini Sp 500 daily chart


Trading Levels and Reports for January 8, 2013


Jump to a section in this post:

1. Market Commentary
2. Support and Resistance Levels – S&P, Nasdaq, Dow Jones, Russell 2000, Dollar Index
3. Support and Resistance Levels – Gold, Euro, Crude Oil, T-Bonds
4. Support and Resistance Levels – Corn, Wheat, Beans, Silver
5. Economic Reports for Tuesday January 8, 2012


Hello Traders,

For 2013 I would like to wish all of you discipline and patience in your trading!


Today we had one of these Mondays where the market had no major reports, low volume and just a choppy none directional market move.

Reminded me about a quick paragraph I wrote once and still holds true, so decided to share with you:

  • In my opinion there are 3 main types of trading days.

1. The most common day are two sided trading action with swings up and down – this type of trading day is most suitable for using support and resistance levels along with overbought/oversold indicators.

2. Strong trending days, mostly one directional – this type of trading day is the least common, many times will happen on Mondays and maybe 3-5 times a month at most – this type of trading day is most suitable for using ADX, MACD crossovers and pretty much looking for pullbacks to jump on the trend.

3. Slow and/or choppy trading days – this type of trading day is best suited for taking small profits from the market by looking at volume spikes, using stochastics as possible entry signals and usually wait for a pullback before jumping in.

  • A good question I’ve been asked is how can one asses what type of trading day we will have while the market is still trading….I have been doing some work in finding the answers and will be happy to hear feedback via email but here are some initial observations:
    1. Was the overnight session a wide, two sided trading range? If the answer is yes, good chances for similar trading day during the primary session (primary session is when the cash/stock market is open)
    2. Mondays have the highest chance for trending days
    3. The behavior of the first hour of trading can also suggests the type of action for the rest of the day.
    4. If the first 30 minutes of the trading day have good volume, better chances for type 1 or type 2 trading days.
    5. Low volume during the first 30 minutes can suggest a choppy (type 3 trading day)


Trading Levels and Reports for January 4, 2013


Jump to a section in this post:

1. Market Commentary
2. Support and Resistance Levels – S&P, Nasdaq, Dow Jones, Russell 2000, Dollar Index
3. Support and Resistance Levels – Gold, Euro, Crude Oil, T-Bonds
4. Support and Resistance Levels – Corn, Wheat, Beans, Silver
5. Economic Reports for Friday January 4, 2012


Hello Traders,

For 2013 I would like to wish all of you discipline and patience in your trading!


Volatile session with average volume as some traders are still out.


Monthly unemployment report tomorrow! Be aware as this is a market moving event.
The gap open on Wednesday morning “needs to be filled” so we may see some more pressure down but over all I think the market is still strong so my output for swing or medium term trades is wait for lower prices to buy call options ( to “fill the gap” we need to see the market at 1425).
As far as day-trading, there are many ways and techniques to lose…and make money. I think the main factor for most daytraders is money management and discipline.