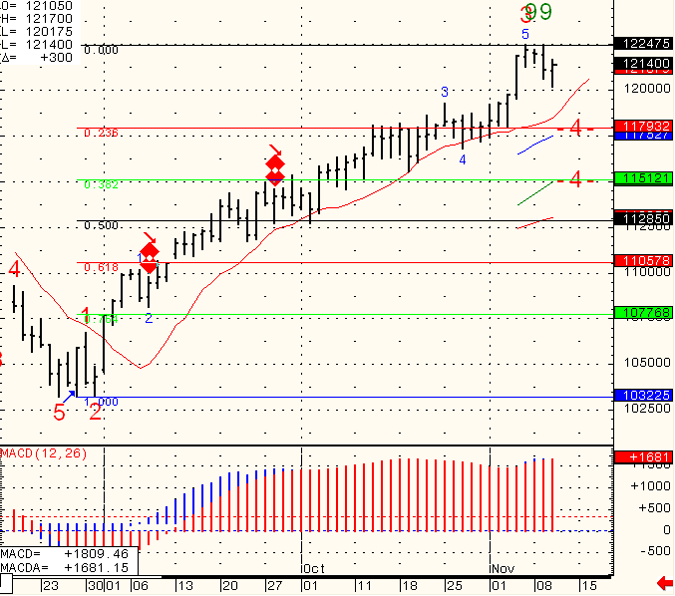
“Looks like 1122 should be a decision level based on the chart below.”
Well very similar comments today…… looks like 1122.75 should be decision level if we are to break upside, while 1105.75 to 1109.25 is the support to watch. Chart for your review below.
Market had some what of an odd rhythm today after the long weekend. We saw big moves in both currencies and bonds. I think that we should see clearer picture tomorrow as more traders will be back after Labor day + we have a few economic reports while today we did not have any reports.
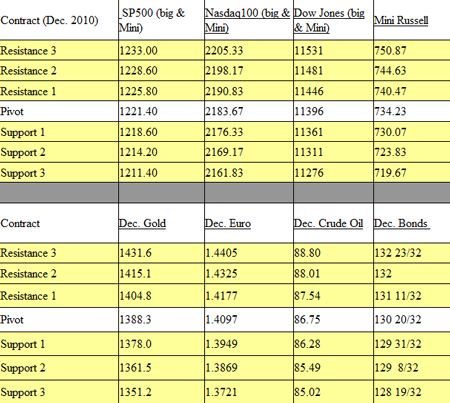
Some levels to watch for tomorrows action from the hourly chart below.
“We are Trading Right Against a Major Retracement Level at 1106.50”
I mentioned a couple of days ago that this morning report will determine if we can reach the 1100’s on the SP. Well the answer turned out to be YES. As always in the futures business the current question of what’s next is more important than the previous one….
Well we are trading right against a major retracement level at 1106.50.
As long as pull backs do NOT break 1093, my bias is to the upside. Tuesday should be interesting as we should get an indication if the upside momentum has more legs or not.
Until then, enjoy the long weekend, recharge. Keep in mind the regular session is closed Monday but there is a night session Sunday night and Monday night. More info below.
We have a full day of reports tomorrow, including FOMC MINUTES. that should be a recipe for a much different trading day than we had today.
I would categorize today’s session, as lower volume, lower volatility but yet wide enough ranges on the stock indices to produce different set ups to go with the reversal trend. If I had to guess for tomorrow session, I would guess higher volatility with swings in both direction. Knowing what type of trading day you are in early enough or the type of personality the market is having on any certain trading day is HUGE in my opinion as different types of trading days require different approaches/ methods and trading style.
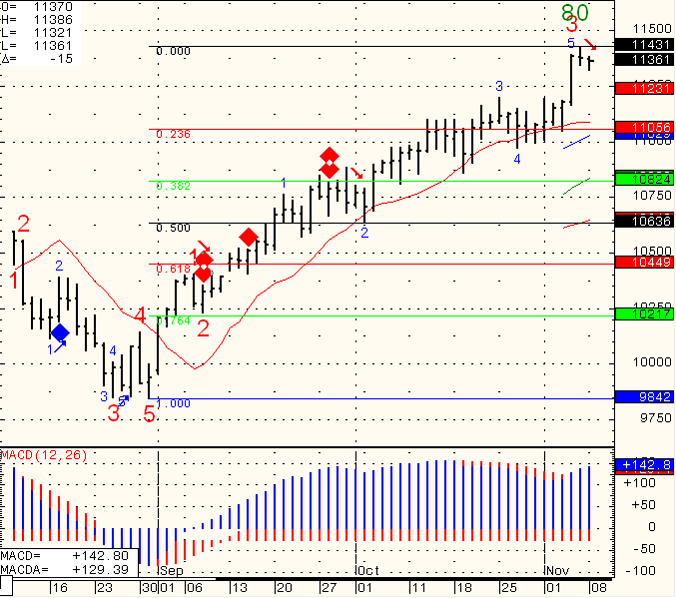
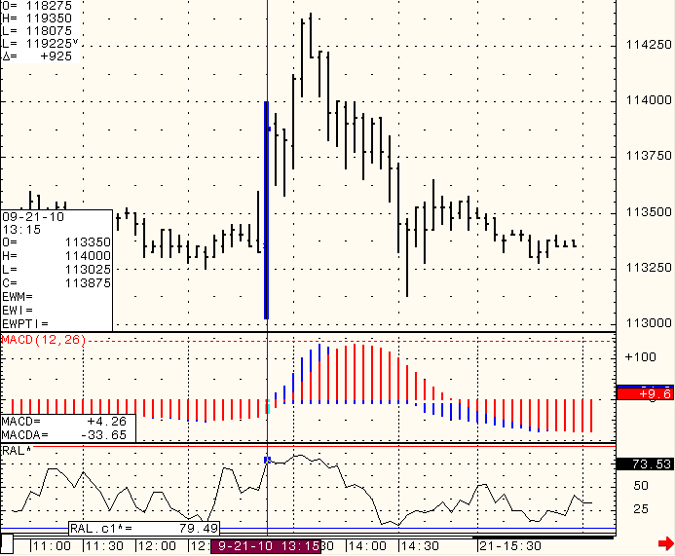
We bounced pretty good from major support early this morning. Some levels to pay attention to as we start a new week in the mini Dow chart below. Until then, relax, clear your head from trading, “what you could have done and should have done” etc…..write a journal if needed, learn from mistakes when you can but don’t let negative energy hurt your trading.
Have a great weekend!
YM – E-Mini Dow Futures – $5 Multiplier, Equalized Active Daily Continuation
Market is showing weakening signs. We need to hold previous lows of 1037 and rally in order to gain any upside momentum. Break of this level can bring 1000.75 much quicker.
I have a feeling traders will have potential for trades on both sides depending on volatility and pre market GDP report tomorrow.
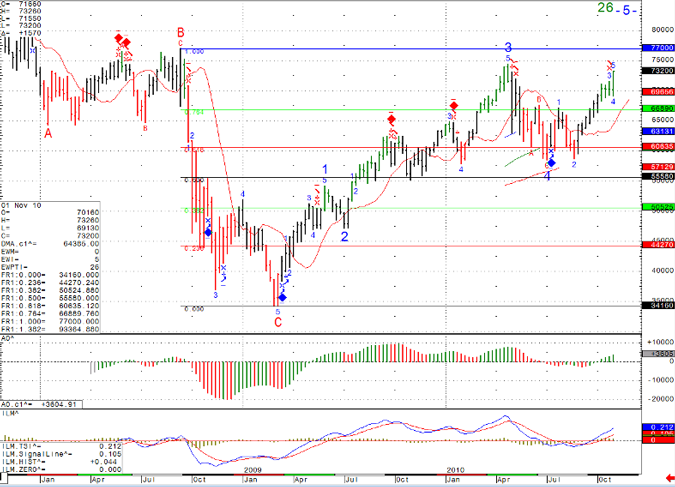
A chart of the SP 500 CASH INDEX for your review below:
SPC5 – Standard & Poor’s 500 Index (S&P 500), Daily
Somewhat of a quiet day on the futures exchange to start the week after some volatile sessions last week. As I’ve said many times before, if a trader can recognize early enough during the trading session, what type of trading day is about to unfold, then one can use the proper day-trading technique more suitable for that day.
Some examples may include: join the trend on trending day, mean aversion techniques on choppy days and much more.
On a different note, I got a blue diamond for tomorrow’s session which can mean potential up day if the market can break above 1083.00 or….continued decline if it fails to gain some upside momentum. Daily chart for review below:
EP – E- Mini S&P 500, Equal Active Daily Continuation
RISK DISCLOSURE: Past results are not necessarily indicative of future results. The risk of loss in futures trading can be substantial, carefully consider the inherent risks of such an investment in light of your financial condition.