What are the Best Approaches for Long-Term Gold Futures Price Forecasting?

Author: Mark O’Brien, Senior Broker at Cannon Trading Co, Inc.

There is no easy answer to what the best strategy is to predicting price movement in gold futures, much less any other commodity.  Given that rather glum starting point, there are approaches that analysts and economists use to forecast prices.  One most commonly employed is the use of broad-based commodity indexes – in which prices of food, energy, other metals, lumber, etc. are aggregated to gauge overall commodity price inflation – or the lack thereof.

Another strategy is to look for trends in the economic measurements of major developed and developing countries, such as business and consumer confidence, retail sales, interest rates, production of energy products (unleaded gas, heating oil, jet fuel, natural gas) and industrial metals (steel, aluminum).  These can also be aggregated to provide a broader reflection of global inflation. Continue reading “What are the Best Approaches for Long-Term Gold Futures Price Forecasting?”

Gold Futures VS Gold ETFs (GCL, IAU) by Matt Kang

By Matt Kang, Senior Broker @ Cannon Trading Co, Inc.

Gold is the most actively traded precious metal and it is a good hedge against inflation that is why many individuals and institutional investors are investing in gold  to keep their assets by declining dollar and US stock values. Retail access to gold trading has broadened substantially through the futures and gold ETFs.

Let’s take a look at the key difference between gold futures and gold ETFs.

  • Where they traded?

Gold future (GC) is trading at COMEX and GOLD ETFs (GLD/IAU) is traded through securities exchanges. Continue reading “Gold Futures VS Gold ETFs (GCL, IAU) by Matt Kang”

Futures Trading Tips, Levels & Reports 8.15.2014

Hello Traders,

For 2014 I would like to wish all of you discipline and patience in your trading!


Just like a basketball player doesn’t just show up for the game a minute before and starts playing, so does a trader need to prepare him/herself for trading.


You may not need to warm or shoot around but it definitely does not hurt to visualize successful trading, be rested, relaxed and more specifically, know the following:


↔What reports are coming out

↔Overview of longer time frames

↔Key support and resistance levels

↔Go over your equity run

↔Make sure your surroundings will enable you to trade

↔Fit trading into your schedule, life style not viceversa

↔E-mail us to be added to a daily newsletter which outlines reports and levels for each trading day


Continue reading “Futures Trading Tips, Levels & Reports 8.15.2014”

Gold Daily Continuation Chart – Levels & Reports 8.14.2014

Hello Traders,

For 2014 I would like to wish all of you discipline and patience in your trading!


So I was doing some research and signal evaluator work on some candlesticks formation to go along with some of the conditions I like to use and figured might as well share some of the basic knowledge with my readers…

The following is taken from my CQG trading/chart terminal. If anyone is interested in a free trial, feel free to email me or visit our CQG section on our website.

So today, two formations I started exploring:

1. Engulfing Bearish

The Engulfing Bearish formation is, of course, a bearish formation and therefore its symbol (EG) will always appear at the top of the formation. It represents the opposite of the Engulfing Bullish formation. Three criteria establish an Engulfing Bearish formation:

*The market has to be in a clearly definable up-trend, even if the trend is short term.

*Of the 2 candlesticks in the formation, the second candle’s real body must engulf the first candle’s real body.

*The second real body of the formation should be “down” while the first real body should be “up.”


2. Engulfing Bullish

The Engulfing Bullish formation is, of course, a bullish formation and therefore its symbol (EG) will always appear at the bottom of the formation. It represents the opposite of the Engulfing Bearish formation. Three criteria establish an Engulfing Bullish formation:

*The market has to be in a clearly definable downtrend, even if the trend is short term.

*Of the 2 candlesticks in the formation, the second candle’s real body must engulf the first candle’s real body.

*The second real body of the formation should be “up” while the first real body should be “down.”
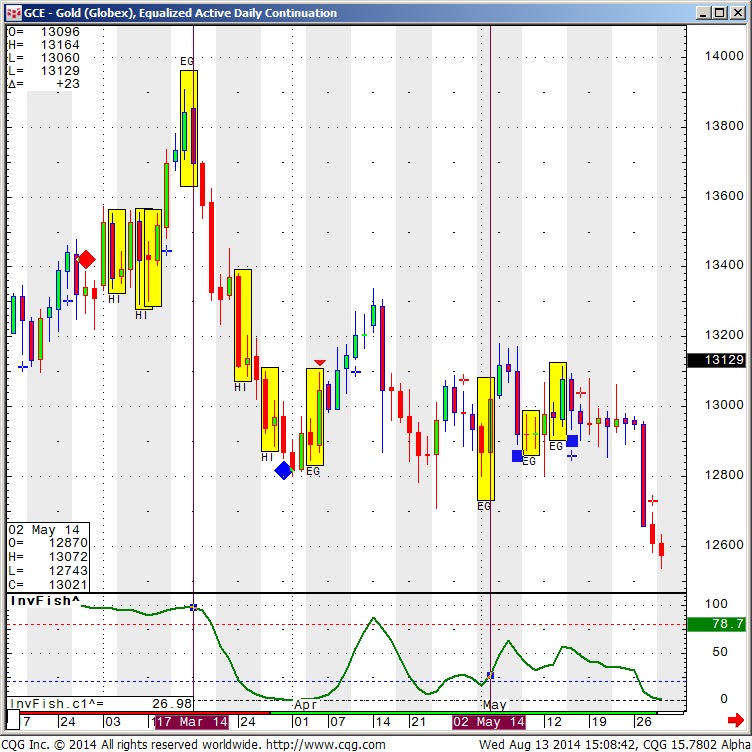
 

824


Above is a daily chart of Gold futures, going back to March 17th 2014 where one can see a good example of the ” Bearish EG”  formation and yet in the same exact chart you can see a failed “Bullish EG” formation on May 2nd 2014.


Will continue and explore a few other candlesticks formations over the next couple of weeks.

Continue reading “Gold Daily Continuation Chart – Levels & Reports 8.14.2014”

Crude Oil and Gold Futures Chart, Futures Levels and Economic Reports 2.12.2013

Connect with Us! Use Our Futures Trading Levels and Economic Reports RSS Feed.

Like us on FacebookFollow us on TwitterView our profile on LinkedInFind us on Google+Cannon Trading Futures Trading Resistance & Support Levels and Economic ReportsFind us on Yelp

1. Market Commentary
2. Futures Support and Resistance Levels – S&P, Nasdaq, Dow Jones, Russell 2000, Dollar Index
3. Commodities Support and Resistance Levels – Gold, Euro, Crude Oil, T-Bonds
4. Commodities Support and Resistance Levels – Corn, Wheat, Beans, Silver
5. Futures Economic Reports for Wednesday February 12, 2014

Hello Traders,

For 2014 I would like to wish all of you discipline and patience in your trading!


Trader Planet


Voted Best Blog 2013 by Trader Planet

Thanks everyone who voted!! Appreciate your help in winning the #1 blog for futures trading by Trader Planet!! Please feel free to forward our daily blog to friends and other fellow traders who might be interested.

Another two markets I like to touch on when it comes to “other markets to daytrade beside the mini SP 500” are crude Oil and Gold futures.

More than a few similarities between the two markets.

They are both volatile, can move VERY fast. I have seen some very large moves happen in matter of minutes if not seconds. The “fear & greed” factor really plays a role in these specific two markets.

Both have active trading hours starting with Far East trading around 10 PM est all the way to the next morning until about 3 PM est. Good volume generally speaking but not close to the mini SP or ten year notes. So you may see some slippage on stops but the volume is more than enough to trade size.

Each tick on gold is $10, so every dollar move =$100 against you or in your favor. Crude is similar, each tick = $10. One full $1 move = $1000.

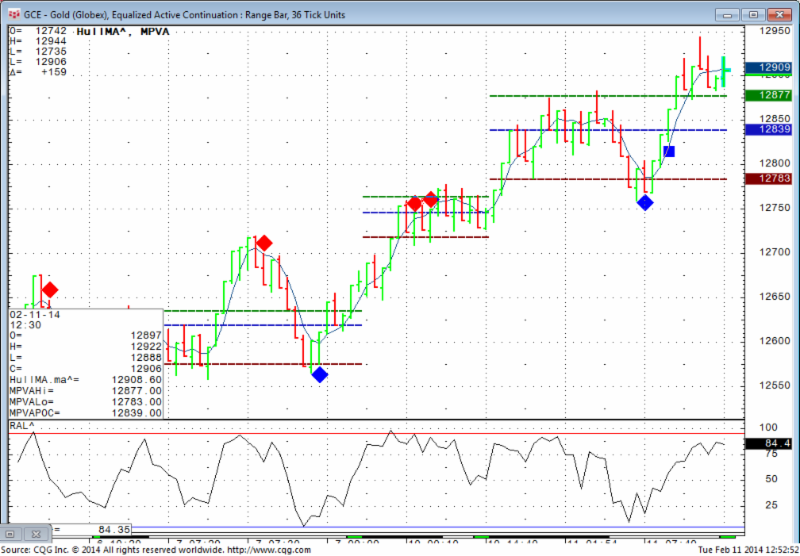
Both markets were quiet today relatively speaking but even on a quiet day, the range on gold was  $21 or = $2100 wide using one futures contract. Crude ranges today was less than $1 or about $890 between hi/lo.

I like using overbought/ oversold indicators on the two markets as well as using range / Renko charts.

If you never traded these markets before, I highly recommend exploring in simulation/ demo mode. get a feel for the explosiveness, volatility, personality for a few weeks before trying in live mode.

As always, any questions, please feel free to email me.

Two charts from today’s session of gold and crude for your review below ( if you like to try the charts I am using along with indicators displayed, send me an email):


Crude 18 ticks range bar Feb. 11th 2014

CLE - Crude Lights (Globex), Equalized Active Continuation - Range Bar 18 Ticks Units

Gold, 36 ticks range bar Feb. 11th 2014


GCE - Gold (Globex), Equalized Active Continuation - Range Bar =, 18 Ticks Units
GCE – Gold (Globex), Equalized Active Continuation – Range Bar =, 18 Ticks Units

Continue reading “Crude Oil and Gold Futures Chart, Futures Levels and Economic Reports 2.12.2013”

Gold Daily & Trading Levels & Economic Reports 11.13.2013

Connect with Us! Use Our Futures Trading Levels and Economic Reports RSS Feed.

Like us on FacebookFollow us on TwitterView our profile on LinkedInFind us on Google+Cannon Trading Futures Trading Resistance & Support Levels and Economic ReportsFind us on Yelp

1. Market Commentary
2. Futures Support and Resistance Levels – S&P, Nasdaq, Dow Jones, Russell 2000, Dollar Index
3. Commodities Support and Resistance Levels – Gold, Euro, Crude Oil, T-Bonds
4. Commodities Support and Resistance Levels – Corn, Wheat, Beans, Silver
5. Futures Economic Reports for Wednesday November 13, 2013

Hello Traders,

For 2013 I would like to wish all of you discipline and patience in your trading! 

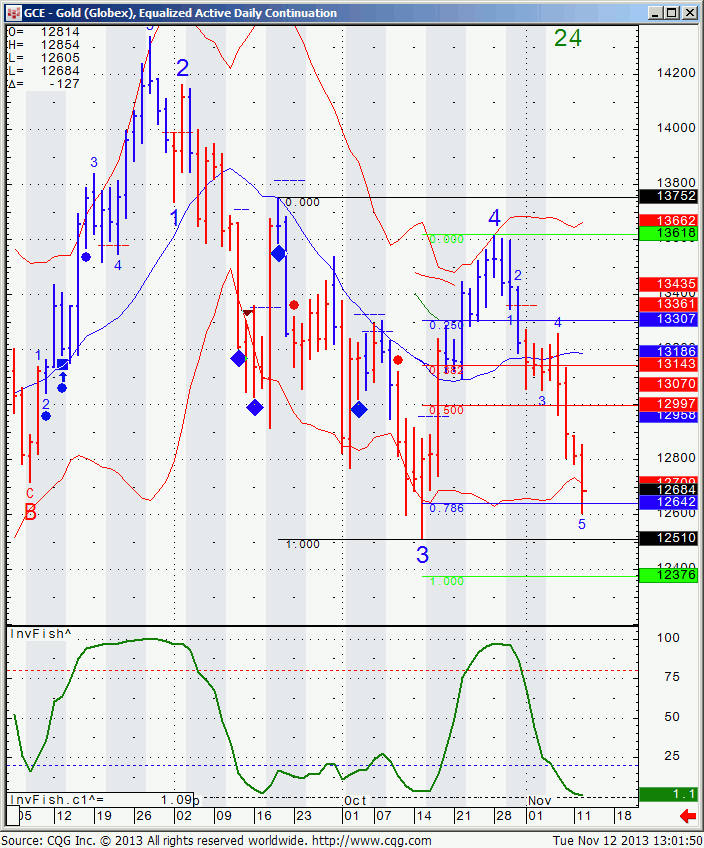
Gold and Silver took a hit today, selling off 1% and 2.5% respectively.

Gold and silver are much different markets in my opinion than mini SP or us tbonds for example. Gold, silver and crude oil for that matter are quite volatile with fear and greed playing a bigger role than in other markets. I have seen these markets make some very large moves intraday at times.

I do think that both gold and crude oil are GOOD markets to observe as potential for day-trading as long as you use stops…if you are a trader that “uses mental stops” , these markets are not for you…Good news is that both crude and gold have a mini contract .

Gold chart for your review below with some possible levels to watch for:

GCE - Gold (Globex), Equalized Active Daily Continuation
GCE – Gold (Globex), Equalized Active Daily Continuation

Continue reading “Gold Daily & Trading Levels & Economic Reports 11.13.2013”

Futures Trading Levels and Economic Reports for August 13, 2013

Connect with Us! Use Our Futures Trading Levels and Economic Reports RSS Feed.

Like us on FacebookFollow us on TwitterView our profile on LinkedInFind us on Google+Cannon Trading Futures Trading Resistance & Support Levels and Economic ReportsFind us on Yelp

1. Market Commentary
2. Futures Support and Resistance Levels – S&P, Nasdaq, Dow Jones, Russell 2000, Dollar Index
3. Commodities Support and Resistance Levels – Gold, Euro, Crude Oil, T-Bonds
4. Commodities Support and Resistance Levels – Corn, Wheat, Beans, Silver
5. Futures Economic Reports for Tuesday August 13, 2013

Hello Traders,

For 2013 I would like to wish all of you discipline and patience in your trading! 

Another slow, summer trading day to start the week in the stock index futures segment. Be careful of this type of trading days. The low volume and narrow ranges can get you too comfortable to trading sloppy….

Sometimes no trade is better than a bad trade. Actually all the time…

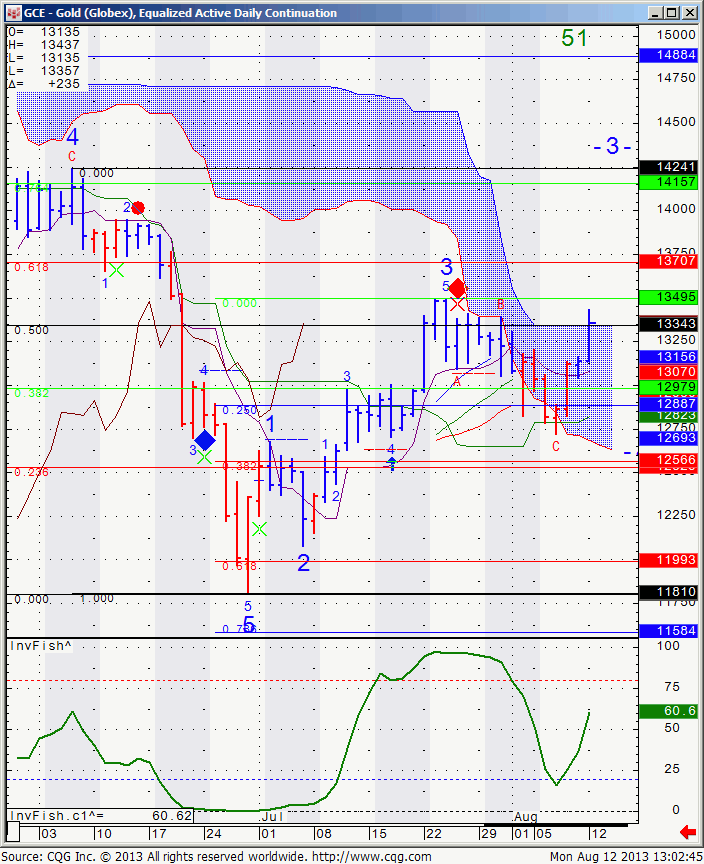
In between gold futures had a nice up move over the last few sessions. Daily chart of Dec. Gold futures for your review below.

Notice that prices closed ABOVE the IMOKU cloud, which is usually a bullish sign. Market needs to confirm this bullish sign by closing above 1349.5.

Gold Futures Daily Chart

Continue reading “Futures Trading Levels and Economic Reports for August 13, 2013”