Daily Support & Resistance and Economic Data to be Released, October 12th 2010


Daily Support & Résistance Levels Mini-S&P 500 Futures
Dec. 10
Mini-Nasdaq 100 Futures
Dec. 10
Mini-Dow Futures
Dec. 10
Mini Russell 2000 Futures
Dec.10
30-year US Bond Futures
Dec. 10
10-Year US Note
Futures Dec. 10
Support 3 1146.00 1989.00 10770 675.90 13209 12607
Support 2 1150.50 2006.00 10851 680.00 13300 12625
Support 1 1155.50 2016.50 10897 684.00 13326 12703
Resistance 1 1165.00 2035.00 10984 696.90 13519 12722
Resistance 2 1171.25 2051.00 11010 701.60 13612 12727.5
Resistance 3 1174.75 2063.00 11115 707.40 12627 12810.5
Daily Support & Resistance Levels
Gold Futures
Dec.2010
Silver Futures
Dec. 2010
Copper Futures
Dec. 2010
Crude Oil Futures
Nov. 2010
Euro Curr.
Dec. 2010
Dollar Index
Dec. 2010
Support 3 1308.5 22.35 3.720 80.30 1.3667 .7705
Support 2 1326.0 22.86 3.750 80.88 1.3740 .7748
Support 1 1341.0 22.96 3.780 81.55 1.3767 .7773
Resistance 1 1356.0 23.31 3.800 82.48 1.3831 .7799
Resistance 2 1366.0 23.40 3.822 83.50 1.3864 .7817
Resistance 3 1375.0 23.67 3.867 84.43 1.3924 .7878

Updated: 12-Oct-10 7:59 ET

This Week’s Calendar

Click on a “Release” for Insight

Date ET Release For Actual Briefing.com Consensus Prior Revised From
Oct 12 14:00 Minutes of FOMC Meeting 9/21
Oct 13 07:00 MBA Mortgage Applications 10/08 NA NA -0.2%
Oct 13 08:30 Export Prices ex-ag. Sep NA NA 0.5%
Oct 13 08:30 Import Prices ex-oil Sep NA NA 0.3%
Oct 13 10:30 Crude Inventories 10/09 NA NA 3.09M
Oct 13 14:00 Treasury Budget Sep -$32.0B -$33.5B -$46.6B
Oct 14 08:30 Initial Claims 10/09 450K 450K 445K
Oct 14 08:30 Continuing Claims 10/02 4450K 4450K 4462K
Oct 14 08:30 PPI Sep 0.1% 0.2% 0.4%
Oct 14 08:30 Core PPI Sep 0.1% 0.1% 0.1%
Oct 14 08:30 Trade Balance Aug -$40.0B -$44.5B -$42.8B
Oct 15 08:30 CPI Sep 0.1% 0.2% 0.3%
Oct 15 08:30 Core CPI Sep 0.1% 0.1% 0.1%
Oct 15 08:30 Retail Sales Sep 0.2% 0.4% 0.4%
Oct 15 08:30 Retail Sales ex-auto Sep 0.1% 0.4% 0.6%
Oct 15 08:30 NY Fed – Empire Manufacturing Survey Oct 3.0% 5.75 4.10
Oct 15 09:55 Mich Sentiment Oct 67.0 68.5 68.2
Oct 15 10:00 Business Inventories Aug 0.4% 0.5% 1.0%

12. OCT. 2010 – Today´s Highlighted Splits

SYMBOL COMPANY EVENT TITLE EPS ESTIMATE EPS ACTUAL PREV. YEAR ACTIVITY DATE/TIME (ET)
INTC Intel Corporation Q3 2010 Intel Corporation Earnings Release $ 0.50 n/a $ 0.33 12-Oct
CSX CSX Corporation Q3 2010 CSX Corporation Earnings Release $ 1.04 n/a $ 0.74 12-Oct AMC
FAST Fastenal Q3 2010 Fastenal Earnings Release & September 2010 Sales Release $ 0.50 n/a $ 0.32 12-Oct BMO
VOXX Audiovox Corporation Q2 2011 Audiovox Corporation Earnings Release $ 0.00 n/a $ 0.04 12-Oct AMC
DIET eDiets.com, Inc. Preliminary Q3 2010 eDiets.com, Inc. Earnings Release n/a n/a n/a 12-Oct BMO
AIP.L AIR PARTNER Preliminary 2010 AIR PARTNER Earnings Release n/a n/a n/a 12-Oct BMO

Continue reading “Daily Support & Resistance and Economic Data to be Released, October 12th 2010”
Daily Support & Resistance and Economic Data to be Released, October 11th 2010


Daily Support & Resistance Levels Mini-S&P 500 Futures
Dec. 10
Mini-Nasdaq 100 Futures
Dec. 10
Mini-Dow Futures
Dec. 10
Mini Russell 2000 Futures
Dec.10
30-year US Bond Futures
Dec. 10
10-Year US Note
Futures Dec. 10
Support 3 1146.25 2001.50 10877 675.20 13209 12615.5
Support 2 1150.75 2013.00 10919 682.80 13300 12624.5
Support 1 1155.75 2020.00 10942 687.00 13326 12702.5
Resistance 1 1165.00 2032.00 10987 695.00 13519 12721
Resistance 2 11.71.25 2051.00 11010 701.60 13612 12726.5
Resistance 3 1174.75 2063.00 11115 707.40 13627 12810.5
Daily Support & Resistance Levels
Gold Futures
Dec.2010
Silver Futures
Dec. 2010
Copper Futures
Dec. 2010
Crude Oil Futures
Nov. 2010
Euro Curr.
Dec. 2010
Dollar Index
Dec. 2010
Support 3 1325.0 22.35 3.720 80.30 1.3781 76.29
Support 2 1337.0 22.86 3.758 81.53 13827 77.05
Support 1 1344.0 23.18 3.780 82.28 1.3873 77.15
Resistance 1 1356.0 23.69 3.820 82.79 1.4023 77.62
Resistance 2 1366.0 23.85 3.835 83.52 1.4067 77.75
Resistance 3 1375.0 24.08 3.867 84.43 1.4138 77.98

Continue reading “Daily Support & Resistance and Economic Data to be Released, October 11th 2010”

Commodity Trading Levels for October 5th 2010

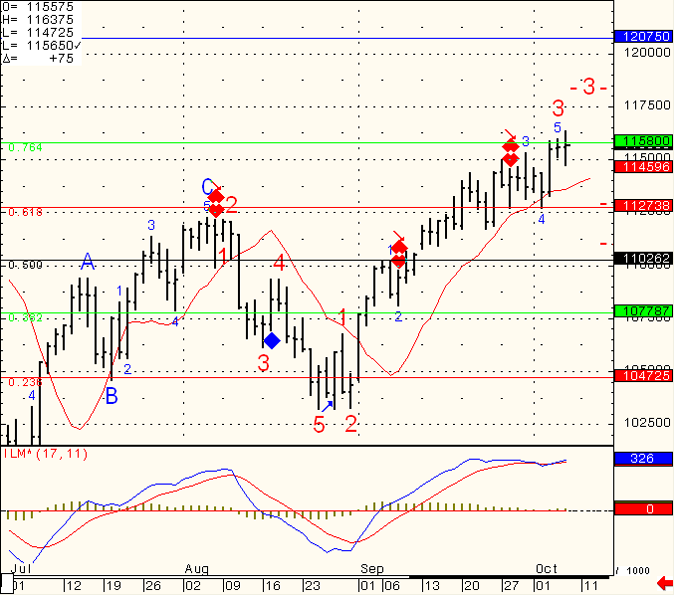
Not an easy market to read right now in my opinion.

It is showing signs like it would like to visit some lower levels, yet there is enough buying interest to keep it above 1127.

This Friday monthly unemployment levels will be watched closely.
If the market breaks below 1127, it has a chance of picking some more speed to the downside.
On the flip side, bulls will need to see new highs in order to get back in control of price action.
Daily chart with some price levels to watch for your review below:

Commodity Futures Trading Charts

Continue reading “Commodity Trading Levels for October 5th 2010”

Futures Trading Levels, October 4th 2010

I wish all of you a great trading month in October.

If the first trading of October is an indication for the rest of the month, than October should be an interesting month….

Currently there is a case for both the bulls and the bears.

Bull camp needs to see a close above 1150 while bear camp needs to see a break below 1125. In between it is an open game for moves in both directions.

Continue reading “Futures Trading Levels, October 4th 2010”

Another Chance for a Free Trial for Intraday Signals for Mini SP500 and Euro Currency, September 30th 2010

I wanted to share some of today’s activity we had in the daily webinar service I hold. The “webinar” is a service I offer, where I share mostly the mini SP chart but also other markets like Euro currency, Crude Oil and Mini Russell.

In the webinar I display my charts, trading indicators, trading algorithm, trade management philosophy, risk management and more.

Some days i also provide live trading examples using my demo, like I did today.

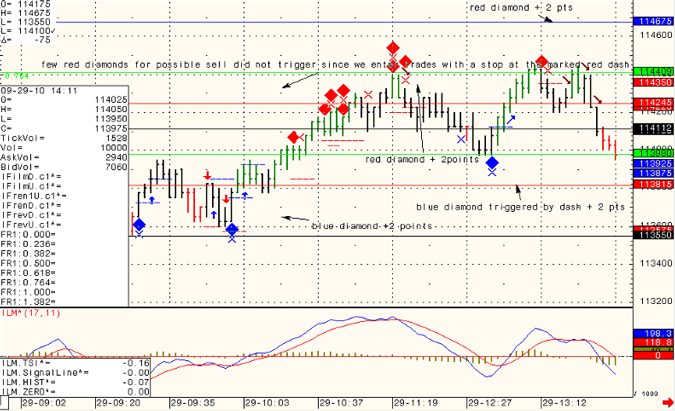
Below you will see a segment from today’s webinar where the DIAMOND algorithm provided us with more than several trade set ups for 2 mini SP points each time.

For free trial and more information, visit: https://www.cannontrading.com/tools/intraday-futures-trading-signals

( NO REPEAT TRIALS )

SP 500 Day Trading
SP 500 Day Trading

Continue reading “Another Chance for a Free Trial for Intraday Signals for Mini SP500 and Euro Currency, September 30th 2010”

Price Levels for Futures Trading, September 28th 2010

Daily chart of Mini SP below. As I mentioned last week, I got a couple of potential “sell signals” and the market only gave us a small decline if that. What is being referred to as “divergence”. Well…I got one more potential for market retracement.

This time the SP will have to drop below 1123 in order for me to enter a short swing position. I call it price conformation. Meaning I would like to see price action confirming my technical speculation. FIB levels on the chart will be used to determine potential targets, stops etc.

Mini SP Future Trading Chart

Continue reading “Price Levels for Futures Trading, September 28th 2010”

617.10 is Initial Target for FIB Level for Futures Trading, September 24th 2010

I got two “false” sell signals before this last one….I think the fact that we went through the first FIB level gives this short swing trade higher chances of being correct with initial target of 617.10.

Since NONE of us have a crystal ball, one always has to calculate the proper stop or risk allocated for the trade and see if it makes sense based on ones account size, risk tolerance etc.

For this specific one, I would conclude that my short trade is wrong if we trade above 660.

SP 500 Day Trading
SP 500 Day Trading

Continue reading “617.10 is Initial Target for FIB Level for Futures Trading, September 24th 2010”

Watch for Price Action the Day After FOMC, September 22nd 2010

FOMC is behind us. Mixed reaction from the market and many times the real direction will show the next day, so tomorrows price action is important to watch. My indicators suggest that as long as we can hold the 1115 level, we still have a shot at more upside move. However a break below 1115 on mini SP along with continued upside in bond market may suggest temporary top. Time and price will tell.

Continue reading “Watch for Price Action the Day After FOMC, September 22nd 2010”