CME Raises Margins on Stock Indices 2.08.2018

____________________________________________________________________

Voted #1 Blog and #1 Brokerage Services on  TraderPlanet   for 2016!!

____________________________________________________________________

With the recent volatility the CME have raised some of the overnight margins for stock index futures.

Most of our clients enjoy $500 daytrading margins for the contracts below, depending on the platform and in rare cases market conditions. Few of the trading platforms will use % of overnight margins and/or  if you plan on holding positions more than intraday than note below:

ES was $5,555 –> now $6,105

NQ, $5,720 –> $6,380

YM, $4,620 –> $5,280

RTY, $3,245 –> $3,630

NKD, $4,565 –> $5,280

BE CAREFUL!! THESE ARE NOT “REGULAR OR NORMAL TIMES”

Plan your trade, trade your plan and ALWAYS try to asses the risk/ reward ratio you are about to trade.

Continue reading “CME Raises Margins on Stock Indices 2.08.2018”

Bitcoin First Day, USDA Report Tomorrow, March is the Front Month for Stock Indices! 12.12.2017

____________________________________________________________________

Voted #1 Blog and #1 Brokerage Services on TraderPlanet for 2016!!  

____________________________________________________________________

Dear Traders,

March is now the FRONT MONTH for all e-mini contracts. March is H8

so YMH8 is the March mini Dow futures

Market Movers: December 12 Crop Report

  • By CME Group
  • Topics: Agriculture

Industry experts Dave Hightower, of The Hightower Report, and Virginia McGathey, President of McGathey Commodities, preview the December 12 USDA report discussing corn and soybean yields in advance of its publication.

Watch the Video!

Bitcoin updates:

The CBOE 1 bitcoin contract launched last night in what I consider a relatively successful first day. The CBOE contract controls one bitcoin while the CME contract set to launch this coming Sunday evening controls 5 bitcoins.

We saw approx. 4000 contracts traded on the January contract of the CBOE with a high of 18850 and a low of 15,000 ( where the market opened…) The contract is very volatile and the bid-ask spread is still wide.

Continue reading “Bitcoin First Day, USDA Report Tomorrow, March is the Front Month for Stock Indices! 12.12.2017”

Big Dip in the Stock Indices 11.13.2015

Connect with Us! Use Our Futures Trading Levels and Economic Reports RSS Feed.

Like us on FacebookFollow us on TwitterView our profile on LinkedInFind us on Google+Cannon Trading Futures Trading Resistance & Support Levels and Economic ReportsFind us on Yelp

1. Market Commentary
2. Futures Support and Resistance Levels – S&P, Nasdaq, Dow Jones, Russell 2000, Dollar Index
3. Commodities Support and Resistance Levels – Gold, Euro, Crude Oil, T-Bonds
4. Commodities Support and Resistance Levels – Corn, Wheat, Beans, Silver
5. Futures Economic Reports for Friday November 13, 2015

Hello Traders,

For 2015 I would like to wish all of you discipline and patience in your trading!

Big drop today on stock indices, almost 2% on the Russell 2000.

To have a look at bigger picture I am sharing my weekly mini Dow chart.

PS: Friday the 13th is tomorrow……

756930fb f60b 4949 ac0a e68a8db8f62b

Futures Stock Index Charts, Mini S&P and Mini Russell 2000 Charts

Connect with Us! Use Our Futures Trading Levels and Economic Reports RSS Feed.

Like us on FacebookFollow us on TwitterView our profile on LinkedInFind us on Google+Cannon Trading Futures Trading Resistance & Support Levels and Economic ReportsFind us on Yelp

1. Market Commentary
2. Futures Support and Resistance Levels – S&P, Nasdaq, Dow Jones, Russell 2000, Dollar Index
3. Commodities Support and Resistance Levels – Gold, Euro, Crude Oil, T-Bonds
4. Commodities Support and Resistance Levels – Corn, Wheat, Beans, Silver
5. Futures Economic Reports for Wednesday May 14, 2014

Hello Traders,

For 2014 I would like to wish all of you discipline and patience in your trading!


Quick Tip:


I want to share something I have noticed if you are a stock index future trader.


As of lately I noticed that the Russell 2000 is acting as a “leading indicator”, i.e. the Russell will be the leader in up or down moves and may provide clues if you are trading the mini SP 500, NASDAQ, Dow etc.


Of course this is just an observation/ theory and I did NOT back test it or did in depth research but I think it is worth watching/ paying attention to for a few days before you start incorporating it (if at all) into your trading decisions.


30 second charts of both the mini Russell 2000 and the mini SP 500 for your review below, in this example you can see the mini Russell starting to make a move lower about 90 seconds before the mini SP 500 joined. Again, do NOT take this as a trading advice, as I honestly don’t think you can only make decisions based on that but it is worth further homework to see if one can incorporate it into their trading arsenal.
813


If you like the information we share? We would appreciate your positive reviews on our new yelp!! Continue reading “Futures Stock Index Charts, Mini S&P and Mini Russell 2000 Charts”

Futures Trading Levels and Economic Reports for October 22, 2013

Connect with Us! Use Our Futures Trading Levels and Economic Reports RSS Feed.

Like us on FacebookFollow us on TwitterView our profile on LinkedInFind us on Google+Cannon Trading Futures Trading Resistance & Support Levels and Economic ReportsFind us on Yelp

1. Market Commentary
2. Futures Support and Resistance Levels – S&P, Nasdaq, Dow Jones, Russell 2000, Dollar Index
3. Commodities Support and Resistance Levels – Gold, Euro, Crude Oil, T-Bonds
4. Commodities Support and Resistance Levels – Corn, Wheat, Beans, Silver
5. Futures Economic Reports for Tuesday October 22, 2013

Hello Traders,

For 2013 I would like to wish all of you discipline and patience in your trading! 

Make sure you are aware of the revised economic reports schedule, example: tomorrow we will have monthly unemployment figures for Sept. since this report was not released when it was suppose to because of the shut down. As far price forecast, tough to tell. Market been going up more than a few days in a row and is due for pullback, the questions is: when and how much higher can it go before pulls back…..

Revised release schedule for US economic data delayed by govt shutdown

Fri, 18 Oct 2013 12:57 PM ESTMonday 10/21:
EIA Weekly Petroleum Inventories (postponed from prev week)Tuesday 10/22:
Employment Report
 – Change in Non-Farm Payrolls/Two-Month Payroll Net Revision/Unemployment Rate; Change in Household Employment/Average Hourly Earnings; Average Weekly Hours/Underemployment Rate/Labor Force Participation Rate (Sept)
EIA Weekly Natural Gas Inventories (postponed from prev week)Wednesday 10/23:
U.S. Import and Export Price Indexes (Sept)
EIA Weekly Petroleum InventoriesThursday 10/24:
Job Openings & Labor Turnover Survey (Aug)
EIA Weekly Natural Gas Inventories

Tuesday 10/29:
PPI; PPI Ex-Food/Energy (Sept)

Wednesday 10/30:
CPI; CPI Ex-Food and Energy; CPI Core Index (Sept)
Real Earnings (Oct)

Friday 11/8:
Employment Report (Oct)
WASDE

Tuesday 11/19:
Employment Cost Index (Q3)

**Thus far it appears all data will be released at their normal posting time.

Continue reading “Futures Trading Levels and Economic Reports for October 22, 2013”

Futures Trading Levels and Economic Reports for October 09, 2013

Connect with Us! Use Our Futures Trading Levels and Economic Reports RSS Feed.

Like us on FacebookFollow us on TwitterView our profile on LinkedInFind us on Google+Cannon Trading Futures Trading Resistance & Support Levels and Economic ReportsFind us on Yelp

1. Market Commentary
2. Futures Support and Resistance Levels – S&P, Nasdaq, Dow Jones, Russell 2000, Dollar Index
3. Commodities Support and Resistance Levels – Gold, Euro, Crude Oil, T-Bonds
4. Commodities Support and Resistance Levels – Corn, Wheat, Beans, Silver
5. Futures Economic Reports for Wednesday October 09, 2013

Hello Traders,

For 2013 I would like to wish all of you discipline and patience in your trading! 

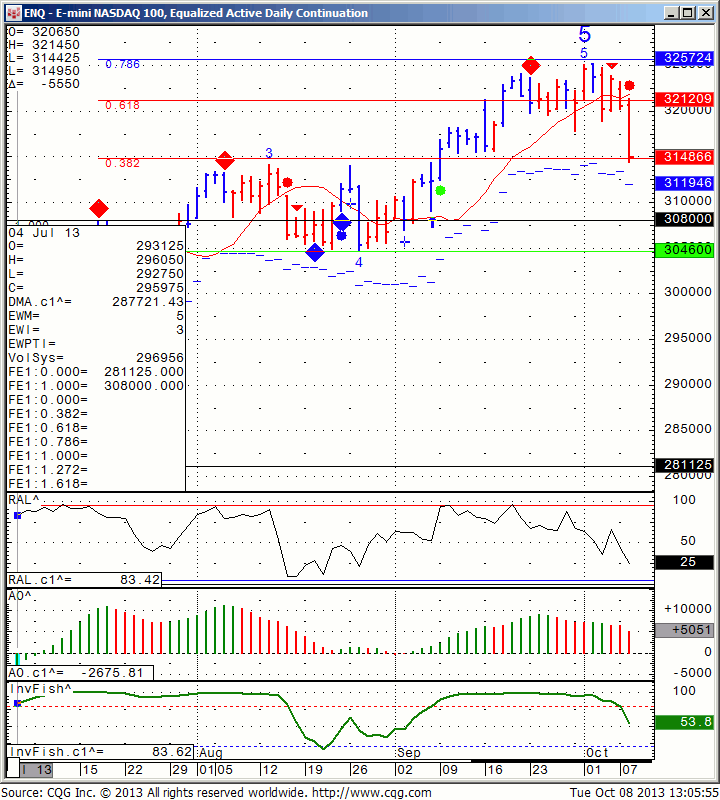
Stock indices broke down over last few days as Govt. shut down is in affect. One never knows what type of reaction we will get once the shut down is over or when this will be.

ENQ - E-Mini S&P 500, Equalized Active Daily Continuation
ENQ – E-Mini S&P 500, Equalized Active Daily Continuation

Continue reading “Futures Trading Levels and Economic Reports for October 09, 2013”