Vote for our Blog! 11.22.2016

Connect with Us! Use Our Futures Trading Levels and Economic Reports RSS Feed.

Like us on FacebookFollow us on TwitterView our profile on LinkedInFind us on Google+Cannon Trading Futures Trading Resistance & Support Levels and Economic ReportsFind us on Yelp

1. Market Commentary
2. Futures Support and Resistance Levels – S&P, Nasdaq, Dow Jones, Russell 2000, Dollar Index
3. Commodities Support and Resistance Levels – Gold, Euro, Crude Oil, T-Bonds
4. Commodities Support and Resistance Levels – Corn, Wheat, Beans, Silver
5. Futures Economic Reports for Tuesday November 22, 2016

Greetings!

Dear Traders,

If you enjoy our blog and the information we share, please vote for us as #1 under the “Blog Section” and provide us with the strength and energy to continue and providing you with the best tips and information on this blog!!

Vote here

On a different note, please review Thanksgiving holiday trading schedule:

Thanksgiving Holiday Trading Schedule

Continue reading “Vote for our Blog! 11.22.2016”

Using Range Bar and Volume Charts for Scalping 7-20-2016

Connect with Us! Use Our Futures Trading Levels and Economic Reports RSS Feed.

Like us on FacebookFollow us on TwitterView our profile on LinkedInFind us on Google+Cannon Trading Futures Trading Resistance & Support Levels and Economic ReportsFind us on Yelp

1. Market Commentary
2. Futures Support and Resistance Levels – S&P, Nasdaq, Dow Jones, Russell 2000, Dollar Index
3. Commodities Support and Resistance Levels – Gold, Euro, Crude Oil, T-Bonds
4. Commodities Support and Resistance Levels – Corn, Wheat, Beans, Silver
5. Futures Economic Reports for Wedneday July 20, 2016

Hello Traders,

Why I Like to Use Tick and Volume Charts for Scalping

Today, I decided to touch more on an educational feature rather than provide a certain market outlook.

Many of my clients and blog readers know that when it comes to short-term trading I am a fan of using volume charts, tick charts, range bar charts and Renko charts rather than the traditional time charts like the 1 minutes, 5 minutes etc.

My rule of thumb is that if you as a trader who makes decisions based on charts that are less than 15 minutes time frame, it may be worth your time to research, back test and do some homework as to potentially using other type of charts like volume charts, Range charts etc.

Volume charts will draw a new bar once a user defined number of contracts traded. An example is the mini SP 10,000 volume chart which will draw a new bar once 10,000 contracts are traded.

Range bar charts will draw new charts once price action has exceeded a user’s pre-defined price or ticks range. An example might be an 18 ticks range bar chart on crude oil.

While volume charts rely ONLY on volume, the range bar charts rely ONLY on price action.

Their main advantage over traditional time charts is twofold in my opinion:

If the market is moving fast, reports have come out or there is heavy volume in the market, the traditional 5 minute chart will need 5 minutes to complete the next bar before it provides you with a signal…if you have day traded futures before you know what 5 minutes can do to these markets….The volume charts or range bar charts in this case will complete the bars MUCH faster because there is strong price action and strong volume and will be able to provide a signal faster than the time charts. Continue reading “Using Range Bar and Volume Charts for Scalping 7-20-2016”

SP chart +Support and resistance levels for 7.19.2016

Connect with Us! Use Our Futures Trading Levels and Economic Reports RSS Feed.

Like us on FacebookFollow us on TwitterView our profile on LinkedInFind us on Google+Cannon Trading Futures Trading Resistance & Support Levels and Economic ReportsFind us on Yelp

1. Market Commentary
2. Futures Support and Resistance Levels – S&P, Nasdaq, Dow Jones, Russell 2000, Dollar Index
3. Commodities Support and Resistance Levels – Gold, Euro, Crude Oil, T-Bonds
4. Commodities Support and Resistance Levels – Corn, Wheat, Beans, Silver
5. Futures Economic Reports for Tuesday July 19, 2016

Hello Traders,

It is Earnings season. If you are a stock index trader, make sure you know which important earnings are coming out and when.

Visit this page, scroll down to bottom to see today’s earnings:

http://www.reuters.com/finance/EarningsUS

On a different note, it feels like somewhat of “Summer Trading” – Low energy and lower “speed” in the markets. I would have expected to see much more volatility after the news from Turkey but the market for now has not paid much attention. Volume was relatively low today and the range of moves was relatively tight.

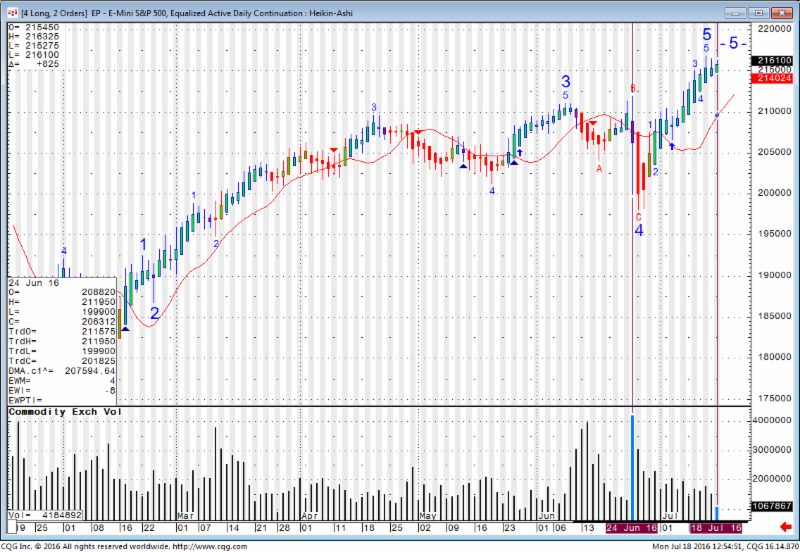
Looking at the mini SP 500 chart along with volume as markets make new highs leads me to believe it is somewhat artificial….but then again it is not wise to argue with price action  and I would rather get a signal correction is starting than trying to predict the correction.

 Mini SP 500 Chart

Continue reading “SP chart +Support and resistance levels for 7.19.2016”

Futures Levels & Economic Reports 4.01.2014

Connect with Us! Use Our Futures Trading Levels and Economic Reports RSS Feed.

Like us on FacebookFollow us on TwitterView our profile on LinkedInFind us on Google+Cannon Trading Futures Trading Resistance & Support Levels and Economic ReportsFind us on Yelp

1. Market Commentary
2. Futures Support and Resistance Levels – S&P, Nasdaq, Dow Jones, Russell 2000, Dollar Index
3. Commodities Support and Resistance Levels – Gold, Euro, Crude Oil, T-Bonds
4. Commodities Support and Resistance Levels – Corn, Wheat, Beans, Silver
5. Futures Economic Reports for Tuesday April 1, 2014

Hello Traders,

For 2014 I would like to wish all of you discipline and patience in your trading!

TradeTheNews.com Weekly Market Update: March Goes Out Like a Lamb

Fri, 28 Mar 2014 16:03 PM EST- Global markets diverged this week as investors concentrated on vertical phenomena rather than cross-market influences. In Asia, the prospect of stimulus to support Abenomics and the slowing Chinese market sent Hong Kong and Japan equities broadly higher, although Shanghai was flat. In Europe, another round of decent economic reports reinforced hopes the continent was starting to pull itself out of the hole, epitomized by France’s preliminary March PMI manufacturing data, which moved into expansion for the first time in more than two years. In the US, the S&P500 and DJIA traded sideways as traders continued to reposition after Yellen rearranged assumptions last week. The Conference Board’s March Consumer Confidence survey unexpectedly jumped to 82.3 from February’s upwardly-revised 78.3 reading, marking the highest level since January 2008. The advance durable goods report for February was mixed but on balance somewhat weaker than expected, showing the persistent impact of weather issues. Meanwhile the Nasdaq had its worst week since October 2012, dropping 2.8%, as many high-flying tech stocks saw stiff losses.- The Federal Reserve released the second component – capital plan reviews – of its Comprehensive Capital Analysis and Review (CCAR) this week. Twenty five of thirty large bank capital plans were approved. The Fed objected to capital plans from Citigroup, HSBC North America, RBS Citizens, Santander Holdings USA and Zions. Note that three of these are US branches of European banks, while Zions failed the earlier stress test. Citigroup shares took the biggest hit after the Fed rejected its request for a $6.4 billion stock buyback program and an increase of the quarterly dividend to $0.05. Bank of America and Goldman Sachs were forced to adjust their initial capital plan submissions to gain approval.- Facebook announced another big acquisition, paying $2 billion in cash and stock for virtual reality gaming technology company Oculus VR. The company’s immersive virtual reality technology headset, the Oculus Rift, has been lauded as a major breakthrough by the tech press. Facebook CEO Zuckerberg explained that he is looking ahead of Mobile to the next major computing platform interface, noting Oculus can be used as more than just platform for gaming, potentially becoming the “most social platform ever.”

– Popular “momentum stocks” cratered this week in unison. Stocks of Facebook and Twitter tracked each other through the week, with the two names down more than 12% on the week by Thursday morning, although they retook some losses into the end of the week. Netflix gave up 12% on the week. Biotechs that set off the Nasdaq tumble last Friday saw additional losses this week, with Biogen leading the way down.

IPOs showed signs of oversaturation for the second straight week. King Digital Entertainment, the designer of the highly addictive Candy Crush mobile videogame, launched its IPO on the NYSE this week, opening for trading at 10% below the IPO price. Shares lost another 10% of their value through the end of the week, as investors worried the company is a one-hit-wonder.

Continue reading “Futures Levels & Economic Reports 4.01.2014”

Futures Levels & Economic Reports 2.11.2014

Connect with Us! Use Our Futures Trading Levels and Economic Reports RSS Feed.

Like us on FacebookFollow us on TwitterView our profile on LinkedInFind us on Google+Cannon Trading Futures Trading Resistance & Support Levels and Economic ReportsFind us on Yelp

1. Market Commentary
2. Futures Support and Resistance Levels – S&P, Nasdaq, Dow Jones, Russell 2000, Dollar Index
3. Commodities Support and Resistance Levels – Gold, Euro, Crude Oil, T-Bonds
4. Commodities Support and Resistance Levels – Corn, Wheat, Beans, Silver
5. Futures Economic Reports for Tuesday February 11, 2014

Hello Traders,

For 2014 I would like to wish all of you discipline and patience in your trading!

RECAP OF LAST WEEK AND A PEAK AHEAD INTO THIS WEEKS TRADING BY TRADETHENEWS.COM

TradeTheNews.com Weekly Market Update: The Correction Corrects

Fri, 07 Feb 2014 16:09 PM EST- The week began with a massive sell-off, as the DJIA and S&P500 fell more than 2% a piece on Monday and closed at their lows, while the DJIA also fell below its 200-day moving average for the first time since October. The declines came after a bad slide on the prior Friday and were exacerbated by another discouraging Chinese PMI reading. On Tuesday, the Nikkei saw a 4% slump, but global markets bottomed out mid-week and then recouped all of their losses. In Europe, healthy-looking PMI data helped limit losses, while the mixed US jobs report did not damage the bounce-back on Friday. Emerging market currencies stabilized this week following the recent round of rate hikes. For the week, the DJIA rose 0.6%, the S&P500 gained 0.8% and the Nasdaq added 0.5%.- The January US non-farm payrolls figure widely missed expectations and the December figure was revised higher by a mere 1K, making for the weakest two-month period of job growth in three years. However, investors are looking past this to find some pretty good news in the numbers. The lack of upward revisions in December data was still blamed on harsh weather, and the November payroll gains were revised higher again to 274K from 241K. More significantly, unemployment rate fell again to 6.6% while the labor force participation rate edged up to 63%, and employment measured by the household survey increased by 616K, complemented by a huge decline in part-time employment.

– Janet Yellen was officially sworn in as the new Fed chairman this week. Nearly everyone expects a pretty smooth transition, with Yellen very unlikely to make any changes to the course charted by helicopter Ben. She will have to deal with policy contradictions now that unemployment is nearly at the Fed’s 6.5% threshold while job growth remains anemic. At the December meeting, the Fed extended its forward guidance by stressing that low rates will likely remain appropriate “well past” reaching the 6.5% threshold, however market rates are still creeping higher. Next week will see Yellen’s first big policy statement, during Congressional testimony on the economic outlook and monetary policy. Several Fed officials this week, both hawks and doves, affirmed that tapering was still on track and that it would take a significant change in the data to force them the reconsider it.

– Despite the week-long Lunar New Year holiday on the mainland, China released the official PMI figures for the month of January on Monday. Much like the disappointing HSBC final PMI readings, the government figures described more deterioration with manufacturing PMI falling to 50.5, a six-month low, and non-manufacturing falling to 53.4, a 23-month low. Perhaps most notable among components, the employment reading in the manufacturing sector fell to an 11-month low. Meanwhile, the China Commence Ministry reported 2014 Lunar New Year “golden week” retail sales that were up a mere +13.3% y/y, the slowest pace of growth on record for the key holiday retail period.

– Shares of Twitter were down as much as 24% on Wednesday after the firm released its first quarterly report as a publically traded company. Twitter’s headline EPS and revenue numbers were much better than expected, but traders and analysts insist that slowing user growth and weaker engagement trends seen in metrics bode ill for the firm. In addition, the first round of lock-up expirations arrives on February 15th, followed by another round on May 7th. Cult tech names Pandora and LinkedIn saw losses as well in the wake of problematic quarterly results. Both firms disclosed decent fourth-quarter results but offered guidance that widely missed consensus estimates.

– Time Warner reported strong fourth-quarter results. Analysts focused on the company’s decision to break out separate HBO revenue figures for the first time. HBO took in $1.26B compared to $1.19B y/y, citing the consolidation of Asia and certain European operations for the 4% gain. This compares to Netflix’s $1.18B in revenue in the quarter.

– On Thursday, Apple disclosed that it has repurchased $14B in common stock over the last two weeks, amounting to 3.1% of its market cap. Over the last 12 months, the company said it has bought back $40B in stock, an all-time record for Apple or any company. CEO Cook said that the company had been surprised by the 8% decline on Jan 28th that came after reporting quarterly results. He also pledged to return $100B to shareholders by the end of 2015.

Continue reading “Futures Levels & Economic Reports 2.11.2014”

STAR AWARDS – Trading Levels & Economic Reports for 12.03.2013

Connect with Us! Use Our Futures Trading Levels and Economic Reports RSS Feed.

Like us on FacebookFollow us on TwitterView our profile on LinkedInFind us on Google+Cannon Trading Futures Trading Resistance & Support Levels and Economic ReportsFind us on Yelp

1. Market Commentary
2. Futures Support and Resistance Levels – S&P, Nasdaq, Dow Jones, Russell 2000, Dollar Index
3. Commodities Support and Resistance Levels – Gold, Euro, Crude Oil, T-Bonds
4. Commodities Support and Resistance Levels – Corn, Wheat, Beans, Silver
5. Futures Economic Reports for Tuesday December 3, 2013

Hello Traders,

For 2013 I would like to wish all of you discipline and patience in your trading! 

I was informed Friday that our blog is being nominated for the STAR award by traderplanet.com which is very nice to hear and know that the work and amount of time we put into it is not going unnoticed!

I have gotten and getting great feedback from many of you and would appreciate if you can take a couple of seconds to vote at:

http://www.traderplanet.com/l/WEd

Trader Planet Award

Continue reading “STAR AWARDS – Trading Levels & Economic Reports for 12.03.2013”

Futures Trading Levels & Economic Reports for 11.29.2013

Connect with Us! Use Our Futures Trading Levels and Economic Reports RSS Feed.

Like us on FacebookFollow us on TwitterView our profile on LinkedInFind us on Google+Cannon Trading Futures Trading Resistance & Support Levels and Economic ReportsFind us on Yelp

1. Market Commentary
2. Futures Support and Resistance Levels – S&P, Nasdaq, Dow Jones, Russell 2000, Dollar Index
3. Commodities Support and Resistance Levels – Gold, Euro, Crude Oil, T-Bonds
4. Commodities Support and Resistance Levels – Corn, Wheat, Beans, Silver
5. Futures Economic Reports for Friday November 29, 2013

Hello Traders,

For 2013 I would like to wish all of you discipline and patience in your trading! 

There will not be any market commentary this week. Have a great Thanksgiving Holiday. Thank you!

If you like the information we share? We would appreciate your positive reviews on our new yelp!!

GOOD TRADING

Trading Futures, Options on Futures, and retail off-exchange foreign currency transactions involves substantial risk of loss and is not suitable for all investors. You should carefully consider whether trading is suitable for you in light of your circumstances, knowledge, and financial resources. You may lose all or more of your initial investment. Opinions, market data, and recommendations are subject to change at any time.

Continue reading “Futures Trading Levels & Economic Reports for 11.29.2013”