AT A GLANCE: FOMC Takes No Action; Still Sees ‘Significant Risks’ | Support and Resistance Levels

Jump to a section in this post:
1. Market Commentary
2. Support and Resistance Levels – S&P, Nasdaq, Dow Jones, Russell 2000
3. Support and Resistance Levels – Gold, Euro, Crude Oil, T-Bonds
4. Support and Resistance Levels – March Corn, March Wheat, Jan Beans, March Silver
5. Economic Reports for Monday, December 12, 2011


divider black 190

1. Market Commentary and Daily Mini S&P 500 Chart

Front month for equity indices is MARCH 2012

mini SP, mini Nasdaq, mini Russell, Mini Dow and few more are all March 2012

Symbol in most platforms for March mini SP is ESH2. Pay attention please!

AT A GLANCE: FOMC Takes No Action; Still Sees ‘Significant Risks’

12/13/11 13:45
THE STORY
The Federal Open Market Committee, the policy-setting arm of the Federal Reserve Board, left its policy options open for 2012 but took no actions Tuesday and offered an assessment of the economy that was guardedly more upbeat, but still marked by “significant downside risks.”
Nine out of 10 Fed officials voted to keep the central bank’s easy-credit policies unchanged for the second meeting in a row in what was the last Federal Open Market Committee meeting of the year. It took place on Fed Chairman Ben Bernanke’s 58th birthday.
Officials reiterated that short-term interest rates are likely to stay close to zero until mid-2013 at least. In their assessment of the economy, they said indicators pointed to some improvement in the U.S. jobs market.
Data since the FOMC last met at the sta! rt of November suggest the “economy has been expanding moderately, notwithstanding some apparent slowing in global growth,” Fed officials said in a statement.
The U.S. unemployment rate fell to 8.6% in November, the lowest level since March 2009, and the number of people filing for unemployment benefits has fallen recently.
Still, the Fed is concerned the U.S. economy could be hit by higher taxes and continued government layoffs next year, as well as the repercussions from the debt crisis in Europe, which has close financial and trade ties with the U.S.
The Fed is looking at revamping its communication strategy, which could be a step toward easier monetary policy. Officials are considering whether to make their internal interest-rate forecasts public. If they do this, and those forecasts suggest short-term interest rates will stay low for even longer than investors now believe, that could drive long-term rates down and be a boost to growth.
The post-! meeting statement gave no indication of the state of that debate. This suggests the Fed has left it to be resolved next year. Minutes of the meeting, due out in three weeks, might reveal more.
Prior to the meeting, few analysts expected the policymakers to introduce any new stimulus measures since its latest stimulus plan–known as Operation Twist–was disclosed less than three months ago. Under Operation Twist, the Fed will exchange $400 billion of its short-term Treasury securities for longer-dated ones.
In December, the central bank aims to purchase $45 billion worth of U.S. government debt through 13 operations and sell $52 billion via seven sales. An extra auction of about $8 billion was added this month because of a canceled sale on Nov. 30.
Operation Twist will keep the Fed’s balance sheet size steady. By purchasing longer-term Treasurys, the Fed hopes to push long-term borrowing costs lower for consumers and businesses to facilitate the economic recovery. Continue reading “AT A GLANCE: FOMC Takes No Action; Still Sees ‘Significant Risks’ | Support and Resistance Levels”

Daily Chart of the March Mini SP 500 and Support and Resistance Levels

Jump to a section in this post:
1. Market Commentary
2. Support and Resistance Levels – S&P, Nasdaq, Dow Jones, Russell 2000
3. Support and Resistance Levels – Gold, Euro, Crude Oil, T-Bonds
4. Support and Resistance Levels – March Corn, March Wheat, Jan Beans, March Silver
5. Economic Reports for Monday, December 12, 2011


divider black 190

1. Market Commentary and Daily Mini S&P 500 Chart

Front month for equity indices is MARCH 2012

mini SP, mini Nasdaq, mini Russell, Mini Dow and few more are all March 2012

Symbol in most platforms for March mini SP is ESH2. Pay attention please!

One day FOMC meeting tomorrow. Statement will be released around 2:15 PM EST

FOMC days have different characteristics than other trading days. If you have traded for a while, check your trading notes from past FOMC days that may help you prepare for tomorrow.

if you are a newcomer, take a more conservative approach and make sure you understand that the news can really move the market.

My observations suggest choppy, low volume up until announcement, followed by some some sharp volatile moves right during and after the announcement. However, with tomorrow early morning reports and recent volatility, we may see wild action through out.

One advice everyone can benefit from is, reduce your trading size in proportion to the increase in volatility. This should help your comfort level while in the day-trade.

Daily chart of March Mini SP 500 for your review below. Break below 1217 can trigger additional move down, break above 1255 can trigger additional move upside:

450 Continue reading “Daily Chart of the March Mini SP 500 and Support and Resistance Levels”

Rollover Notice and Support and Resistance Levels

Jump to a section in this post:
1. Market Commentary
2. Support and Resistance Levels – S&P, Nasdaq, Dow Jones, Russell 2000
3. Support and Resistance Levels – Gold, Euro, Crude Oil, T-Bonds
4. Economic Reports for Friday, December 9, 2011


divider black 190

1. Market Commentary

Please note that Equity Indices products; TF, ES, NQ, EMD and YM roll on Thursday the 8th at 8:30 am Chicago time from the December 2011 contract to the March 2012 contract. The month code for March is ‘H’.
It is recommended that all new positions be placed in the March contract as of Thursday’s trade date.
Please close any open December Currencies positions by the close on Friday, December 16th.
Should you have any further questions please contact your futures broker.

Since we are now trading MARCH contracts for all stock indices, daily chart of MARCH MINI SP 500 for your review below along with a potential SWING trade going short.

443

2. Support and Resistance Levels – S&P, Nasdaq, Dow Jones, Russell 2000

Contract (Dec. 2011) SP500
(big & Mini)
Nasdaq100
(big & Mini)
Dow Jones
(big & Mini)
Mini Russell
Resistance Level 3 1275.83 2357.33 12298 777.23
Resistance Level 2 1265.62 2340.17 12231 765.27
Resistance Level 1 1250.93 2311.33 12109 744.53
Pivot Point 1240.72 2294.17 12042 732.57
Support Level 1 1226.03 2265.33 11920 711.83
Support Level 2 1215.82 2248.17 11853 699.87
Support Level 3 1201.13 2219.33 11731 679.13


3. Support & Resistance Levels for Gold, Euro, Crude Oil, and U.S. T-Bonds


Contract Feb. Gold Dec. Euro Jan. Crude Oil March. Bonds
Resistance Level 3 1798.6 1.3617 104.59 145 20/32
Resistance Level 2 1779.5 1.3539 103.16 144  5/32
Resistance Level 1 1745.9 1.3444 100.57 143 13/32
Pivot Point 1726.8 1.3366 99.14 141 30/32
Support Level 1 1693.2 1.3271 96.55 141  6/32
Support Level 2 1674.1 1.3193 95.12 139 23/32
Support Level 3 1640.5 1.3098 92.53 138 31/32


divider black 190

5. Economic Reports

German Final CPI
2:00am

German Trade Balance
2:00am

German WPI
9th – 13th

French Industrial Production
2:45am

French Government Budget Balance
2:45am

EU Economic Summit
All Day

Trade Balance
8:30am

Prelim UoM Consumer Sentiment
9:55am

Prelim UoM Inflation Expectations
9:55am

Thursday Morning Support and Resistance Levels

Here’s a morning cup o’ joe for all you futures traders, our morning support and resistance levels. Good trading!

divider black 190

Support and Resistance Levels – S&P 500, Nasdaq 100, Dow Jones, Mini Russell 2000, 30-Year US Bond, 10-Year US Note

Contract (Dec. 2011) Mini S&P 500 Mini Nasdaq 100 Dow Jones Mini Russell 2000 30-Year US Bond 10-Year US Note
Resistance Level 3

——————————————

Resistance Level 2

——————————————

Resistance Level 1

——————————————

Support Level 1

——————————————

Support Level 2

——————————————

Support Level 3

1289.25

1275.25


1266.25


1235


1218.5


1204

2400

2375


2340


2288


2261


2237

12333

12280


12226


12101


12024


11900

768.4

755.5


749.5


729.4


718.8


709.30

14219

14202


14116


14014


13924


13903

13022.5

13009


13001


12910.5


12905


12820

Continue reading “Thursday Morning Support and Resistance Levels”

Wednesday Morning Support and Resistance Levels

Here’s a morning cup o’ joe for all you futures traders, our morning support and resistance levels. Good trading!

divider black 190

Support and Resistance Levels – S&P 500, Nasdaq 100, Dow Jones, Mini Russell 2000, 30-Year US Bond, 10-Year US Note

Contract (Dec. 2011) Mini S&P 500 Mini Nasdaq 100 Dow Jones Mini Russell 2000 30-Year US Bond 10-Year US Note

Resistance Level 3

——————————————

Resistance Level 2

——————————————

Resistance Level 1

——————————————

Support Level 1

——————————————

Support Level 2

——————————————

Support Level 3

1289.25 

1275.25


1266.25


1236.5


1221


1207

2400 

2375


2345


2292.5


2265


2241

12333 

12280


12244


12069


11965


11817

768.4 

755.5


752.9


730.1


718


707.2

14219 

14202


14116


14028


14018


13924

13009 

12930.5


12925


12903.5


12820


12813.5

Continue reading “Wednesday Morning Support and Resistance Levels”

Tuesday Morning Support and Resistance Levels

Here’s a morning cup o’ joe for all you futures traders, our morning support and resistance levels. Good trading!

divider black 190

Support and Resistance Levels – S&P 500, Nasdaq 100, Dow Jones, Mini Russell 2000, 30-Year US Bond, 10-Year US Note

Contract (Dec. 2011) Mini S&P 500 Mini Nasdaq 100 Dow Jones Mini Russell 2000 30-Year US Bond 10-Year US Note

Resistance Level 3

——————————————

Resistance Level 2

——————————————

Resistance Level 1

——————————————

Support Level 1

——————————————

Support Level 2

——————————————

Support Level 3

1289.25 

1275.25


1266.25


1236.5


1221


1207

2400 

2375


2345


2292.5


2265


2241

12228 

12203


12183


11916


11777


11654

768.4 

755.5


752.9


730.1


718


707.20

14219 

14202


14116


14030


14021


13924

13009 

12930.5


12925


12903.5


12820


12813.5

Continue reading “Tuesday Morning Support and Resistance Levels”

Weekly Chart of the mini SP500. | Support and Resistance Levels


Jump to a section in this post:
1. Market Commentary
2. Support and Resistance Levels – S&P, Nasdaq, Dow Jones, Russell 2000
3. Support and Resistance Levels – Gold, Euro, Crude Oil, T-Bonds
4. Economic Reports for Tuesday, December 6, 2011


divider black 190


1. Market Commentary

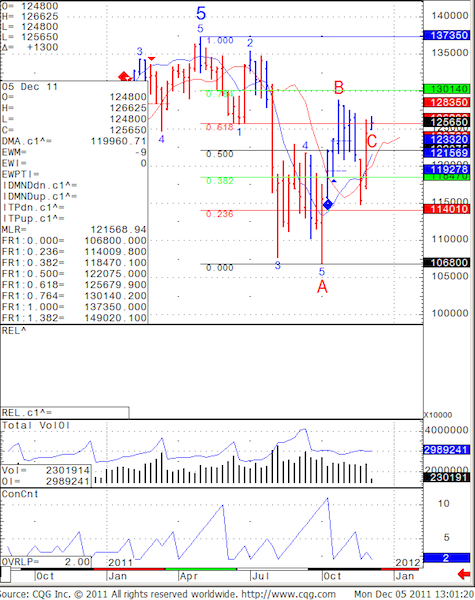
WEEKLY chart for your review below of the mini SP500.

Note that the level we closed today, around the 1257 area is an important level.

I currently have mixed views of the market when it comes to longer term time frames, hence I am not taking any trades other than day-trades.

Sometimes, as many of you know, the hardest part in trading is to be patient but once you conquer the impulse to trade simply because “you did not have any trades recently” or you feel like “you are not doing your job if you are not in a trade” – when that happens, I believe your winning percentage will increase.

440 Continue reading “Weekly Chart of the mini SP500. | Support and Resistance Levels”

TheTradeNews.com December 2011/January 2012 Outlook | Support and Resistance Levels

Jump to a section in this post:
1. Market Commentary
2. Support and Resistance Levels – S&P, Nasdaq, Dow Jones, Russell 2000
3. Support and Resistance Levels – Gold, Euro, Crude Oil, T-Bonds
4. Support and Resistance Levels – Corn, Wheat, Beans and Silver
5. Economic Reports for Monday, December 5, 2011


divider black 190


1. Market Commentary – TheTradeNews.com December 2011/January 2012 Outlook

Act Now! Don’t Delay!

The past year has been characterized by a series of false starts that ended in successive failures to restore confidence in the economy and markets. The shaky global economy, battered by the 2008 financial swoon, kept trying to get up off the mat only to be clobbered again by prevaricating politicians who failed to lead us out of crisis and by a series of once-in-a-generation events, which never allowed markets to gain any traction. The Japan earthquake, the Arab Spring, the debt ceiling debacle in Washington, and round two of the Greek crisis cut short nascent rallies in confidence. The equal and opposite reaction has been a mounting pile of uncertainty, growing as fast as the debt levels in troubled economies.
The failure to restore confidence has led to subpar growth in the G7 which is starting to erode the Asian economic boom as well. Economists have trimmed growth expectations for this year and next, with many now predicting Europe is bound for recession, which could in turn drag the US into a double dip, and dent China which relies on Europe as its biggest export market.
In the face of these dark clouds gathering, political leaders are failing to act boldly on a global scale. Washington remains at loggerheads over the most meager deficit reduction plans, Beijing has only started to realize it may need to brace for a hard economic landing, and Brussels keeps putting off its day of reckoning by agreeing to “plans for a plan.” Central banks have papered over some of the politicians’ mistakes, but can only do so much. The global economy will continue to suffer and may even spiral lower if political leaders continue to kick the can down the road and don’t rally at this perilous moment to enact forceful strategies to restore confidence.
You can access the full article HERE Continue reading “TheTradeNews.com December 2011/January 2012 Outlook | Support and Resistance Levels”

Thursday Morning Support and Resistance Levels

Here’s a morning cup o’ joe for all you futures traders, our morning support and resistance levels. Good trading!

divider black 190

Support and Resistance Levels – S&P 500, Nasdaq 100, Dow Jones, Mini Russell 2000, 30-Year US Bond, 10-Year US Note

Contract (Dec. 2011) Mini S&P 500 Mini Nasdaq 100 Dow Jones Mini Russell 2000 30-Year US Bond 10-Year US Note

Resistance Level 3

——————————————

Resistance Level 2

——————————————

Resistance Level 1

——————————————

Support Level 1

——————————————

Support Level 2

——————————————

Support Level 3

1275.25 

1258.75


1249.5


1224


1210.5


1198.5

2375 

2333


2306


2263


2241


2221

12228 

12203


12069


11833


11709


11598

768.4 

755.3


740.70


720.9


710.5


701.10

14224 

14203


14112


14001


13903


13505

12930.5 

12924


12917.5


12824


12813.5


12729

Continue reading “Thursday Morning Support and Resistance Levels”