Natural Gas Futures Review and Chart & Support and Resistance Levels 11.17.2021

Dear Futures Trader,

Get Real Time updates and more on our private FB group!
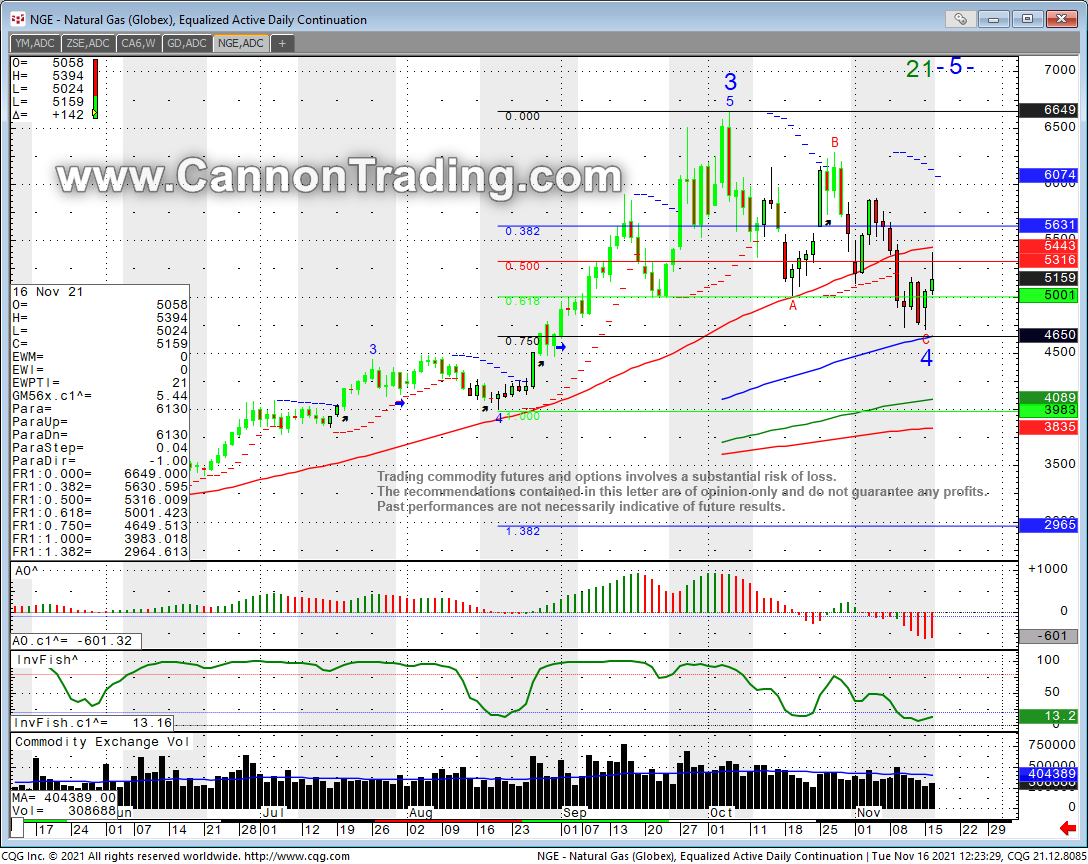
The natural gas market has seen volatility increase sharply over the past 8 weeks. Once it broke above 4.65 in early September, the market ventured into new territory with heightened volatility.
Supply crunch across the globe along with the seasonality of entering winter contributed to the rally and the pull back.
Notice how the front, Dec. contract bounced sharply off the major support/demand area at 4.70 and is now trading against the major supply area ( red line / moving average) at 5.44.
This market can go either way and do it relatively fast. Weather, supply chain news will determine next move.
A close above 5.44 can trigger retest of $6. Failure at the same level can send market towards the 4.65.
If you are looking for other reference material please contact your Cannon Broker for lists of solid, informative and helpful trading tomes
Futures Natural Gas Daily Chart

Good Trading

Trading Futures, Options on Futures, and retail off-exchange foreign currency transactions involves substantial risk of loss and is not suitable for all investors.  You should carefully consider whether trading is suitable for you in light of your circumstances, knowledge, and financial resources. You may lose all or more of your initial investment. Opinions, market data, and recommendations are subject to change at any time when it comes to Futures Trading.


Futures Trading Levels

11-17-2021
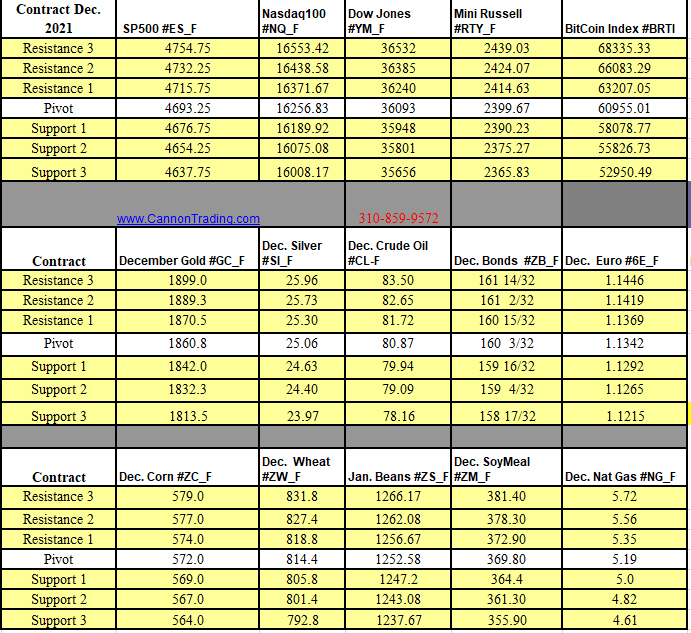
Support and Resistance Levels 11.17.2021


Economic Reports, source: 

https://bettertrader.co/ 

Better Trader Economic Reports 11.17.2021

This is not a solicitation of any order to buy or sell, but a current market view provided by Cannon Trading Inc. Any statement of facts here in contained are derived from sources believed to be reliable, but are not guaranteed as to accuracy, nor they purport to be complete. No responsibility is assumed with respect to any such statement or with respect to any expression of opinion herein contained. Readers are urged to exercise their own judgement in trading.
Unleaded Gasoline Chart for Review 7.14.2017

____________________________________________________________

Voted #1 Blog and #1 Brokerage Services on TraderPlanet for 2016!! 

_____________________________________________________________

The following information published by the CME is quite interesting and may offer some longer term insight for those who are not too lazy to explore…..

https://www.cmegroup.com/education/monthly-options-review/june-options-review.html

On a different note:

Unleaded Gasoline is at decision point between the longer term downtrend and the shorter term bounce. Daily chart for your review below:

Continue reading “Unleaded Gasoline Chart for Review 7.14.2017”