This bull market has a story behind it.
11 November 2024
By GalTrades.com
This bull market has a story behind it.
- SPX rose 22.44 points (0.38%) to 5,995.54 to end the week up 4.66%; posted its best weekly gain of the year.
- Dow Jones Industrial Average® ($DJI) added 259.65 points (0.59%) to 43,988.99 to end the week up 4.61%
- Nasdaq Composite®($COMP) climbed 17.31 points (0.09%) to 19,286.78 to end the week up 5.74%.
- 10-year Treasury note yield (TNX) fell four basis points to 4.31%, but the 2-year yield added three basis points to 4.25%. Shorter-term yields, which are more closely connected to near-term rate policy, gained on longer-term ones this week.
- Cboe Volatility Index® (VIX) fell to 14.99, near a two-month low.
The S&P500 is above 6,000 at the time of this writing, as the rally to record highs continued. Interestingly, the yield on the 10-Year Treasury is pacing to finish the week lower despite a huge swing higher in reaction to the election outcome. Donald Trump’s victory has caused bank and industrial stocks to surge on the expectations of less regulation and a pro-business environment. Technology stocks are a notable underperformer Friday, with all the Magnificent 7 in the red except for Tesla.
Did anyone predict the market will up so much with a trump victory? I was following lots of analyst and portfolio managers in order to understand what to expect from the markets with a Trump or Kamala victory. And no one predicted the markets will go up as much as they did with a Trump win. In fact, there were lots of predictions the markets will sell off after the elections.
So now what? From what I read it was institutional money that drove the markets up and not retail investors. And that should be a positive for the markets. From a near-term perspective, new all-time highs are bullish, and we haven’t yet seen any evidence that the post-election rally is exhausted. The bearish view would likely cite a near-term overbought technical status and a valuation that has become even more stretched. I do feel the markets are stretched and it’s always healthy to have a pull back, parabolic moves tend to have a rubber band effect. Trade with caution. On top of the Trump rally, we got a ¼ point rate cut from the FED; which finally sent bond yields down a bit. Keep a close eye on the 10 year this week and going fwd. Respect the uptrend, that’s what I keep hearing.
We remove the risk of higher corporate tax under Trump or higher regulations, but Valuations for the S&P is at 22.5, that’s a bit stretched. And earnings estimates have been getting trimmed the last few months.
So, if we’re overbought, what can be a catalyst that will trigger some kind of cool off? The CPI/PPI reports this week have the potential to create a “profit taking” excuse, regardless of the data, given the recent rally. It may Jostle the trend for the short term.
Usually when the dollar rallies it’s not a positive for equity markets.
Financial ETF XLF slated for best day in two years
Bank shares got a boost with JPMorgan Chase climbing 11.5% and Wells Fargo jumping 13%. The SPDR S&P Regional Bank ETF (KRE)continued to climb in midday trading and is now up about 12%.
Credit card stocks soar
Two leading credit card companies were among the top performing stocks in the S&P 500 in early trading, according to FactSet. Shares of Discover Financial jumped 22%, while Capital One popped about 17%.
Solar stocks sold off Wednesday ETF TAN Republicans won control of the Senate, amid fears the Inflation Reduction Act, which helps fund clean energy manufacturing in the U.S., will be repealed.
The small-cap benchmark Russell 2000 surged, hitting a 52-week high. Small companies, which are more domestic-oriented and cyclical, are believed to enjoy outsized benefits from Trump’s tax cuts and protectionist policies. Trump is viewed as supporting lower corporate tax rates, deregulation, and industrial policies that favor domestic growth, all of which could provide more stimulus to the U.S. economy and benefit risk assets
Historically speaking, stocks rallied into year-end from Election Day. However, the S&P 500 and Russell 2000 perform even better during presidential election years, while the Nasdaq Composite does worse.
Goldman Sachs’ Kostin says earnings growth will drive stocks higher into 2025
“Robust earnings growth should drive continued equity market appreciation into next year,” he wrote in a Wednesday note. “We forecast EPS growth of 11% in 2025 and 7% in 2026, although those estimates may change as the new administration’s policy agenda comes into clarity.” Kostin’s team is keeping its 12-month S&P 500 target of 6,300, suggesting upside of about 9% from Tuesday’s close. The magnitude of the rally in stocks could be curtailed by a sharp rise in the 10-year Treasury yield, the strategist said.
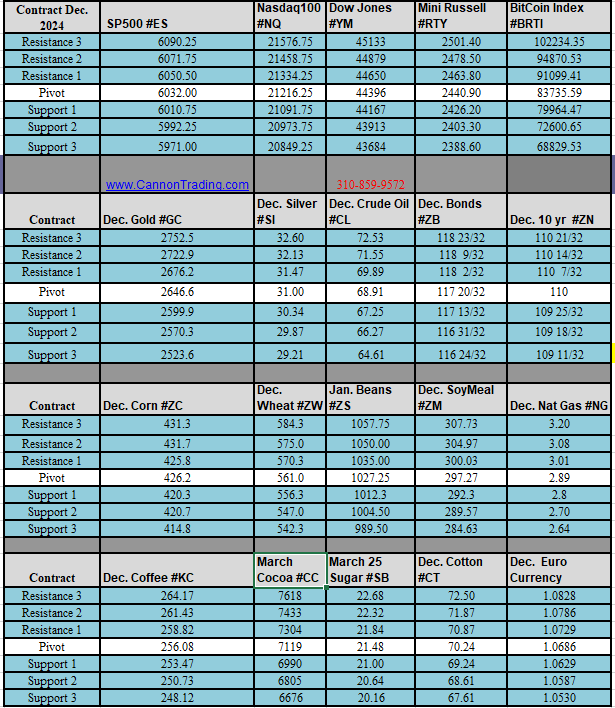
Futures:
Bitcoin, which could benefit from relaxed regulation, soared to an all-time high and topped $76,000. The dollar index climbed to its highest level since July on the belief that Trump’s proposed tariffs against major U.S. trading partners would boost the greenback. The 10-year Treasury yield jumped to around 4.43% on speculation Trump’s proposed tax cuts and other spending plans would spark economic growth, but also widen the fiscal deficit and reignite inflation.
Dollar at overbought levels, says strategist
On a technical level, the dollar has cleared the 104 resistance level, leaving the 106-107 level as the next major hurdle to overcome.
“Momentum is confirming the breakout but is overbought short-term. Support for pullbacks sets up at 104 and the 200-day moving average at 103.85,” said LPL Financial chief technical strategist Adam Turnquist.
Corn futures (/ZCZ24) closed higher to end the past week (+0.82%) with the December contract trading at highs last seen in late June. The USDA in its November World Agricultural Supply and Demands Estimates (WASDE) report estimated U.S. corn production at 15.143 billion bushels. This was below October’s 15.204 billion bushel estimate and below average analysts’ estimates for 15.190 billion bushels.
Cotton futures (/CTZ24) posted modest declines on Friday (–0.10%) after the USDA lowered U.S. cotton export projections by 200,000 bales to 11.3 million bales. The USDA also raised U.S. ending stocks projection by 200,000 bales to 4.3 million bales.
Crude oil futures (/CLZ24) ended the past week in the red as U.S. oil inventories posted a larger than expected build during the reporting period.
In its Weekly Petroleum Status Report, the Energy Information Administration (EIA) said crude oil stockpiles increased by 2.1 million barrels during the week ending November 1. This was above expectations for a 1.8-million-barrel build.
U.S. oil production remained unchanged last week and averaged 13.5 million barrels per day. This was up 300,000 barrels per day from one year ago.
On the oil product side, distillate inventories increased by 2.9 million barrels, contrary to market expectations for a 1.5-million-barrel draw. Distillate inventories are now 6% below the five-year average for this time of year.
Gasoline inventories rose by 400,000 barrels, contrary to forecasts for a 1.6-million-barrel draw. These stockpiles are now 2% below the five-year average.
EIA said gasoline production increased modestly from the previous week and averaged 9.7 million barrels per day. Distillate production also increased versus last week, averaging 5.1 million barrels per day.
The agency also reported that U.S. ethanol production increased last week, averaging 1.105 million barrels per day. Expectations were for 1.096 million barrels per day.
Ethanol inventories increased last week to 22 million barrels. Traders were expecting inventories of 22.4 million barrels.
Bonds: a run to 5% on the 10-year Treasury has been a level that gave markets pause in the recent past.”
China: China stock ETF drops amid Trump tariff fears. China-related stocks felt additional pain Friday on yet another disappointing stimulus update. What the market wants to see is the Chinese government put cash directly in the hands of people to boost consumption.
Earnings:
If you’ve been listening to companies’ post-earnings conference calls. Manufacturing has been weak, and there’s a freight recession.
FactSet pegged third-quarter S&P 500 EPS growth at 5.3% year over year, up from 5.1% a week ago. With 91% of companies reporting, 75% have delivered a positive earnings surprise and 60% have reported a positive revenue surprise.
It’s a quieter week of earnings with only 9 companies in the S&P 500 scheduled to report. Within the portfolio, Home Depot reports before the opening bell Tuesday and Disney before the opening bell Wednesday. Other notable companies reporting are Shopify, Tyson Foods, AstraZeneca, Spotify, Occidental, Cisco, Advance Auto Parts, Applied Materials, and Alibaba. Earnings may be on the lighter side.
- Monday (11/11): Monday.com Ltd. (MNDY), Zeta Global Holdings Corp. (ZETA), Assured Guaranty Ltd. (AGO)
- Tuesday (11/12): Home Depot Inc. (HD), AstraZeneca (AZN), Sea Ltd. (SE), Live Nation Entertainment Inc. (LYV), Tyson Foods (TSN), On Holdings (ONON), Spotify Technology SA (SPOT), Suncor Energy, Occidental Petroleum (OXY), Cava Group (CAVA)
- Wednesday (11/13): CyberArk Software Ltd. (CYBR), Cisco Systems Inc. (CSCO), Tetra Tech Inc. (TTEK), Helmerich and Payne Inc. (HP)
- Thursday (11/14): Walt Disney Co. (DIS), JD.com Inc. (JD), NetEase Inc. (NTES), Applied Materials (AMAT), Post Holdings (POST)
- Friday (11/15): Alibaba Group (BABA), Spectrum Brands Holdings (SPB)
Economic reports:
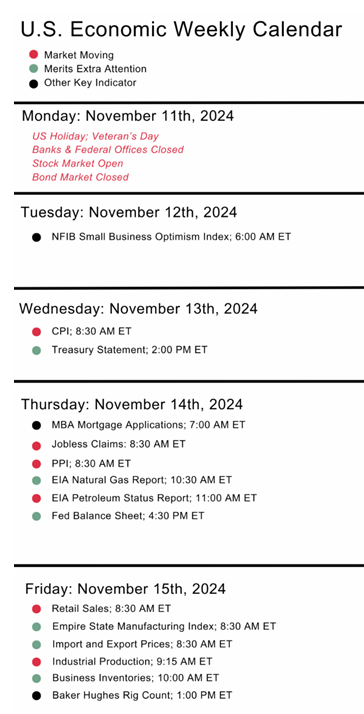
It’s a heavy week of economic data for inflation and consumer spending. On Wednesday there is the consumer price index (CPI) report and the next day we’ll see the producer price index (PPI) report. The October retail sales report is Friday.
- Monday (11/11): No reports
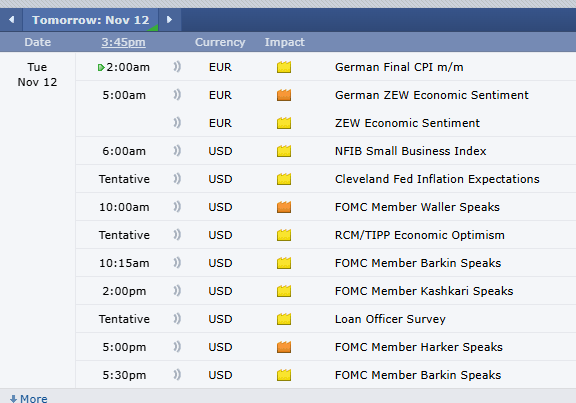
- Tuesday (11/12): NFIB Small Business Optimism
- Wednesday (11/13): Consumer Price Index (CPI), Core CPI, EIA Crude Oil Inventories, MBA Mortgage Applications Index, Treasury Budget
- Thursday (11/14): Continuing Claims, Producer Price Index (PPI), core PPI, EIA Natural Gas Inventories, Initial Claims
- Friday (11/15): Business Inventories, Capacity Utilization, Export Prices, Import Prices, Industrial Production, NY Fed Empire State Manufacturing, Retail Sales
Technical analysis:
The Russell 2000 index (RUT) gapped up 5.8% to fresh two-year highs on Wednesday despite a corresponding significant jump in bond yields. Furthermore, the index has held its ground, with only some minor consolidation following that move, which is characteristically bullish price action. The only near-term flag is that the Russell’s RSI is currently sitting at a slightly (overbought) level of 72.
Market Breadth:
SPX breadth lifted to 75.15% from 69.74%, the CCMP moved up to 50.83% from 45.13%, and the RTY jumped to 66.74% from 55.43%.
Trading stocks, commodity futures and options involves a substantial risk of loss. The information here is of opinion only and do not guarantee any profits. Past performances are not necessarily indicative of future results.
|


