Bull Markets hanging in there amid 200-day SMA, December Bean Oil, Levels, Reports (!); Your 4 Important Can’t-Miss Need-To-Knows for Trading Futures on November 19th, 2025

9dc1e02e d5f7 4ff4 abf7 1df60775f196

200-day Simple Moving Average (200-day SMA)

The Bull Market at Large

By John Thorpe, Senior Broker

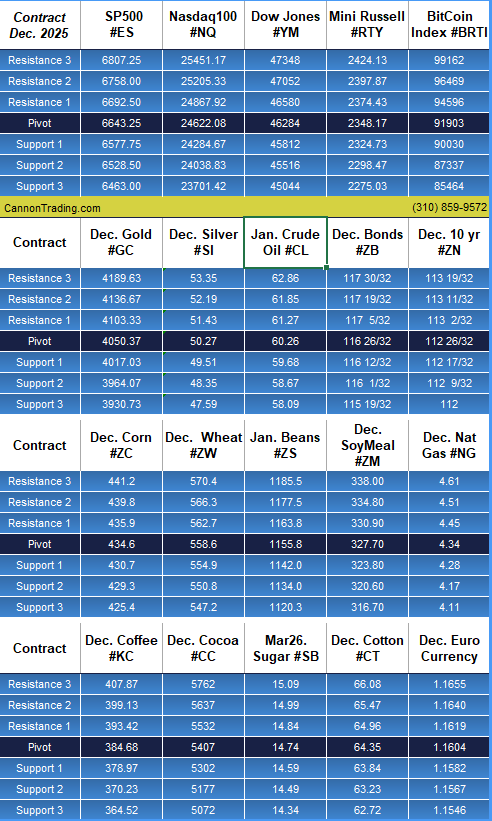
At-a-Glance Levels

Instrument S2 S1 Pivot R1 R2

Gold (GC)

— Dec (GCZ5)

3964.07 4017.03 4050.37 4103.33 4136.67

Silver (SI)

— Dec (SIZ5)

48.35 49.51 50.27 51.43 52.19

Crude Oil (CL)

— Dec (CLZ5)

58.67 59.68 60.26 61.27 61.85

 Dec. Bonds (ZB)

— Dec (ZBZ5)

116 1/32 116 12/32 116 26/32 117 5/32 117 19/32

Bulls are surviving…. For now.

  bull

Financial news networks and pundits are repeating “Bubble” due to the recent sell off in equities, “AI Bubble” Google boss Pichai “AI investment boom has elements of irrationality., “No Firm immune!”  Bob Michele, JPMorgan’s Chief Investment Officer, discusses lessons learned from the Dot.com bubble. Warning shots to be certain and perhaps the market is ripe for a change in tenor.

Rather than a blow the doors off rally or a sideways market (you can make a case the S&P 500 index has been trading in a range since mid-Sep.)

Where is the demarcation line that tells us we are in a Bear market? We are still in a Bull market so I thought I would do a deep dive into the technical indicator that has provided traders with meaningful support for a continuation of a Bull market. Or, once crossed, the resistance and the tenor of a Bear market.

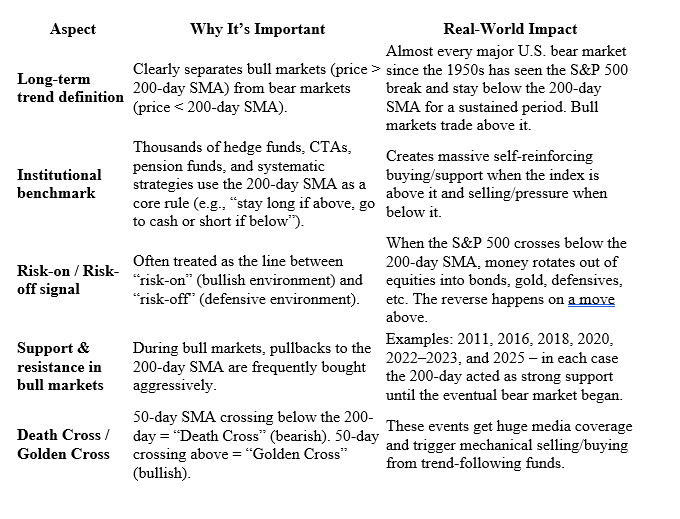
The 200-day Simple Moving Average (200-day SMA) is one of the most widely watched technical indicators in global financial markets, especially for the S&P 500. Its importance comes from a combination of institutional usage, psychological reinforcement, and historical track record. Here’s why it matters so much:

0dc5b80a fe3b 43cf 8cc2 4dfd9a40f491
c620badb b538 4d8f a149 ec970a770159

Quick Historical Examples

  • March 2020: S&P crashed below 200-day → confirmed bear market → trillions in systematic selling.
  • October 2022: Reclaimed the 200-day SMA → signaled new bull market → +45% rally since.
  • 2025 so far: Multiple tests of the rising 200-day were bought aggressively, reinforcing its role as dynamic support.

Bottom Line

The 200-day SMA is not magic, but because so many large players watch it and trade it, it has become one of the most important price levels on the chart. For the S&P 500 right now (November 2025), staying above ≈6,150–6,200 keeps the long-term bull market intact. A sustained break below would be a major warning signal that the character of the market has changed.

Where is the 200 Day today?

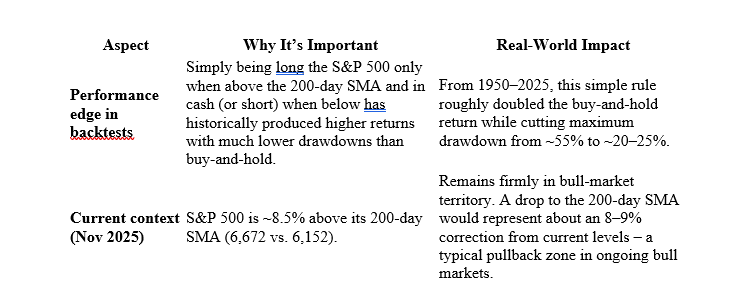
As of November 18, 2025 (using the most recent market close on November 17, 2025, as markets are closed over the weekend), the 200-day simple moving average (SMA) for the S&P 500 index is 6,151.63. This value reflects a slight increase of +3.16 (+0.05%) from the prior day, driven by the index’s ongoing bull market momentum.

For context:

  • The S&P 500 closed at 6,672.41 on November 17, trading well above its 200-day SMA (a bullish signal, as the index is approximately 8.5% higher).
  • The 200-day SMA is a widely used long-term trend indicator, calculated as the average closing price over the past 200 trading days.

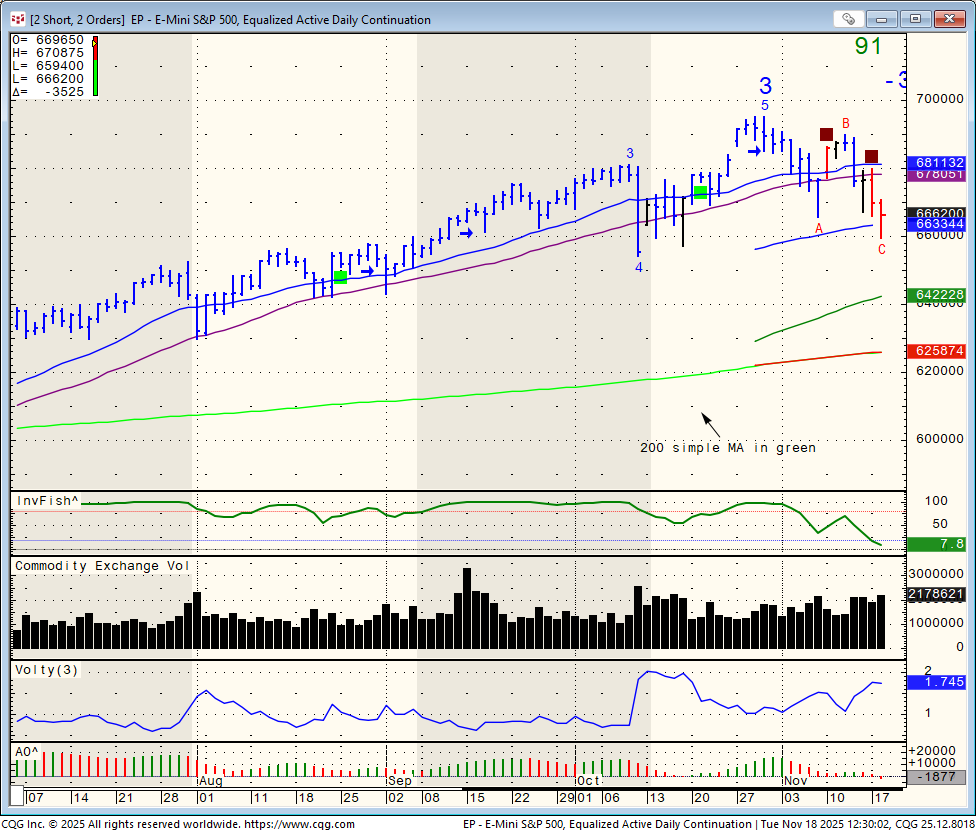
Mini SP daily chart with the 200 simple moving average below for review!

Plan your trade, trade your plan!

8d8be80b a5dd 4b53 abf0 57c046294165

December Bean Oil

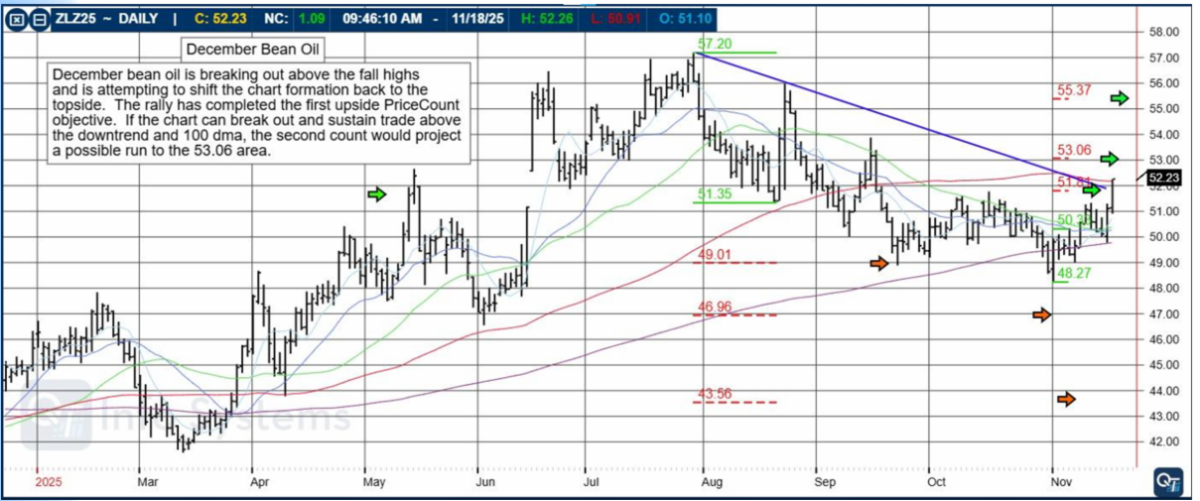
December bean oil is breaking out above the fall highs and is attempting to shift the chart formation back to the topside. The chart has confirmed the first upside PriceCount objective. If the chart can break out and sustain trade above the downtrend and 100 dma, the second count would project a move up to the 53.60 area.

52f906d9 9b27 4c9f a406 6bb8c864bc29

The PriceCount study is a tool that can help to project the distance of a move in price. The counts are not intended to be an ‘exact’ science but rather offer a target area for the four objectives which are based off the first leg of a move with each subsequent count having a smaller percentage of being achieved.

It is normal for the chart to react by correcting or consolidating at an objective and then either resuming its move or reversing trend. Best utilized in conjunction with other technical tools, PriceCounts offer one more way to analyze charts and help to manage your positions and risk. Learn more at www.qtchartoftheday.com

Trading in futures, options, securities, derivatives or OTC products entails significant risks which must be understood prior to trading and may not be appropriate for all investors. Past performance of actual trades or strategies is not necessarily indicative of future results.

Daily Levels for Nov. 19th, 2025

ed1024d9 a8c0 4796 8da4 aece9831eef9

Want to feature our updated trading levels on your website? Simply paste a small code, and they’ll update automatically every day! 

Click here for quick and easy instructions.

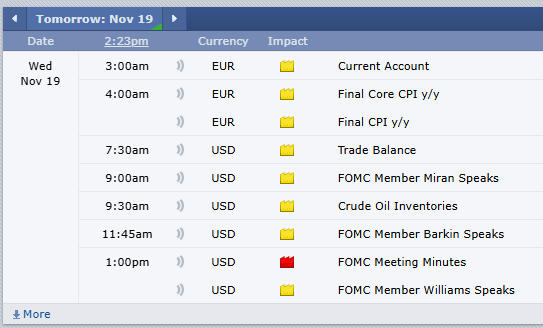
Economic Reports

 U.S. government data may be impacted by the shutdown. ‘Tentative’ events are subject to delay, revision, or cancellation

provided by: ForexFactory.com

All times are Central Time ( Chicago)

9256a285 542b 49a2 b824 4eef54dda4af

Find us on Trustpilot

stars

Trading Futures, Options on Futures, and retail off-exchange foreign currency transactions involves substantial risk of loss and is not suitable for all investors. You should carefully consider whether trading is suitable for you in light of your circumstances, knowledge, and financial resources. You may lose all or more of your initial investment. Opinions, market data, and recommendations are subject to change at any time.

Join our Private Facebook group

Subscribe to our YouTube Channel

Listen to our podcast: Subscribe on AppleSpotify, Amazon

or wherever you listen to podcasts!

S
Facebook  Instagram  LinkedIn
S
ef3ab1c9 8d6d 4e60 a3f1 af5d9d4ecbb3
Services
Software
Tools
Community
Contact