Volatility: What to do when it strikes your markets, January Natural Gas, Levels, Reports; Your 4 Important, Can’t-Miss Need-To-Knows for Trading Futures on November 21st, 2025

9dc1e02e d5f7 4ff4 abf7 1df60775f196

What is the first step to take when volatility explodes?

by Ilan Levy-Mayer, VP

At-a-Glance Levels

Instrument S2 S1 Pivot R1 R2

Gold (GC)

— Dec (GCZ5)

3997.30 4036.20 4072.90 4111.80 4148.50

Silver (SI)

— Dec (SIZ5)

48.93 49.58 50.58 51.23 52.22

Crude Oil (CL)

— Dec (CLZ5)

57.63 58.17 59.14 59.68 60.65

 Dec. Bonds (ZB)

— Dec (ZBZ5)

115 26/32 116 13/32 116 25/32 117 12/32 117 24/32
volatility

With recent volatility sweeping through markets like gold, silver, the E-mini Nasdaq, and the E-mini S&P 500, one of the most effective ways traders can adapt is by reducing position size. In fast-moving conditions, smaller size allows for wider stops and more flexible targets—critical tools for managing risk and staying in the game.

For example, if you typically trade 5 lots, consider scaling down to 2 and giving your trades more breathing room. If you’re trading 1 lot of the ES, switching to 4 lots of the Micro E-mini (MES) can offer similar exposure with more granular control.

With most major futures contracts now offering liquid micro versions, traders have more tools than ever to stay nimble and protect capital when volatility spikes.

✅ Schedule a one on one No Obligation Broker Consultation

S

January Natural Gas

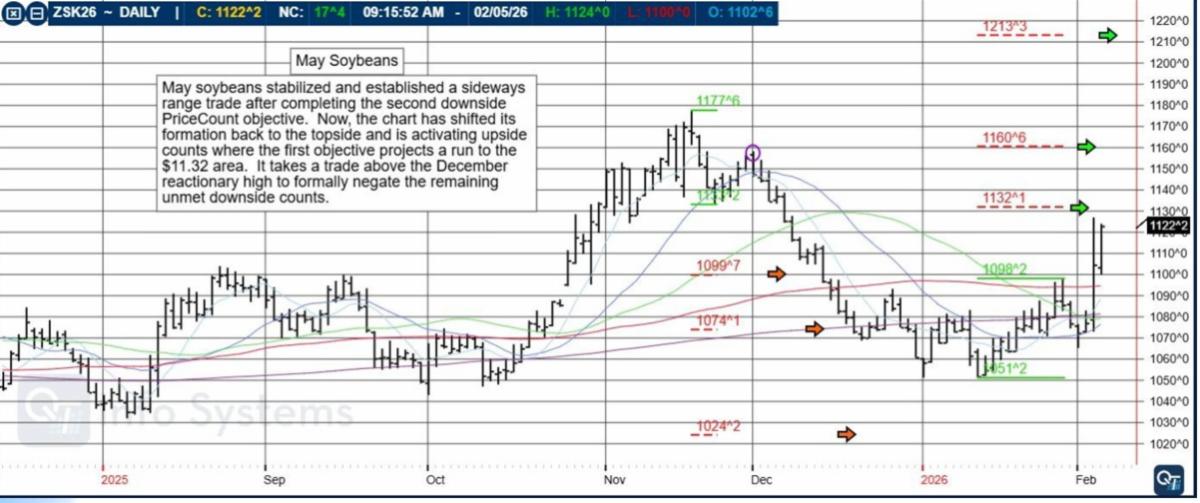
January natural gas completed its first upside PriceCount objective and corrected. Now, the chart is challenging its recent high where a sustained breakout would project a possible run to the second count in the 5.07 area.

e08f2ae6 93b2 4807 b8b8 9b439220a99f

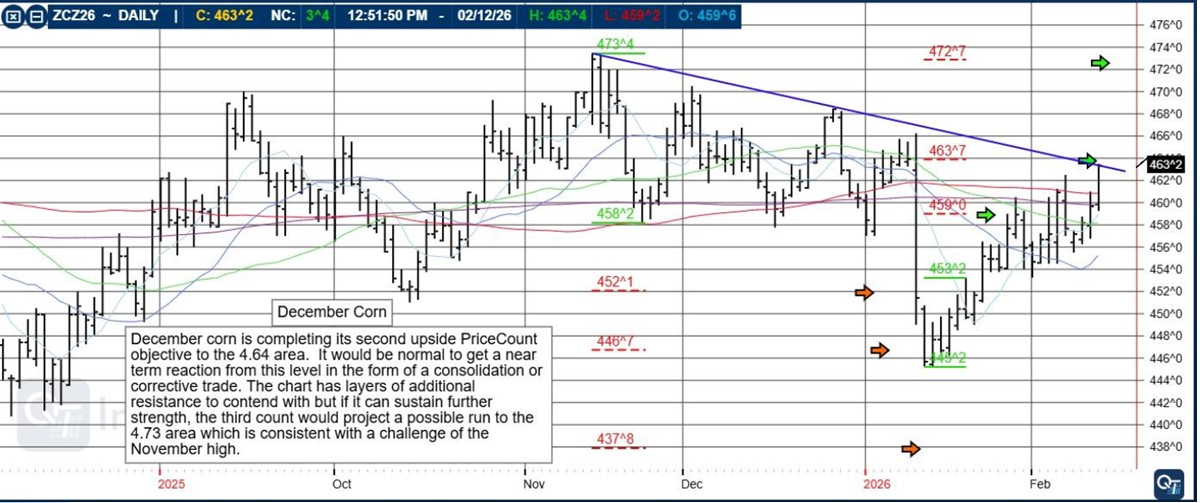
The PriceCount study is a tool that can help to project the distance of a move in price. The counts are not intended to be an ‘exact’ science but rather offer a target area for the four objectives which are based off the first leg of a move with each subsequent count having a smaller percentage of being achieved.

It is normal for the chart to react by correcting or consolidating at an objective and then either resuming its move or reversing trend. Best utilized in conjunction with other technical tools, PriceCounts offer one more way to analyze charts and help to manage your positions and risk. Learn more at www.qtchartoftheday.com

Trading in futures, options, securities, derivatives or OTC products entails significant risks which must be understood prior to trading and may not be appropriate for all investors. Past performance of actual trades or strategies is not necessarily indicative of future results.

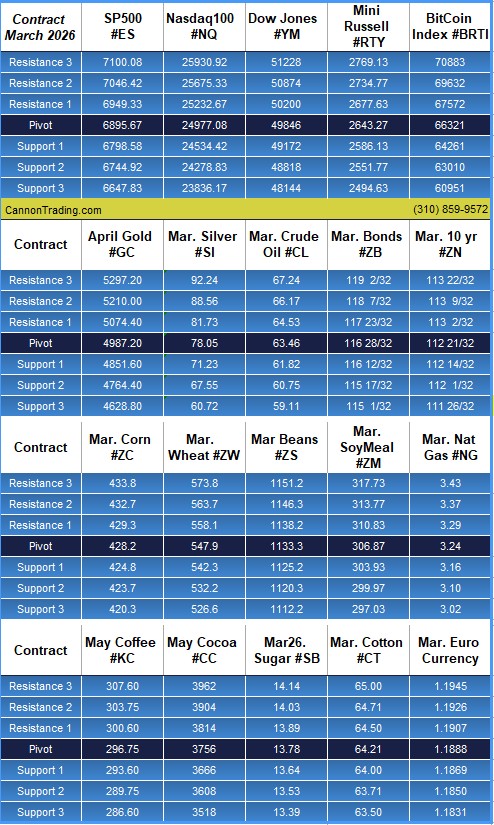
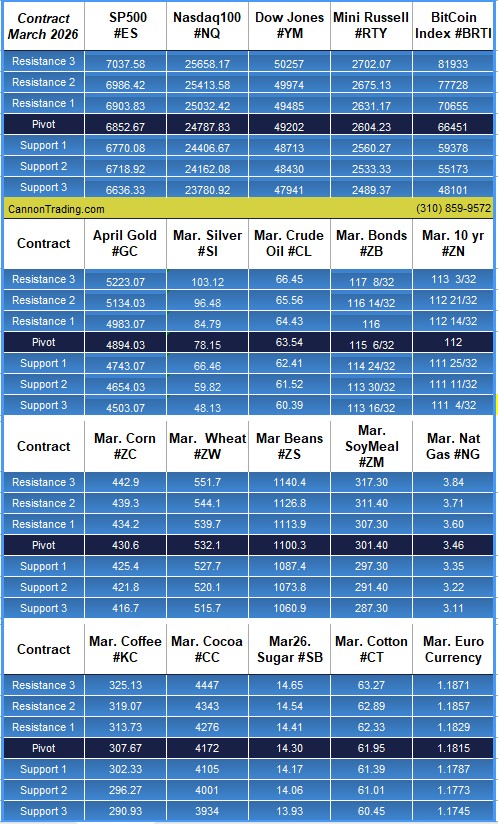
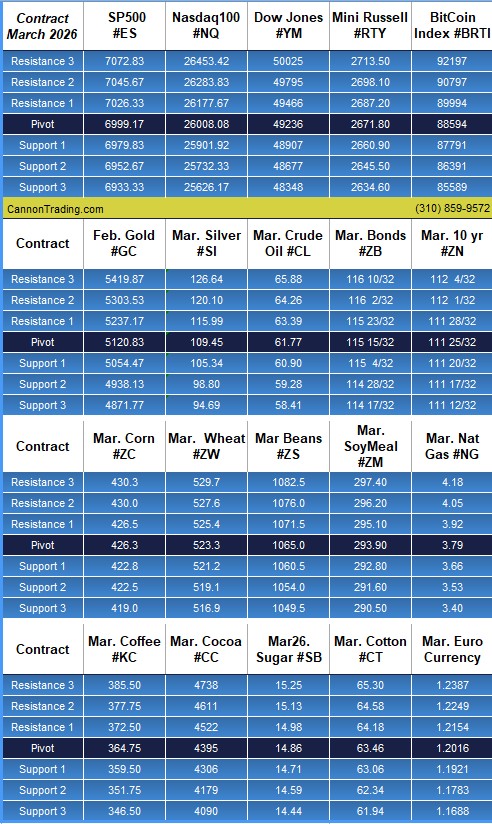
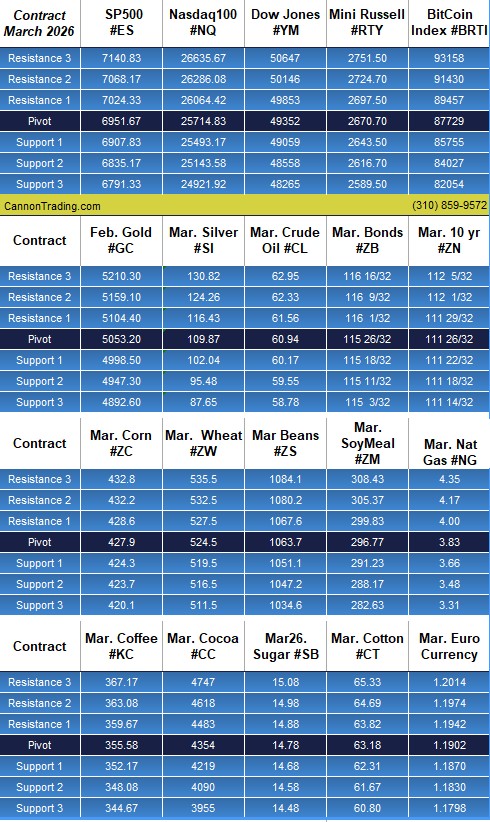
Daily Levels for Nov. 21st, 2025

8b839b5a 88e1 421c a3f5 30b968dd97d0

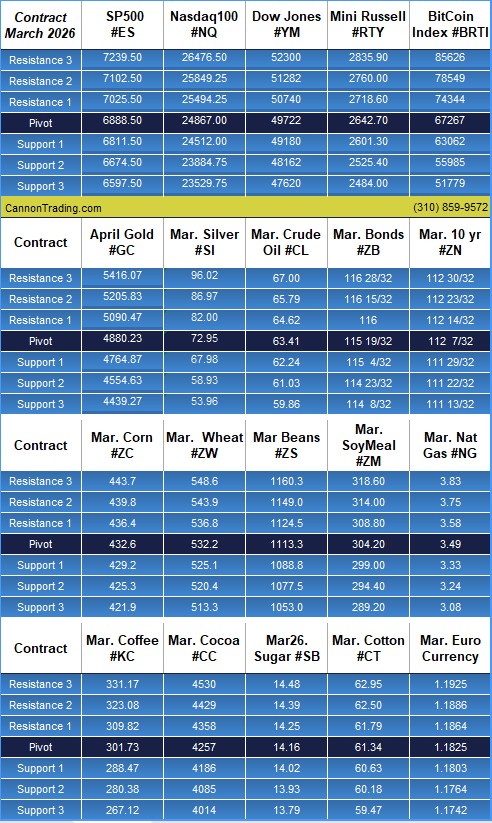
Want to feature our updated trading levels on your website? Simply paste a small code, and they’ll update automatically every day! 

Click here for quick and easy instructions.

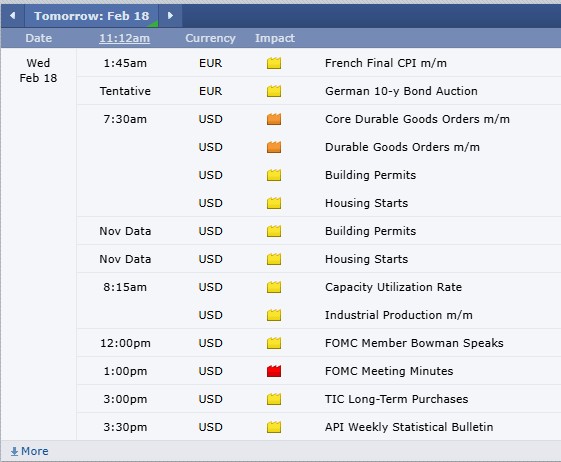
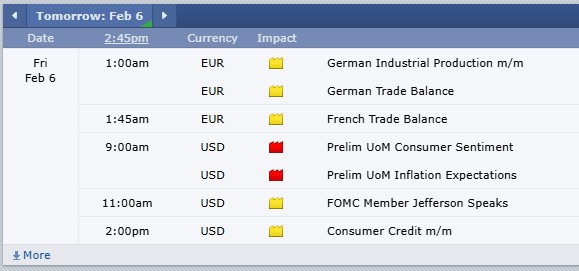
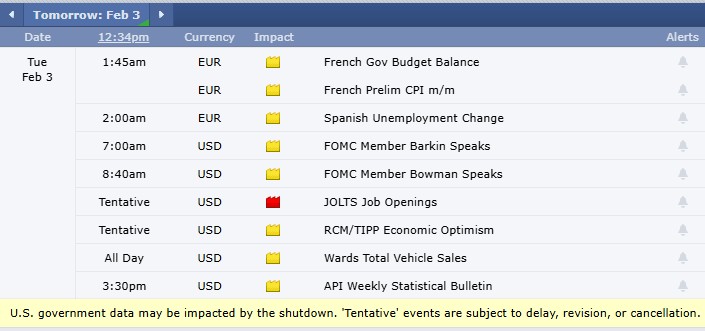
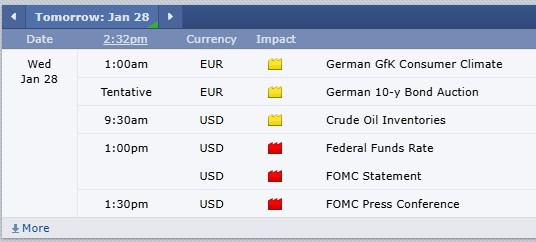
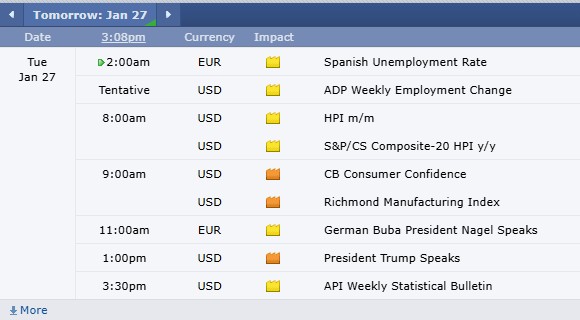
Economic Reports

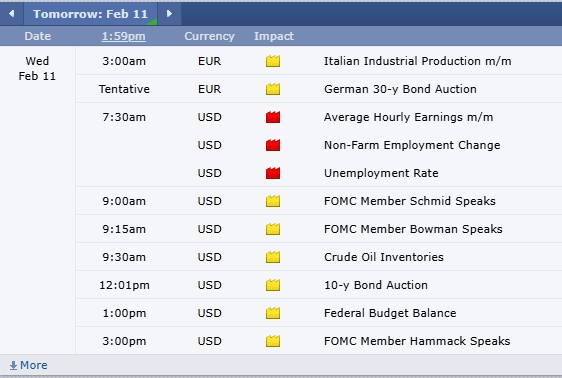
 U.S. government data may be impacted by the shutdown. ‘Tentative’ events are subject to delay, revision, or cancellation

provided by: ForexFactory.com

All times are Central Time ( Chicago)

15726f44 4385 4a8d bf0c 95aadb0cea45

Find us on Trustpilot

stars

Trading Futures, Options on Futures, and retail off-exchange foreign currency transactions involves substantial risk of loss and is not suitable for all investors. You should carefully consider whether trading is suitable for you in light of your circumstances, knowledge, and financial resources. You may lose all or more of your initial investment. Opinions, market data, and recommendations are subject to change at any time.

Join our Private Facebook group

Subscribe to our YouTube Channel

Listen to our podcast: Subscribe on AppleSpotify, Amazon

or wherever you listen to podcasts!

S
Facebook  Instagram  LinkedIn
S
ef3ab1c9 8d6d 4e60 a3f1 af5d9d4ecbb3
Services
Software
Tools
Community
Contact

Zero-DTE Options: Pros v. Cons, January Lumber, Levels, Reports; Your 5 Important, Can’t-Miss Need-To-Knows for Trading Futures on November 18th, 2025

9dc1e02e d5f7 4ff4 abf7 1df60775f196

Zero-DTE Options

by Ilan Levy-Mayer, VP

At-a-Glance Levels

Instrument S2 S1 Pivot R1 R2

Gold (GC)

— Dec (GCZ5)

3950.57 3995.13 4051.37 4095.93 4152.17

Silver (SI)

— Dec (SIZ5)

48.38 49.17 50.14 50.94 51.91

Crude Oil (CL)

— Dec (CLZ5)

58.65 58.18 59.74 60.27 60.83

 Dec. Bonds (ZB)

— Dec (ZBZ5)

116 116 11/32 116 22/32 117 1/32 117 12/32

zero-dte

Zero-DTE Options: Leveraging CME Liquidity in Volatile Markets

Recent volatility and sharp intraday swings in stock index futures and metals have created unique opportunities for active traders – possibly as an alternative for using futures with a stop loss. One increasingly popular tool for navigating these conditions is Zero-DTE (Zero Days to Expiration) options, available on CME Group’s deep and liquid markets.

What Are Zero-DTE Options?

Zero-DTE options are contracts that expire on the same day they are traded. CME Group offers same-day expiring options on major benchmarks like E-mini S\&P 500, Nasdaq-100, and key metals futures. These instruments allow traders to capitalize on short-term price action while avoiding overnight risk.

Advantages of Using CME Zero-DTE Options

  • Access to Benchmark Liquidity: CME Group provides unmatched liquidity in index and metals options, ensuring efficient execution even during volatile sessions.
  • Defined Risk Profiles for LONG options: LONG Options allow traders to manage exposure with clear maximum loss, unlike outright futures positions.
  • Strategic Flexibility: Ideal for intraday hedging, directional plays, or advanced strategies like spreads and iron condors.
  • Capital Efficiency: Lower upfront cost compared to futures, with margin benefits when combined with CME futures positions.

Key Considerations

  • Rapid Time Decay: With only hours to expiration, options lose value quickly if the market doesn’t move as anticipated.
  • Gamma Sensitivity: Price changes in the underlying can lead to significant swings in option value.
  • Execution Discipline: Liquidity is strong, but spreads can widen near expiration—precision matters.
  • Risk Management: Fast-moving markets require a clear plan and strict controls.

Consult with a Broker

Zero-DTE options on CME Group products can be powerful tools for active traders, but they require knowledge and discipline. Our experienced brokers can help you evaluate strategies, manage risk, and take full advantage of CME’s liquidity and product depth. Contact us today to learn more.

✅ Schedule a one on one No Obligation Broker Consultation

January Lumber

January Lumber is completing the third downside PriceCount objective. It would be normal to get a near term reaction from this level in the form of a consolidation or corrective trade, at least. At this point, IF the chart can sustain another leg down, we are left with the low percentage fourth count to aim for in the 454 area.

687f7c78 404f 497a 9a65 52952b14a30f

The PriceCount study is a tool that can help to project the distance of a move in price. The counts are not intended to be an ‘exact’ science but rather offer a target area for the four objectives which are based off the first leg of a move with each subsequent count having a smaller percentage of being achieved.

It is normal for the chart to react by correcting or consolidating at an objective and then either resuming its move or reversing trend. Best utilized in conjunction with other technical tools, PriceCounts offer one more way to analyze charts and help to manage your positions and risk. Learn more at www.qtchartoftheday.com

Trading in futures, options, securities, derivatives or OTC products entails significant risks which must be understood prior to trading and may not be appropriate for all investors. Past performance of actual trades or strategies is not necessarily indicative of future results.

Daily Levels for Nov. 18th, 2025

7b43d0c6 2966 4f6e a5c5 eb14a79436f7

Want to feature our updated trading levels on your website? Simply paste a small code, and they’ll update automatically every day! 

Click here for quick and easy instructions.

Economic Reports

 U.S. government data may be impacted by the shutdown. ‘Tentative’ events are subject to delay, revision, or cancellation

provided by: ForexFactory.com

All times are Central Time ( Chicago)

5fdb8e1a f365 46b7 b785 0dc36246ba6b

Find us on Trustpilot

stars

Trading Futures, Options on Futures, and retail off-exchange foreign currency transactions involves substantial risk of loss and is not suitable for all investors. You should carefully consider whether trading is suitable for you in light of your circumstances, knowledge, and financial resources. You may lose all or more of your initial investment. Opinions, market data, and recommendations are subject to change at any time.

Join our Private Facebook group

Subscribe to our YouTube Channel

Listen to our podcast: Subscribe on AppleSpotify, Amazon

or wherever you listen to podcasts!

S
Facebook  Instagram  LinkedIn
S
ef3ab1c9 8d6d 4e60 a3f1 af5d9d4ecbb3
Services
Software
Tools
Community
Contact

NFP? The Week Ahead, January Heating Oil, Levels, Reports; Your 5 Important Need-To-Knows for Trading Futures the Week of November 17th, 2025

7cfe5b36 db9f 4933 824a 7f264613e7fe

Cannon Futures Weekly Letter

In Today’s Issue #1267

  • The Week Ahead – NFP? FOMC minutes , 14 Fed Speakers, NVIDIA reports.
  • Futures 201 – Utilizing Options on Futures Webinar Recording!
  • Hot Market of the Week – January Heating Oil
  • Broker’s Trading System of the Week – Gold Day Trading System
  • Trading Levels for Next Week
  • Trading Reports for Next Week

At-a-Glance Levels

Instrument S2 S1 Pivot R1 R2

Gold (GC)

— Dec (GCZ5)

3928.07 4006.03 4110.57 4188.53 4293.07

Silver (SI)

— Dec (SIZ5)

47.73 49.12 51.25 52.64 54.76

Crude Oil (CL)

— Dec (CLZ5)

57.86 58.87 59.67 60.68 61.68

 Dec. Bonds (ZB)

— Dec (ZBZ5)

115 19/32 116 2/32 116 28/32 117 11/32 118 5/32

Important Notices: The Week Ahead

By John Thorpe, Senior Broker

NFP? From September dropping next week. FOMC minutes, 14 Fed Speakers, NVIDIA reports.

Due to the recent government shutdown (ending November 12, 2025), many standard monthly reports (e.g., jobs, CPI, retail sales) for October and possibly November have been delayed. Agencies like the Bureau of Labor Statistics (BLS), Bureau of Economic Analysis (BEA), and Census Bureau are still finalizing revised schedules, with updates expected imminently. As of November 14, only a limited number of reports are confirmed for next week. Delayed data may be released in batches, potentially including October figures, but exact timing remains fluid.

1f49c445 eb08 4a73 9769 16b3250c2108

nfp

As for earnings reports?  Next week we will see the numbers over 200 stocks.

What Market has been range bound and now breaking out? The longer the range trade the harder and faster the breakout becomes. Watch the Nat Gas as a breakout to the upside has been looming and ready to rock.

 Expect continued volatility next week as the markets have not been able to receive Gov’t data due to the ongoing, politician-imposed shutdown. Don’t be fooled, this is about politics NOT Policy.

We’ll see you next week! Please enjoy a safe and memorable weekend.

 Earnings Next Week:

  • Mon. Quiet
  • Tue. Home Depot, Medtronic
  • Wed.  NVIDIA, TJX Palo Alto Networks, JDeere, Lowe’s, Target
  • Thu. Ross
  • Fri.   Quiet

FED SPEECHES: (all times CDT)

  • Mon.  Williams, 8am, Jefferson 8:30 am, Kashkari 12pm, Waller 2:35 pm, Logan 6:35 pm
  • Tues.  Barr 9:30am
  • Wed.   Williams  1pm , FOMC MINUTES 1PM
  • Thu. Hammack 7:45 am, Cook 10am, Goolsbee 12:40
  • Fri. Jefferson 77:45am, Logan 8am

Economic Data week:

  • Please see calendar below of additional report dates, be mindful of the mid-week NonFarm Payrolls !
  • EIA is continuing normal operations and will report Crude oil and Nat Gas numbers.

RECORDED WEBINAR

Unlocking the Power of Options on Futures: A Smarter Way to Trade

WATCH THE RECORDED VIDEO NOW

Description

Ready to take your retail trading strategy to the next level? Join CME Group’s Ryan Gorman for a fast-paced, high-impact webinar that demystifies Options on Futures—a dynamic tool that blends the leverage of futures with the defined risk of options.

In this session, you’ll discover WATCH THE RECORDED VIDEO NOW:

• How options on futures are priced and settled

• Core strategies like buying calls/puts for speculation

• Income-generating tactics like covered calls

• Ways to hedge your portfolio and express market views with precision

Whether you’re trading commodities, indices, or currencies, this webinar will equip you with actionable insights to manage risk and enhance your trading edge.

WATCH THE RECORDED VIDEO NOW

Hot Market of the Week

Hot market of the week is provided by QT Market Center, A Swiss army knife charting package that’s not just for Hedgers, Cooperatives and Farmers alike but also for Spread traders, Swing traders and shorter time frame application for intraday traders with a unique proprietary indicator that can be applied to your specific trading needs.

Free Trial Available

January Heating Oil

January heating oil is challenging the June spike reversal high. At this point, IF the chart can break out with new sustained highs, the third upside PriceCount objective would project a possible run to the 2.63 area.

6836bd7b e54e 4248 88a4 932a26c010eb

The PriceCount study is a tool that can help to project the distance of a move in price. The counts are not intended to be an ‘exact’ science but rather offer a target area for the four objectives which are based off the first leg of a move with each subsequent count having a smaller percentage of being achieved.

It is normal for the chart to react by correcting or consolidating at an objective and then either resuming its move or reversing trend. Best utilized in conjunction with other technical tools, PriceCounts offer one more way to analyze charts and help to manage your positions and risk. Learn more at www.qtchartoftheday.com

Trading in futures, options, securities, derivatives or OTC products entails significant risks which must be understood prior to trading and may not be appropriate for all investors. Past performance of actual trades or strategies is not necessarily indicative of future results.

Brokers Trading System of the Week

RP GC Trading System

Markets Traded:   Gold

System Type: Day Trading

Risk per Trade: varies

Trading Rules: Not Disclosed

Suggested Capital: $23,000

Developer Fee per contract: $50 Monthly Subscription

Get Started

Learn More & Detailed Results

64e4ab70 37a1 497d 9edd d498dc6689e2

Disclaimer The risk of trading can be substantial and each investor and/or trader must consider whether this is a suitable investment. Past performance is not necessarily indicative of future results.

System Trades Disclosure:

System Description

“System Description” is based upon information obtained from specific system marketing documents, system developers and/or system vendors themselves. While the information is believed to be reliable, we cannot guarantee its completeness or accuracy.

Actual Monthly Performance

The table and charts represent the monthly/quarterly/annual summation of actual trades based on system-specified contract(s) executed through Striker Securities, Inc. using the referenced trading system or system vendor for the stated time period. Commissions and monthly vendor fees are deducted from the tabulation. Results are based on 1 contract.

If a client trades 2 contracts his gain or loss is twice as displayed (and so on). This table is presented for information purposes only and is not a solicitation for the referenced system or vendor. The purpose of this information is for clients to compare their brokerage statements to what is displayed on Striker’s site. Striker as a matter of policy has no ownership with the referenced system or vendor or any other trading system or vendor. Past trade history may not be indicative of future results.

The results indicated here may or may not be typical of the performance of this system and, ALTHOUGH WE BELIEVE THIS INFORMATION TO BE ACCURATE, CANNON TRADING COMPANY MAKES NO ENDORSEMENT OF THIS OR ANY SYSTEM NOR WARRANTS ITS PERFORMANCE. This is not the only trading system that Striker executes for its clients.

Potential traders should carefully investigate, evaluate and compare trading systems before investing capital. Some or all trading systems may involve an inappropriate level of risk for potential traders. It is the nature of commodity trading that where there is the opportunity for profit, there is also the risk of loss. In opening an account through CANNON TRADING COMPANY, Customer acknowledges and agrees that he/she will rely solely upon the information that CANNON TRADING COMPANYprovides to you. Thus, all prior third-party materials provided are superseded by the information and disclosures provided by CANNON TRADING COMPANY.

Important Information About this Trading System Analysis

Statistics, tables, charts and other information on trading system monthly performance are based on actual trading unless otherwise specified. Actual dollar and percentage gains/losses experienced by investors would depend on many factors not accounted for in these statistics, including, but not limited to, starting account balances, market behavior, developer fees, incidence of split fills and other variations in order execution, and the duration and extent of individual investor participation in the specified system.

While the information and statistics given are believed to be complete and accurate we cannot guarantee their completeness or accuracy as they results are key punched and subject to human error. Performance information is not the performance of a single account, but a compilation of several accounts over time, and is based on the physical trading ticket.

THIS INFORMATION IS PROVIDED FOR EDUCATIONAL/ INFORMATIONAL PURPOSES ONLY AND USED BY CURRENT CLIENTS TO AUDIT THEIR STATEMENTS TO STRIKER SITE. These results are not indicative of, and have no bearing on, any individual results that may be attained by the trading system in the future.

This trading system, like any other, may involve an inappropriate level of risk for prospective investors. THE RISK OF LOSS IN TRADING COMMODITY FUTURES AND OPTIONS CAN BE SUBSTANTIAL AND MAY NOT BE SUITABLE FOR ALL INVESTORS. Prior to purchasing or leasing a trading system from this or any other system vendor or investing in a trading system with a registered commodity trading representative, investors need to carefully consider whether such trading is suitable for them in light of their own specific financial condition.

In some cases, futures accounts are subject to substantial charges for commission, management, incentive or advisory fees.

It may be necessary for accounts subject to these charges to make substantial trading profits to avoid depletion or exhaustion of their assets. In addition, one should carefully study the accompanying prospectus, account forms, disclosure documents and/or risk disclosure statements required by the CFTC or NFA, which are provided directly by the system vendor and/or CTA’s.

The information contained in this report is provided with the objective of “standardizing” trading systems measurements, and it is intended for educational /informational purposes only. All information is offered with the understanding that an investor considering purchasing or leasing a system must carry out his/her own research and due diligence in deciding whether to purchase or lease any trading system noted within or without this report.

This report does not constitute a solicitation to purchase or invest in any trading system which may be mentioned herein. CANNON TRADING COMPANY AND STRIKER SECURITES, INC. MAKES NO ENDORSEMENT OF THIS OR ANY OTHER TRADING SYSTEM NOR WARRANTS ITS PERFORMANCE. THIS IS NOT A SOLICITATION TO PURCHASE OR SUBSCRIBE TO ANY TRADING SYSTEM.

Futures Trading Disclaimer:

Transactions in securities futures, commodity and index futures and options on futures carry a high degree of risk. The amount of initial margin is small relative to the value of the futures contract, meaning that transactions are heavily “leveraged”. A relatively small market movement will have a proportionately larger impact on the funds you have deposited or will have to deposit: this may work against you as well as for you. You may sustain a total loss of initial margin funds and any additional funds deposited with the clearing firm to maintain your position. If the market moves against your position or margin levels are increased, you may be called upon to pay substantial additional funds on short notice to maintain your position. If you fail to comply with a request for additional funds within the time prescribed, your position may be liquidated at a loss and you will be liable for any resulting deficit.

Would you like to get weekly updates on real-time, results of systems mentioned above?

Daily Levels for Nov. 17th, 2025

7706703b 2ae9 4825 88f6 074f40ccd735

Would you like to receive daily support & resistance levels?

Trading Reports for Next Week

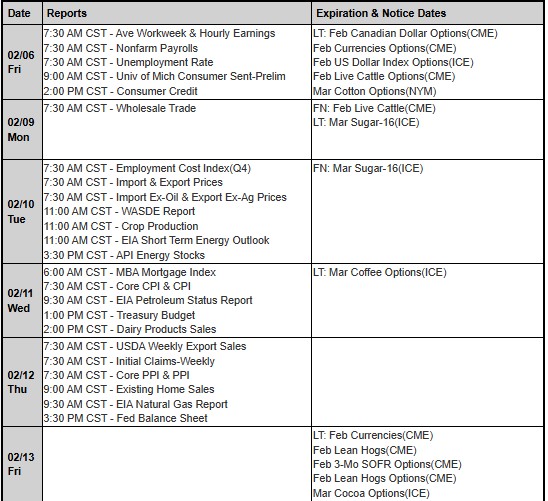
First Notice (FN), Last trading (LT) Days for the Week:

www.mrci.com

1dfbd543 1c70 4202 a10e 06df12bbd25f

Find us on Trustpilot

stars

Trading Futures, Options on Futures, and retail off-exchange foreign currency transactions involves substantial risk of loss and is not suitable for all investors. You should carefully consider whether trading is suitable for you in light of your circumstances, knowledge, and financial resources. You may lose all or more of your initial investment. Opinions, market data, and recommendations are subject to change at any time.

Join our Private Facebook group

Subscribe to our YouTube Channel

Listen to our podcast: Subscribe on AppleSpotify, Amazon

or wherever you listen to podcasts!

S
Facebook  Instagram  LinkedIn
S
ef3ab1c9 8d6d 4e60 a3f1 af5d9d4ecbb3
Services
Software
Tools
Community
Contact

End of the Longest Shutdown? PLUS: Metals, Energies, Natural Gas; Nov. 26 Soybeans, Levels; Your 6 Important Can’t-Miss Updates for Futures Trading on November 13th, 2025

9dc1e02e d5f7 4ff4 abf7 1df60775f196

The House of Representatives will vote on reopening the Federal Government this evening

By Mark O’Brien, Senior Broker

At-a-Glance Levels

Instrument S2 S1 Pivot R1 R2

Gold (GC)

— Dec (GCZ5)

4060.73 4131.17 4174.83 4245.27 4288.93

Silver (SI)

— Dec (SIZ5)

49.69 51.48 52.55 54.35 55.42

Crude Oil (CL)

— Dec (CLZ5)

56.51 57.47 59.27 60.23 62.03

 Dec. Bonds (ZB)

— Dec (ZBZ5)

116 27/32 117 6/32 117 17/32 117 28/32 118 7/32

shutdown

General:

Day 42 of the U.S Government shutdown, the longest on record. The House of Representatives will vote on reopening the federal government this evening. On Monday, the Senate broke through weeks of gridlock and passed the legislation to reopen the government in a 60-40 vote.

Metals:

Silver futures prices shot up over 5% today and is poised to close at a new record high,

exceeding the all-time high reached last month, which broke a 45-year-old price record. Silver futures have gained more than 11% so far this week on two of its biggest daily gains of 2025.  The last time silver prices added at least 10% in a week was last September, when futures were trading around $30.

Adjusted for inflation, silver would need to exceed $200 a troy ounce to top the 1980 peak, set before the Hunt brothers’ gambit went bust and inspired the Eddie Murphy comedy “Trading Places.”

Silver’s 73% rise this year has made the metal one of 2025’s best-performing assets, outpacing gold’s 56% jump above $4,000 an ounce, and the 17% gain in the Nasdaq composite stock index, both of which have also set new all-time highs this mont42

Energies:

Oil prices fell more than $2 a barrel today, weighed down by an OPEC report saying global oil supply will match demand in 2026, marking a further shift from its earlier projections of a supply deficit.

As well today, The Department of Energy’s statistical arm, the Energy Information Administration said in its Short-Term Energy Outlook report today that U.S. oil production is expected to set a larger record this year than previously forecast.

By mid-session, December WTI crude was down ~$2.70, or 4.4%, at $58.34 a barrel, a three-week low and below its 20-, 50- and 100-day moving averages.

Notable Natural gas statistics as of yesterday’s close:

Dec. contract hit its 52-week high of $4.565 yesterday. That’s up ~68% from its 52-week low of $2.696 hit Aug. 25, 2025, a ~52% increase. Still off ~70.5% from its record high of $15.378 hit Dec. 13, 2005. Month-to-date it is up 9.92%. Year-to-date it is up 90.00 cents or 24.77%

S
undefined
COTD 251112

The PriceCount study is a tool that can help to project the distance of a move in price. The counts are not intended to be an ‘exact’ science but rather offer a target area for the four objectives which are based off the first leg of a move with each subsequent count having a smaller percentage of being achieved.

It is normal for the chart to react by correcting or consolidating at an objective and then either resuming its move or reversing trend. Best utilized in conjunction with other technical tools, PriceCounts offer one more way to analyze charts and help to manage your positions and risk. Learn more at www.qtchartoftheday.com

Trading in futures, options, securities, derivatives or OTC products entails significant risks which must be understood prior to trading and may not be appropriate for all investors.

Past performance of actual trades or strategies is not necessarily indicative of future results.

Daily Levels for Nov. 13th, 2025

25d10fb2 e8ee 496d b4a4 edf2cf9dce91

Want to feature our updated trading levels on your website? Simply paste a small code, and they’ll update automatically every day! 

Click here for quick and easy instructions.

Economic Reports

 U.S. government data may be impacted by the shutdown. ‘Tentative’ events are subject to delay, revision, or cancellation

provided by: ForexFactory.com

All times are Central Time ( Chicago)

393e23d1 d3af 4284 842b cac53d319701

Find us on Trustpilot

stars

Trading Futures, Options on Futures, and retail off-exchange foreign currency transactions involves substantial risk of loss and is not suitable for all investors. You should carefully consider whether trading is suitable for you in light of your circumstances, knowledge, and financial resources. You may lose all or more of your initial investment. Opinions, market data, and recommendations are subject to change at any time.

Join our Private Facebook group

Subscribe to our YouTube Channel

Listen to our podcast: Subscribe on AppleSpotify, Amazon

or wherever you listen to podcasts!

S
Facebook  Instagram  LinkedIn
S
ef3ab1c9 8d6d 4e60 a3f1 af5d9d4ecbb3
Services
Software
Tools
Community
Contact

Veterans Day, Bloomberg Commodity Index, OPTIONS WEBINAR TOMORROW, Levels; Your 4 Important Can’t-Miss Updates for Trading Futures on November 12th, 2025

9dc1e02e d5f7 4ff4 abf7 1df60775f196

In Honor of Our Veterans

At-a-Glance Levels

Instrument S2 S1 Pivot R1 R2

Gold (GC)

— Dec (GCZ5)

4078.93 4107.27 4131.13 4159.47 4183.33

Silver (SI)

— Dec (SIZ5)

49.80 50.42 50.78 51.40 51.76

Crude Oil (CL)

— Dec (CLZ5)

59.00 59.97 60.62 61.59 62.24

 Dec. Bonds (ZB)

— Dec (ZBZ5)

116 14/32 117 117 9/32 117 27/32 118 4/32

veterans

A Poem for Veterans.

In the hush of November’s eleventh dawn, where poppies bloom in fields of memory’s lawn, we honor the brave, the veterans true, who traded youth for skies of endless blue.

They marched through storms, where futures hung in thread, Bets placed on hope when despair loomed ahead. Like traders charting waves of rise and fall, they hedged against the night, answering the call.

Futures trading, a dance with time’s unseen hand, Where grains and gold whisper across the land. But deeper still, the veterans’ sacred art— Securing tomorrows with valor’s beating heart.

In boardrooms bright or battlefields afar, we owe our trades, our dreams, to those who bore the scar. For every contract sealed, every harvest reaped, is built on freedoms they so fiercely kept.

So, raise a glass to warriors past and near, whose sacrifices make our futures clear. In markets wild or peaceful days, we roam, their legacy endures, forever home.

S
7f9123a3 163e 471f 8845 2f0d73018d8f

Master Options on Futures — Your Edge Starts Here

WEBINAR TOMORROW

Unlocking the Power of Options on Futures: A Smarter Way to Trade

Date & Time:

November 12, 2025

11:30 AM PT

Are you ready to trade smarter, not harder? Join CME Group’s Ryan Gorman for an exclusive, fast‑paced webinar that will show you how to harness the unique advantages of Options on Futures—combining the leverage of futures with the defined risk of options.

In just one session, you’ll learn how to:

  • ✅ Understand how options on futures are priced and settled
  • ✅ Apply core strategies like calls and puts for speculation
  • ✅ Generate income with tactics such as covered calls
  • ✅ Hedge your portfolio and express market views with precision

Whether you’re focused on commodities, indices, or currencies, this webinar delivers actionable insights you can use immediately to sharpen your trading edge.

Seats are limited — reserve your spot today and take the next step toward smarter futures trading.

Register Now – Space is Limited!

Bloomberg Commodity Index

The Bloomberg Commodity Index is a weighted index of commodities from the grains, meats, energy, metals, and soft sectors. The weekly chart is breaking out of its extended range of trade that will provide a base to take aim at its upside PriceCount objectives.

e5e3884e 15ea 4d8e 80b3 8a8e3d98cbaa

The PriceCount study is a tool that can help to project the distance of a move in price. The counts are not intended to be an ‘exact’ science but rather offer a target area for the four objectives which are based off the first leg of a move with each subsequent count having a smaller percentage of being achieved.

It is normal for the chart to react by correcting or consolidating at an objective and then either resuming its move or reversing trend. Best utilized in conjunction with other technical tools, PriceCounts offer one more way to analyze charts and help to manage your positions and risk. Learn more at www.qtchartoftheday.com

Trading in futures, options, securities, derivatives or OTC products entails significant risks which must be understood prior to trading and may not be appropriate for all investors.

Past performance of actual trades or strategies is not necessarily indicative of future results.

Daily Levels for Nov. 12th, 2025

0e291e52 3a7a 42b0 beb6 1fa1fb648fda

Want to feature our updated trading levels on your website? Simply paste a small code, and they’ll update automatically every day! 

Click here for quick and easy instructions.

Economic Reports

 U.S. government data may be impacted by the shutdown. ‘Tentative’ events are subject to delay, revision, or cancellation

provided by: ForexFactory.com

All times are Central Time ( Chicago)

385208f9 61e5 413b a87f 6d41c571d282

Find us on Trustpilot

stars

Trading Futures, Options on Futures, and retail off-exchange foreign currency transactions involves substantial risk of loss and is not suitable for all investors. You should carefully consider whether trading is suitable for you in light of your circumstances, knowledge, and financial resources. You may lose all or more of your initial investment. Opinions, market data, and recommendations are subject to change at any time.

Join our Private Facebook group

Subscribe to our YouTube Channel

Listen to our podcast: Subscribe on AppleSpotify, Amazon

or wherever you listen to podcasts!

S
Facebook  Instagram  LinkedIn
S
ef3ab1c9 8d6d 4e60 a3f1 af5d9d4ecbb3
Services
Software
Tools
Community
Contact

Government Shutdown drags on as the longest in US History, missing reports, December Heating Oil, Levels; Your 4 Important Need-To-Knows for Trading Futures the week of November 10th, 2025

7cfe5b36 db9f 4933 824a 7f264613e7fe

Cannon Futures Weekly Letter

In Today’s Issue #1266


Important Notices: The Week Ahead

By John Thorpe, Senior Broker

At-a-Glance Levels

Instrument S2 S1 Pivot R1 R2

Gold (GC)

— Dec (GCZ5)

3955.23 3983.07 4009.43 4037.27 4063.63

Silver (SI)

— Dec (SIZ5)

47.31 47.78 48.26 48.73 49.21

Crude Oil (CL)

— Dec (CLZ5)

58.72 59.27 59.86 60.41 61.00

 Dec. Bonds (ZB)

— Dec (ZBZ5)

116 16/32 116 25/32 117 4/32 117 13/32 117 24/32

shutdown

WASDE Monday CXL’D due to Government Shutdown 

Without this report, farmers must depend on local elevator bids, private forecasts, and regional university data instead of the usual official numbers. That shift increases market volatility and complicates forward sales, hedging, and crop planning. Traders and risk managers now have to make decisions with incomplete information, which can amplify price swings across commodities like corn, soybeans, and wheat.

Veterans Day Tuesday the 11th

Originally Armistice day following WWI, Veterans Day serves as a reminder of the sacrifices made by those who have served in the military. It is a day for Americans to express gratitude and respect for the bravery and dedication of veterans across the nation. Because of the ongoing government shutdown, numerous key US economic data releases are unavailable and will not be reported during the week of November 10, 2025. Agencies like the Bureau of Labor Statistics (BLS), Bureau of Economic Analysis (BEA), and the Census Bureau have suspended their operations. Even if the shutdown ends this weekend.

Potentially Delayed Reports (from shutdown-affected agencies):

  • Consumer Price Index (CPI) and Core CPI (November 13): Released by BLS (Department of Labor). This measures inflation and is often delayed during shutdowns.
  • Producer Price Index (PPI) and Core PPI (November 14): Also from BLS. Tracks wholesale inflation; commonly postponed.
  • Retail Sales (November 15): From the Census Bureau (Department of Commerce). Covers consumer spending data.
  • Import and Export Prices (November 15): Jointly from BLS and Census Bureau. Would likely be affected.
  • Business Inventories (potentially November 15): From Census Bureau. Often delayed.

Reports Likely Unaffected:

  • Federal Reserve Beige Book (if scheduled that week): Issued by the Fed, which operates independently and isn’t impacted by shutdowns.
  • Jobless Claims (November 14): From the Department of Labor, but sometimes partially released if essential staff are exempted.
  • Any private-sector reports (e.g., from ADP or ISM) or market data not tied to federal agencies.

As for earnings reports? Next week we will see the numbers over 1200 stocks.

What Market has been range bound and now breaking out? The longer the range trade the harder and faster the breakout becomes. Watch the U.S. Dollar as a breakout to the upside has been looming and ready to rock.

Expect continued volatility next week as the markets have not been able to receive Gov’t data due to the ongoing, politician-imposed shutdown. Don’t be fooled, this is about politics NOT Policy.

We’ll see you next week! Please enjoy a safe and memorable weekend.

Earnings Next Week:

  • Mon. Quiet
  • Tue. Quiet
  • Wed. Cisco
  • Thu. Baba, Disney, AMAT, Brookfield
  • Fri.  Quiet

FED SPEECHES: (all times CDT)

  • Mon. Quiet
  • Tues. Quiet
  • Wed.  Williams 8:20 am, Paulson 9:00am, Bostic 11:15am
  • Thu. Hammack 11:20am
  • Fri. Schmid 9:05am, Logan 1:30pm, Bostic 2:20pm

Economic Data week:

  • EIA is continuing normal operations and will report Crude oil and Nat Gas numbers. However, due to Veterans Day, Crude will be moved to afternoon Thursday @ 3:30pm CST and Nat gas to Friday Morning @ 9:30am CST.

Trading Challenge! – Simulated Environment, REAL CASH Prizes!

Get ready to put your trading skills to the test! Cannon Trading is proud to be part of the upcoming CME Group Trading Challenge, running November 9–14, 2025, where participants can compete in a risk‑free, simulated futures environment. Each trader starts with a $25,000 virtual account and the chance to trade across a wide range of CME Group products—including equities, energy, metals, FX, interest rates, agriculture, and even cryptocurrency contracts. Along the way, you’ll gain insights from industry veteran Bob Iaccino, access exclusive educational content, and compete for cash prizes of up to $2,500. Enrollment is free, but spots are limited—register today and see how your strategies stack up against fellow traders.

Join the Challenge for Free!

Trading Challenge! – Simulated Environment, REAL CASH Prizes!

Get ready to put your trading skills to the test! Cannon Trading is proud to be part of the upcoming CME Group Trading Challenge, running November 9–14, 2025, where participants can compete in a risk‑free, simulated futures environment.

Each trader starts with a $25,000 virtual account and the chance to trade across a wide range of CME Group products—including equities, energy, metals, FX, interest rates, agriculture, and even cryptocurrency contracts.

Along the way, you’ll gain insights from industry veteran Bob Iaccino, access exclusive educational content, and compete for cash prizes of up to $2,500. Enrollment is free, but spots are limited—register today and see how your strategies stack up against fellow traders.

Join the Challenge for Free!

Hot Market of the Week

Hot market of the week is provided by QT Market Center, A Swiss army knife charting package that’s not just for Hedgers, Cooperatives and Farmers alike but also for Spread traders, Swing traders and shorter time frame application for intraday traders with a unique proprietary indicator that can be applied to your specific trading needs.

Free Trial Available

December Heating Oil

December heating oil is challenging its contract highs. At this point, a breakout into new sustained highs would project a possible run in the third upside PriceCount objective to the 2.60 area.

5cbb4516 6583 4e3c bb5f 31ecfb4a25e1

The PriceCount study is a tool that can help to project the distance of a move in price. The counts are not intended to be an ‘exact’ science but rather offer a target area for the four objectives which are based off the first leg of a move with each subsequent count having a smaller percentage of being achieved.

It is normal for the chart to react by correcting or consolidating at an objective and then either resuming its move or reversing trend. Best utilized in conjunction with other technical tools, PriceCounts offer one more way to analyze charts and help to manage your positions and risk. Learn more at www.qtchartoftheday.com

Trading in futures, options, securities, derivatives or OTC products entails significant risks which must be understood prior to trading and may not be appropriate for all investors.

Past performance of actual trades or strategies is not necessarily indicative of future results.

Brokers Trading System of the Week

Abacus Upside ES Trading System

Markets Traded:   Mini SP 500

System Type: Swing Trading

Risk per Trade: varies

Trading Rules: Not Disclosed

Suggested Capital: $28,000

Developer Fee per contract: $175 Monthly Subscription


Get Started

Learn More & Detailed Results

4cc46a01 b308 46a9 a14f 002565e126f3

Disclaimer The risk of trading can be substantial and each investor and/or trader must consider whether this is a suitable investment. Past performance is not necessarily indicative of future results.

System Trades Disclosure:

System Description

“System Description” is based upon information obtained from specific system marketing documents, system developers and/or system vendors themselves. While the information is believed to be reliable, we cannot guarantee its completeness or accuracy.

Actual Monthly Performance

The table and charts represent the monthly/quarterly/annual summation of actual trades based on system-specified contract(s) executed through Striker Securities, Inc. using the referenced trading system or system vendor for the stated time period. Commissions and monthly vendor fees are deducted from the tabulation. Results are based on 1 contract. If a client trades 2 contracts his gain or loss is twice as displayed (and so on).

This table is presented for information purposes only and is not a solicitation for the referenced system or vendor. The purpose of this information is for clients to compare their brokerage statements to what is displayed on Striker’s site. Striker as a matter of policy has no ownership with the referenced system or vendor or any other trading system or vendor.

Past trade history may not be indicative of future results. The results indicated here may or may not be typical of the performance of this system and, ALTHOUGH WE BELIEVE THIS INFORMATION TO BE ACCURATE, CANNON TRADING COMPANY MAKES NO ENDORSEMENT OF THIS OR ANY SYSTEM NOR WARRANTS ITS PERFORMANCE.

This is not the only trading system that Striker executes for its clients. Potential traders should carefully investigate, evaluate and compare trading systems before investing capital. Some or all trading systems may involve an inappropriate level of risk for potential traders. It is the nature of commodity trading that where there is the opportunity for profit, there is also the risk of loss.

In opening an account through CANNON TRADING COMPANY, Customer acknowledges and agrees that he/she will rely solely upon the information that CANNON TRADING COMPANYprovides to you. Thus, all prior third-party materials provided are superseded by the information and disclosures provided by CANNON TRADING COMPANY.

Important Information About this Trading System Analysis

Statistics, tables, charts and other information on trading system monthly performance are based on actual trading unless otherwise specified. Actual dollar and percentage gains/losses experienced by investors would depend on many factors not accounted for in these statistics, including, but not limited to, starting account balances, market behavior, developer fees, incidence of split fills and other variations in order execution, and the duration and extent of individual investor participation in the specified system.

While the information and statistics given are believed to be complete and accurate we cannot guarantee their completeness or accuracy as they results are key punched and subject to human error. Performance information is not the performance of a single account, but a compilation of several accounts over time, and is based on the physical trading ticket. THIS INFORMATION IS PROVIDED FOR EDUCATIONAL/ INFORMATIONAL PURPOSES ONLY AND USED BY CURRENT CLIENTS TO AUDIT THEIR STATEMENTS TO STRIKER SITE. These results are not indicative of, and have no bearing on, any individual results that may be attained by the trading system in the future.

This trading system, like any other, may involve an inappropriate level of risk for prospective investors. THE RISK OF LOSS IN TRADING COMMODITY FUTURES AND OPTIONS CAN BE SUBSTANTIAL AND MAY NOT BE SUITABLE FOR ALL INVESTORS. Prior to purchasing or leasing a trading system from this or any other system vendor or investing in a trading system with a registered commodity trading representative, investors need to carefully consider whether such trading is suitable for them in light of their own specific financial condition.

In some cases, futures accounts are subject to substantial charges for commission, management, incentive or advisory fees. It may be necessary for accounts subject to these charges to make substantial trading profits to avoid depletion or exhaustion of their assets. In addition, one should carefully study the accompanying prospectus, account forms, disclosure documents and/or risk disclosure statements required by the CFTC or NFA, which are provided directly by the system vendor and/or CTA’s.

The information contained in this report is provided with the objective of “standardizing” trading systems measurements, and it is intended for educational /informational purposes only.

All information is offered with the understanding that an investor considering purchasing or leasing a system must carry out his/her own research and due diligence in deciding whether to purchase or lease any trading system noted within or without this report. This report does not constitute a solicitation to purchase or invest in any trading system which may be mentioned herein.

CANNON TRADING COMPANY AND STRIKER SECURITES, INC. MAKES NO ENDORSEMENT OF THIS OR ANY OTHER TRADING SYSTEM NOR WARRANTS ITS PERFORMANCE. THIS IS NOT A SOLICITATION TO PURCHASE OR SUBSCRIBE TO ANY TRADING SYSTEM.

Futures Trading Disclaimer:

Transactions in securities futures, commodity and index futures and options on futures carry a high degree of risk. The amount of initial margin is small relative to the value of the futures contract, meaning that transactions are heavily “leveraged”. A relatively small market movement will have a proportionately larger impact on the funds you have deposited or will have to deposit: this may work against you as well as for you. You may sustain a total loss of initial margin funds and any additional funds deposited with the clearing firm to maintain your position.

If the market moves against your position or margin levels are increased, you may be called upon to pay substantial additional funds on short notice to maintain your position. If you fail to comply with a request for additional funds within the time prescribed, your position may be liquidated at a loss and you will be liable for any resulting deficit.

Would you like to get weekly updates on real-time, results of systems mentioned above?

Daily Levels for Nov. 10th, 2025

e537cc8e 6f5e 440e 834c 67e28760f208

Would you like to receive daily support & resistance levels?

Trading Reports for Next Week

First Notice (FN), Last trading (LT) Days for the Week:

www.mrci.com

f15bca35 3b8c 4307 88dc dabf0e0675da

Find us on Trustpilot

stars

Trading Futures, Options on Futures, and retail off-exchange foreign currency transactions involves substantial risk of loss and is not suitable for all investors. You should carefully consider whether trading is suitable for you in light of your circumstances, knowledge, and financial resources. You may lose all or more of your initial investment. Opinions, market data, and recommendations are subject to change at any time.

Join our Private Facebook group

Subscribe to our YouTube Channel

Listen to our podcast: Subscribe on AppleSpotify, Amazon

or wherever you listen to podcasts!

S
Facebook  Instagram  LinkedIn
S
ef3ab1c9 8d6d 4e60 a3f1 af5d9d4ecbb3
Services
Software
Tools
Community
Contact

Time Average Bands vs. Bollinger Bands, December Natural Gas, NEW WEBINAR NEXT WEEK, Levels, Reports; Your 5 Vital Need-To-Knows For Trading Futures on November 7th, 2025

9dc1e02e d5f7 4ff4 abf7 1df60775f196

Time Average Bands

At-a-Glance Levels

Instrument S2 S1 Pivot R1 R2

Gold (GC)

— Dec (GCZ5)

3941.53 3965.37 3997.03 4020.87 4052.53

Silver (SI)

— Dec (SIZ5)

46.76 47.31 47.96 48.52 49.17

Crude Oil (CL)

— Dec (CLZ5)

57.95 58.76 59.63 60.44 61.31

 Dec. Bonds (ZB)

— Dec (ZBZ5)

115 31/32 116 20/32 117 1/32 117 22/32 118 3/32

Time Average Bands

Shaun Downey – www.cqg.com sign up for a free demo!

bands

Definition

The average range for each bar’s time of day is computed over a user-defined period. For example, on a 30-minute chart, the 12 p.m. bar has its range calculated over the last n days. Then the highest and lowest value of range for that time of day is computed over a much larger sample of bars. The difference between the current range is recorded against the highest and lowest range, and depending on the difference, an exponential moving average is calculated.

This average is given a user-defined minimum and maximum range which in the examples in the chapter are between a three and twenty-one period. The conclusion is that if, range is narrow in relationship to the history of that time of day, the average slows, but if range is large, the average speeds up. Due to the often-large differences in range between consecutive intraday bars the differences in the speed of the average from one bar to the next can be considerable.

Comparison with Adaptive Moving Averages

The performance of the average has similar characteristics to an adaptive moving average in that it will speed up when price trends (especially if range expands for the time of day as well) and slows down in sideways action. The adaptive average will often lose all movement in sideways and move horizontally. In a trend they can behave in contrasting fashion.

Adaptive averages will simply accelerate with a trend whilst the Time Average will do likewise in association with the time of day. This means there will be times when it is more sensitive than the Adaptive and others when it is slower.

The other key difference is that because the Time Average is always looking back to the previous period’s time of day the current bar’s average is already computed and does not move when we look at the current bar. This means there is always a fixed reference point.

Concept of a moving average that adjusted based on the:

  • time of the day
  • range
  • comparison between that range and the long-term average of range to create a dynamic average

However, whilst this is flexible, it does little to help in understanding risk and extremes. Once again in order to try and understand extremes 1,2 and 3 standard deviations are placed around the variable average.

Time Average Bands versus Bollinger Bands

Given that the moving average changes on every bar and looks at the relationship between range as opposed to the close-to-close, the behavior of the standard deviations is significantly different from how a traditional Bollinger Band would perform. The first major difference is that the Time Average Bands normally do not expand in opposite directions in a strong trend. This is because of the differences in analyzing range instead of the close.

This is a far more stable relationship as the differences in range are not as large as the difference between one close and the next. Typically, if the market trends up, this will cause the average to rise and the top bands will expand upwards as well, but the bottom bands will also move higher. The only time that the bands will move in opposite directions is if there is a significant change in range.

If the market then pauses and range contracts, it will take a considerable time for the bands to come back together. The example on the 60-Minute Cable chart shows the basic premise. The bands were close together before the economic number at 3 p.m. The effect of the number causes a huge expansion of range and prices close below the 3rd standard deviation down.

The bands expand, indicating a strong breakout. However, subsequent to the initial break the market inevitably calms down and range contracts. From that point onwards the first deviation band down marks short-term exhaustion points and the moving average as a resistance point.

Read the rest, see chart samples and more!

sd_202511-3_0 image
S
7f9123a3 163e 471f 8845 2f0d73018d8f

Dec. Natural Gas

December natural gas made a low just short of the final downside PriceCount objective. Now, on the correction higher, the chart has activated upside counts with the first objective projecting a run to the 4.53 area.

a27b9cd3 26b5 4cdb bbed 1239e1719dfc

Daily Levels for Nov. 7th, 2025

3312fbce af7d 4baf 9acd 6609e6233b1f

Want to feature our updated trading levels on your website? Simply paste a small code, and they’ll update automatically every day! 

Click here for quick and easy instructions.

Economic Reports

 U.S. government data may be impacted by the shutdown. ‘Tentative’ events are subject to delay, revision, or cancellation

provided by: ForexFactory.com

All times are Central Time ( Chicago)

faef5f68 f079 4fba b8ac 06901e89569c

Find us on Trustpilot

stars

Trading Futures, Options on Futures, and retail off-exchange foreign currency transactions involves substantial risk of loss and is not suitable for all investors. You should carefully consider whether trading is suitable for you in light of your circumstances, knowledge, and financial resources. You may lose all or more of your initial investment. Opinions, market data, and recommendations are subject to change at any time.

Join our Private Facebook group

Subscribe to our YouTube Channel

Listen to our podcast: Subscribe on AppleSpotify, Amazon

or wherever you listen to podcasts!

S
Facebook  Instagram  LinkedIn
S
ef3ab1c9 8d6d 4e60 a3f1 af5d9d4ecbb3
Services
Software
Tools
Community
Contact

FNDLTD! First Notice Last Trading Days, December Wheat, NEW WEBINAR, Levels, Reports; Your 5 Important Must-Knows for Trading Futures on November 4th, 2025

9dc1e02e d5f7 4ff4 abf7 1df60775f196

Wheat Outlook, First Notice Days & Last Trading Days (FNDLTD)

At-a-Glance Levels

Instrument S2 S1 Pivot R1 R2

Gold (GC)

— Dec (GCZ5)

3940.30 3981.10 4012.10 4052.90 4083.90

Silver (SI)

— Dec (SIZ5)

47.14 47.60 48.22 48.67 49.29

Crude Oil (CL)

— Dec (CLZ5)

60.01 60.51 61.00 61.50 61.99

 Dec. Bonds (ZB)

— Dec (ZBZ5)

116 19/32 116 29/32 117 8/32 117 18/32 117 29/32

FNDLTD:

fndltd

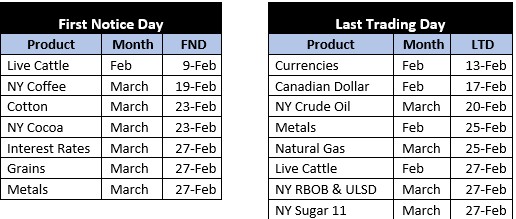
Below are the contracts which are entering First Notice or Last Trading Day (FNDLTD) for November.

Be advised, the contracts below are deliverable. It is requested that all LONG positions be exited two days prior to First Notice and ALL positions be exited the day prior to Last Trading Day.

dd7b35e6 46f2 42de 85d1 c48dde959159

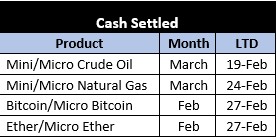
Cash Settled

Below are the contracts which are cash settled for November.

9dd99fd9 68c5 4c64 b825 39484bca395d
7f9123a3 163e 471f 8845 2f0d73018d8f
S

December Wheat

December wheat satisfied the third upside PriceCount objective off the October low. It would be normal for the chart to get a near term reaction in the form of a consolidation or corrective trade form this level, at least. IF you can sustain further upside, we are left with a low percentage fourth count to aim for in the 5.97 area.

df3823e5 a1ee 4d90 9f66 4ccf4f3c7227

The PriceCount study is a tool that can help to project the distance of a move in price. The counts are not intended to be an ‘exact’ science but rather offer a target area for the four objectives which are based off the first leg of a move with each subsequent count having a smaller percentage of being achieved.

It is normal for the chart to react by correcting or consolidating at an objective and then either resuming its move or reversing trend. Best utilized in conjunction with other technical tools, PriceCounts offer one more way to analyze charts and help to manage your positions and risk. Learn more at www.qtchartoftheday.com

Trading in futures, options, securities, derivatives or OTC products entails significant risks which must be understood prior to trading and may not be appropriate for all investors.

Past performance of actual trades or strategies is not necessarily indicative of future results.

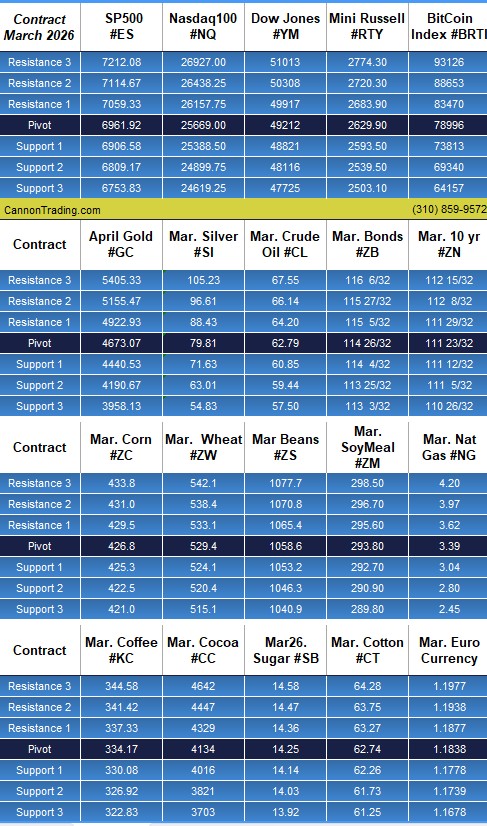
Daily Levels for Nov. 4th, 2025

81c0ea0a a7f8 4be0 b344 f2c5c91382a7

Want to feature our updated trading levels on your website? Simply paste a small code, and they’ll update automatically every day! 

Click here for quick and easy instructions.

Economic Reports

 U.S. government data may be impacted by the shutdown. ‘Tentative’ events are subject to delay, revision, or cancellation

provided by: ForexFactory.com

All times are Central Time ( Chicago)

1dcac795 292a 4200 b6a2 5a7dc019a2f2

Find us on Trustpilot

stars

Trading Futures, Options on Futures, and retail off-exchange foreign currency transactions involves substantial risk of loss and is not suitable for all investors. You should carefully consider whether trading is suitable for you in light of your circumstances, knowledge, and financial resources. You may lose all or more of your initial investment. Opinions, market data, and recommendations are subject to change at any time.

Join our Private Facebook group

Subscribe to our YouTube Channel

Listen to our podcast: Subscribe on AppleSpotify, Amazon

or wherever you listen to podcasts!

S
Facebook  Instagram  LinkedIn
S
ef3ab1c9 8d6d 4e60 a3f1 af5d9d4ecbb3
Services
Software
Tools
Community
Contact

Second Interest Rate Cut, December Cotton, Levels, Reports; Your 4 Critical Need-To-Knows for Trading Futures on October 30th, 2025

9dc1e02e d5f7 4ff4 abf7 1df60775f196

What You Need to Know Before Trading Futures Tomorrow!

By Mark O’Brien, Senior Broker

At-a-Glance Levels

Instrument S2 S1 Pivot R1 R2

Gold (GC)

— Dec (GCZ5)

3861.93 3910.07 3978.13 4026.27 4094.33

Silver (SI)

— Dec (SIZ5)

46.01 46.69 47.60 48.28 49.19

Crude Oil (CL)

— Dec (CLZ5)

59.02 59.67 60.34 60.99 61.66

 Dec. Bonds (ZB)

— Dec (ZBZ5)

117 7/32 117 20/32 118 13/32 118 26/32 119 19/32

interest

Interest Rates

It wasn’t even apparent during Chair Jerome Powell’s post-announcement news conference what triggered the price jolts in several of the futures markets this afternoon – including a ±50-point decline in the E-mini S&P 500 and a ±200-point decline in the E-mini Nasdaq in the span of eight minutes, or the ±$40 sell-off in gold in the span of two minutes.

Regardless of the cause, they served as the latest real-world examples of why it’s so important for traders of all types to assess the risks of their trades – before you enter into them – and have a plan to manage that risk. Day traders and position traders alike should be aware of important planned events – just like FOMC announcements and press conferences – and anticipate the potential risks to those events (these days it’s wise to include occasions when the U.S. president speaks, considering his ongoing involvement and influence in global trade relations).

These events certainly create opportunities for traders – outsize moves can also result in outsize favorable outcomes – but the most important aspect to trading – is always to manage risk.

General – Interest Rates:

Day 29 of the U.S Government shut-down, now the second-longest on record.

The Federal Reserve cut interest rates by a quarter of a percentage point today – its second consecutive rate cut, lowering the Fed’s benchmark interest rate to a range of 3.75 to 4 percent, its lowest level in three years.

Stock Index Futures:

We’re amidst earning season for the third quarter. Moving into full swing, all eyes were on Microsoft, Google-parent Alphabet and Facebook-owner Meta today– all releasing their latest earnings results after the closing bell.

Tomorrow:

Apple and Amazon

eedd6ceb 177c 4281 a073 6422fe004207

December Cotton

December cotton violated its contract low this month but for now was unable to sustain the break towards the low percentage drawn downside PriceCount objective near 57 cents not shown here for presentation purposes. The new chart has activated upside counts on the correction higher and is quickly approaching the first objective to the 66.27 area. To achieve any additional upside targets, we will first have to break out above the long-term downtrend

9ce7dfa6 6d50 42e2 9710 3fd1664febc6

The PriceCount study is a tool that can help to project the distance of a move in price. The counts are not intended to be an ‘exact’ science but rather offer a target area for the four objectives which are based off the first leg of a move with each subsequent count having a smaller percentage of being achieved.

It is normal for the chart to react by correcting or consolidating at an objective and then either resuming its move or reversing trend. Best utilized in conjunction with other technical tools, PriceCounts offer one more way to analyze charts and help to manage your positions and risk. Learn more at www.qtchartoftheday.com

Trading in futures, options, securities, derivatives or OTC products entails significant risks which must be understood prior to trading and may not be appropriate for all investors. Past performance of actual trades or strategies is not necessarily indicative of future results.

Daily Levels for Oct. 30th, 2025

92e0c1e9 f423 4e88 bff9 33ca99e54707

Want to feature our updated trading levels on your website? Simply paste a small code, and they’ll update automatically every day! 

Click here for quick and easy instructions.

Economic Reports

 U.S. government data may be impacted by the shutdown. ‘Tentative’ events are subject to delay, revision, or cancellation

provided by: ForexFactory.com

All times are Central Time ( Chicago)

8dc91c71 6291 4a52 93ec dc302d65a300

Find us on Trustpilot

stars

Trading Futures, Options on Futures, and retail off-exchange foreign currency transactions involves substantial risk of loss and is not suitable for all investors. You should carefully consider whether trading is suitable for you in light of your circumstances, knowledge, and financial resources. You may lose all or more of your initial investment. Opinions, market data, and recommendations are subject to change at any time.

Join our Private Facebook group

Subscribe to our YouTube Channel

Listen to our podcast: Subscribe on AppleSpotify, Amazon

or wherever you listen to podcasts!

S
Facebook  Instagram  LinkedIn
S
ef3ab1c9 8d6d 4e60 a3f1 af5d9d4ecbb3
Services
Software
Tools
Community
Contact

FOMC Tomorrow, December Live Cattle, Levels, Reports; Your 4 Important Need-To-Knows for Trading Futures on October 29th, 2025

9dc1e02e d5f7 4ff4 abf7 1df60775f196

FOMC Tomorrow

By John Thorpe, Senior Broker

At-a-Glance Levels

Instrument S2 S1 Pivot R1 R2

Gold (GC)

— Dec (GCZ5)

3837.43 3906.47 3970.33 4039.37 4103.23

Silver (SI)

— Dec (SIZ5)

44.83 46.01 46.69 47.88 48.56

Crude Oil (CL)

— Nov (CLX5)

58.65 59.28 60.39 61.02 62.13

 Dec. Bonds (ZB)

118 18/32 118 27/32 119 1/32 119 10/32 119 16/32
fomc
 

October 29th, Tomorrow, is the 96th anniversary (seems like the term “anniversary” should be celebratory rather than marking a day of dread for the nation) Black Tuesday: when the US Stock Market crashes, ending the Great Bull Market of the 1920s and eventually contributing to the Great Depression. While we don’t expect this current Great Bull Market will crash tomorrow, yet anytime soon, it is not a novel idea to manage risk, it’s imperative.

Tomorrow is also the release of the expected 2nd to last in a series of Fed Rate cuts while Chairman Jerome Powell will read a statement and will avail himself to the Press Corps. Expectations are for .25 reduction to the 3.75-4.00 range. Although surprises do occur, the only surprise tomorrow would be in the language used to massage future rate cuts, rather than the cut itself. Big Earnings after the close tomorrow as Microsoft, Google and Meta.

Previously in this blog I have included some option strategies, for both high volatility markets and low volatility markets. Measures of volatility are important to understand more holistically your risk management requirements when implementing your option strategy. I am including some basic definitions of the “Greeks” used to measure the impact of volatility on Option Premiums. In trading futures options, they help traders assess risk and manage their portfolios. Below are the definitions of the primary Greeks, tailored to futures options:

·        Delta: Measures the rate of change in an option’s price for a $1 change in the underlying futures contract’s price. It ranges from 0 to 1 for calls and -1 to 0 for puts. For example, a delta of 0.5 means the option’s price moves $0.50 for every $1 move in the futures price. Delta also approximates the probability the option will expire in-the-money.

·        Gamma: Measures the rate of change in delta for a $1 change in the underlying futures price. It reflects the acceleration of the option’s price movement. High gamma indicates delta is highly sensitive to price changes, which is common for at-the-money options near expiration.

·        Theta: Measures the rate of change in an option’s price due to the passage of time, often called time decay. It’s typically negative, as options lose value as expiration approaches. For example, a theta of -0.05 means the option loses $0.05 per day, all else equal.

·        Vega: Measures the sensitivity of an option’s price to a 1% change in the implied volatility of the underlying futures contract. For example, a Vega of 0.10 means the option’s price increases by $0.10 if implied volatility rises by 1%. Vega is higher for longer-dated options.

·        Rho: Measures the sensitivity of an option’s price to a 1% change in interest rates. For futures options, Rho is often less significant due to typically short maturities and stable interest rates, but it still indicates how much the option price changes with shifts in the risk-free rate.

These Greeks are critical for understanding how factors like price movements, time, volatility, and interest rates impact futures options pricing and risk. If you’d like, I can dive deeper into any specific Greek or provide examples of their application in trading strategies.

 Instant Viewing/Download: Commitment of Traders Report – How to Use?

S
59a24b78 44ed 43f8 b14f 0b4be945165c

December Live Cattle

The rally in December live cattle lost its momentum this month and activated downside PriceCount objectives on the correction lower. The break accelerated to its third count to the 224.50 area where it appears we may try to stabilize for a moment, at least. At this point, IF the chart can sustain further weakness, the low percentage fourth count would project a possible move to the 200.00 area.

43b2fa10 2a35 4003 bdcc 632b9fdcca5e

The PriceCount study is a tool that can help to project the distance of a move in price. The counts are not intended to be an ‘exact’ science but rather offer a target area for the four objectives which are based off the first leg of a move with each subsequent count having a smaller percentage of being achieved.

It is normal for the chart to react by correcting or consolidating at an objective and then either resuming its move or reversing trend. Best utilized in conjunction with other technical tools, PriceCounts offer one more way to analyze charts and help to manage your positions and risk. Learn more at www.qtchartoftheday.com

Trading in futures, options, securities, derivatives or OTC products entails significant risks which must be understood prior to trading and may not be appropriate for all investors. Past performance of actual trades or strategies is not necessarily indicative of future results.

Daily Levels for Oct. 29th, 2025

ef30fe20 a632 49d0 9845 56785a5df235

Want to feature our updated trading levels on your website? Simply paste a small code, and they’ll update automatically every day! 

Click here for quick and easy instructions.

Economic Reports

 U.S. government data may be impacted by the shutdown. ‘Tentative’ events are subject to delay, revision, or cancellation

provided by: ForexFactory.com

All times are Central Time ( Chicago)

ef00758d b25c 4cf9 b8b9 bddb312cea80

Find us on Trustpilot

stars

Trading Futures, Options on Futures, and retail off-exchange foreign currency transactions involves substantial risk of loss and is not suitable for all investors. You should carefully consider whether trading is suitable for you in light of your circumstances, knowledge, and financial resources. You may lose all or more of your initial investment. Opinions, market data, and recommendations are subject to change at any time.

Join our Private Facebook group

Subscribe to our YouTube Channel

Listen to our podcast: Subscribe on AppleSpotify, Amazon

or wherever you listen to podcasts!

S
Facebook  Instagram  LinkedIn
S
ef3ab1c9 8d6d 4e60 a3f1 af5d9d4ecbb3
Services
Software
Tools
Community
Contact