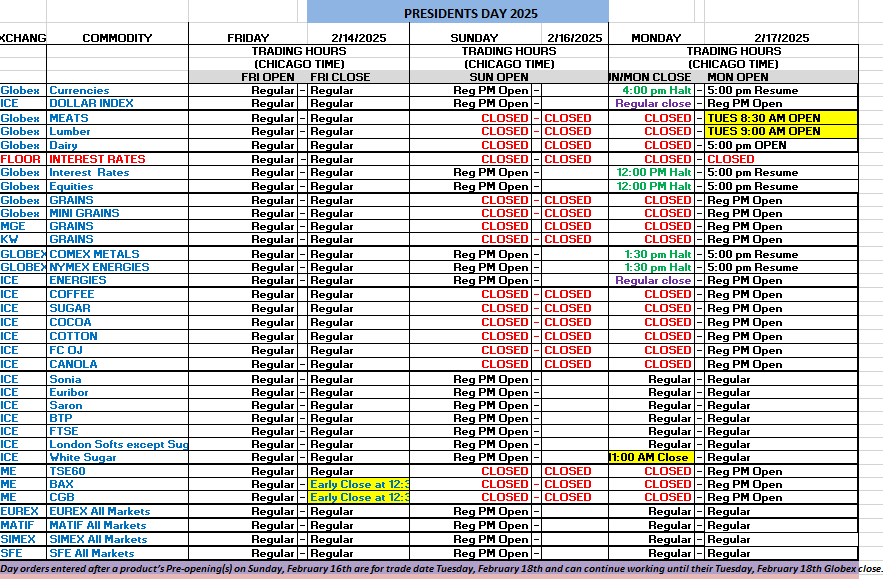
Weekly Newsletter: Hogs Outlook, Mini Russell System+ Trading Levels for Oct. 21st

Get Real Time updates and more by joining our Private Facebook Group!
Subscribe to our YouTube Channel

Hogs

Cannon Futures Weekly Letter Issue # 1213

In this issue:

  • Important Notices – Earnings & Fed Speakers
  • Futures 101 – Ask a Broker: Day trading Futures? Margins?
  • Hot Market of the Week – December Hogs
  • Broker’s Trading System of the Week – Mini Russell Day Trading System
  • Trading Levels for Next Week
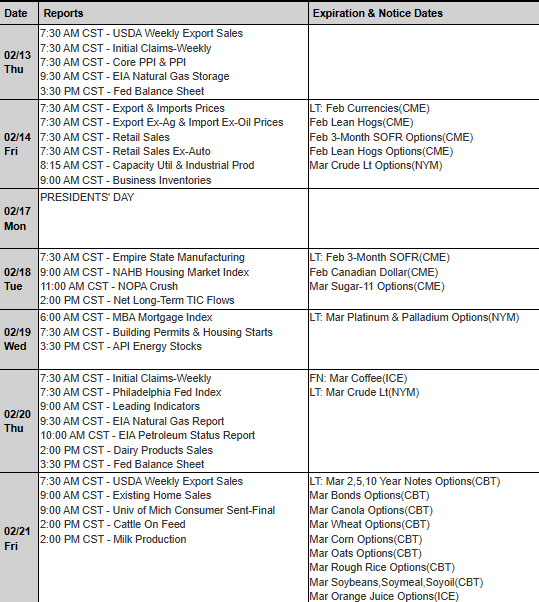
  • Trading Reports for Next Week


Important Notices – Next Week Highlights:


The Week Ahead

By John Thorpe, Senior Broker


A fair amount of Speakers, Data and Earnings .

Just 2 ½ weeks to the U.S. Presidential Election. Nov 5th.


Economic Data:

Mon. CB Leading Indicators

Tue. Redbook, Richmond Fed

Wed. Mortgage Index

Thu. Chicago Fed Activity Index, Weekly Initial Jobless Claims, New Home Sales

Fri. Durable Goods, Michigan Consumer Sentiment.


Fed and ECB Speakers:

Mon. Logan, Kashkari, Schmid

Tue. 9A.M. Central ECB President Lagarde,  Harker

Wed. Bowman, LaGarde 9 A.M. Central, Barkin

Thu. Hammack

Fri. quiet


Earnings: 608 3rd QTR. Reports this week

Prominent Companies reporting

Wed. Tesla, IBM, Coca-Cola

  • Thu. UPS


Futures 101: Ask a Broker!!

What is Futures Margin?

thumbnail?url=https%3A%2F%2Fi.ytimg.com%2Fvi%2F2VQwRHHIQ8Y%2Fhqdefault

What is Day Trading Futures?


“Trading Around Key Economic Reports” FREE SHORT Course you will learn:

  • What is GDP?
  • About the Retail Sales Report
  • What is NFP ( non farm payroll) Report?
  • Understanding US housing Data
  • FOMC
  • Understanding Oil Data Report
  • Importance of Consumer Confidence Survey

ACCESS THE COURSE


stars

3b644da2 2bee 4d39 8d98 5208a20bec39


    • Hot Market of the Week – December Hogs

    Hot market of the week is provided by QT Market Center, A Swiss army knife charting package that’s not just for Hedgers, Cooperatives and Farmers alike but also for Spread traders, Swing traders and shorter time frame application for intraday traders with a unique proprietary indicator that can be applied to your specific trading needs.

    FREE TRIAL AVAILABLE

    December Hogs

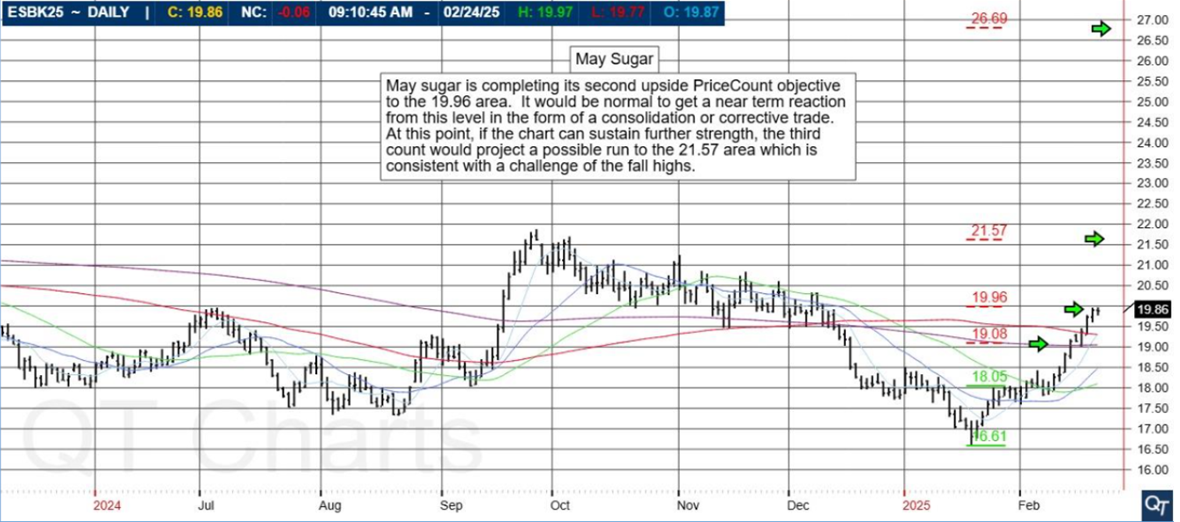
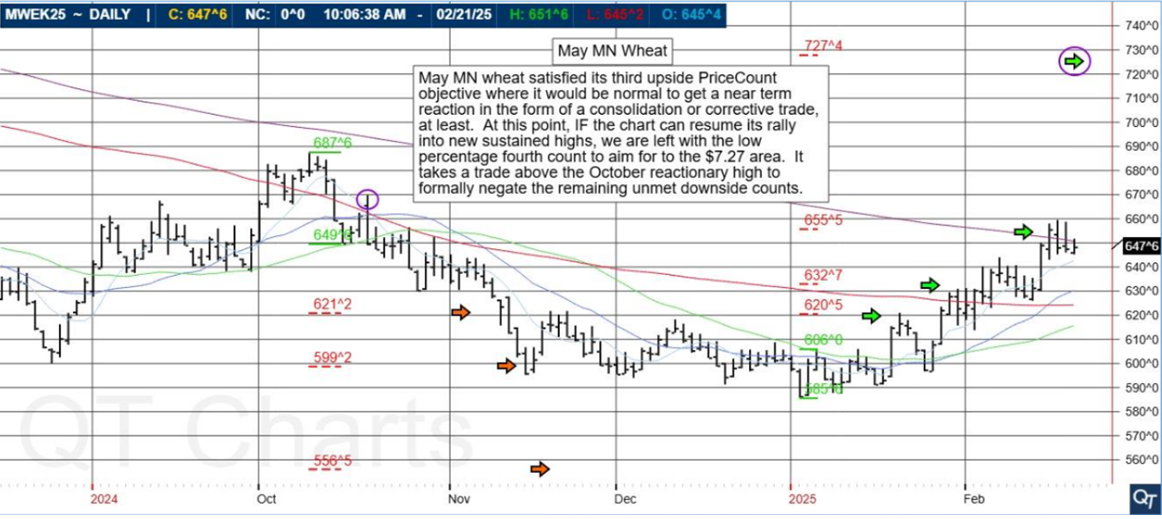
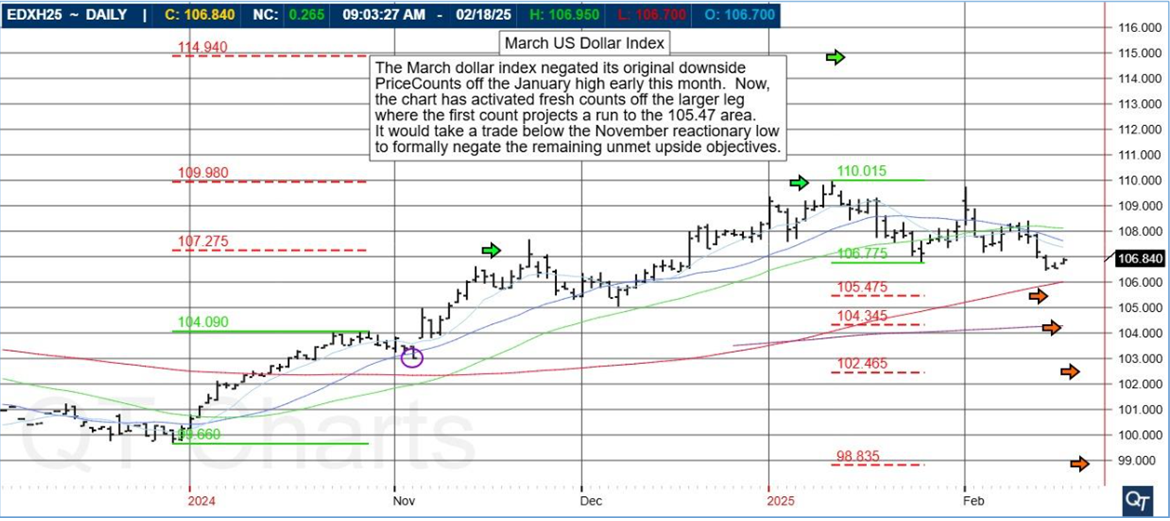
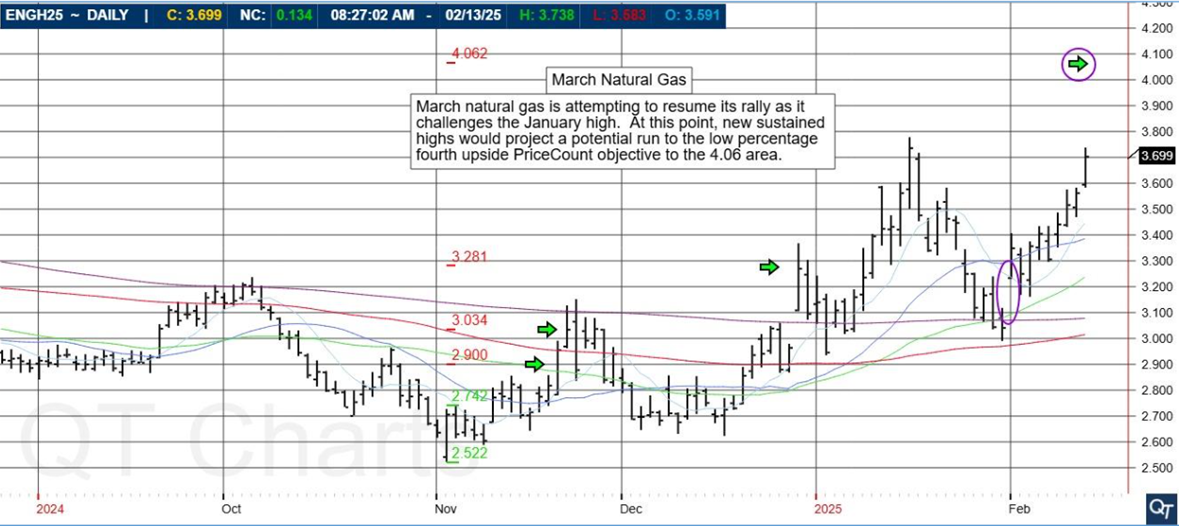
    December hogs satisfied their first upside PriceCount objective early this month and have consolidated their trade. At this point, the second count would project a possible run to the 82.15 area IF you can resume the rally and break out above resistance at the April high.


    PriceCounts – Not about where we’ve been , but where we might be going next!

    e01a8e3a 0793 4347 9e7c d95ceb169dee

The PriceCount study is a tool that can help to project the distance of a move in price. The counts are not intended to be an ‘exact’ science but rather offer a target area for the four objectives which are based off the first leg of a move with each subsequent count having a smaller percentage of being achieved. It is normal for the chart to react by correcting or consolidating at an objective and then either resuming its move or reversing trend. Best utilized in conjunction with other technical tools, PriceCounts offer one more way to analyze charts and help to manage your positions and risk. Learn more at www.qtchartoftheday.com
Trading in futures, options, securities, derivatives or OTC products entails significant risks which must be understood prior to trading and may not be appropriate for all investors. Past performance of actual trades or strategies is not necessarily indicative of future results.

   Broker’s Trading System of the Week

With algorithmic trading systems becoming more prevalent in portfolio diversification, the following system has been selected as the broker’s choice for this month.

MVA 998 RTY 208

PRODUCT

RTY – Mini Russell 2000


SYSTEM TYPE

Day Trading


Recommended Cannon Trading Starting Capital

$10,000


COST

USD 80 / monthly


Get Started

Learn More

9192efe7 f93a 408e 80ff 3e99390e4cb8

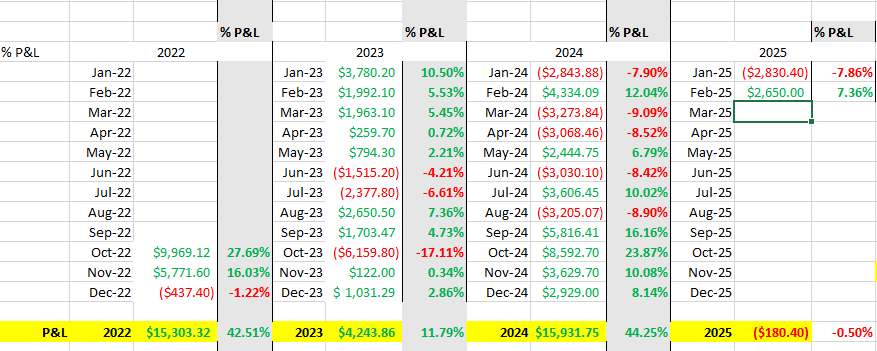
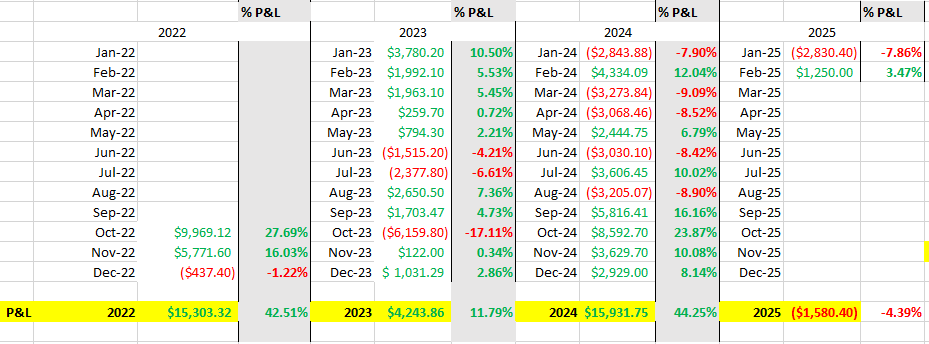
The performance shown above is hypothetical in that the chart represents returns in a model account. The model account rises or falls by the average single contract profit and loss achieved by clients trading actual money pursuant to the listed system’s trading signals on the appropriate dates (client fills), or if no actual client profit or loss available – by the hypothetical single contract profit and loss of trades generated by the system’s trading signals on that day in real time (real‐time) less slippage, or if no real time profit or loss available – by the hypothetical single contract profit and loss of trades generated by running the system logic backwards on back adjusted data. Please read full disclaimer HERE.
Would you like to receive daily support & resistance levels?
Yes
S
No
S

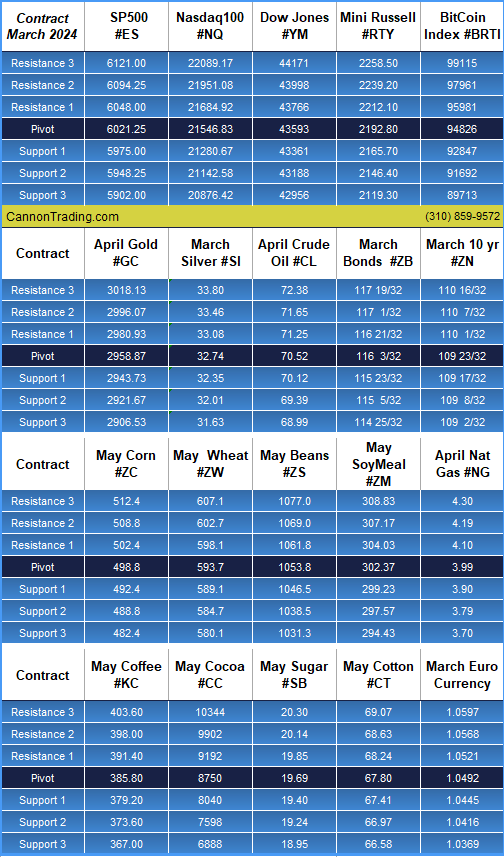
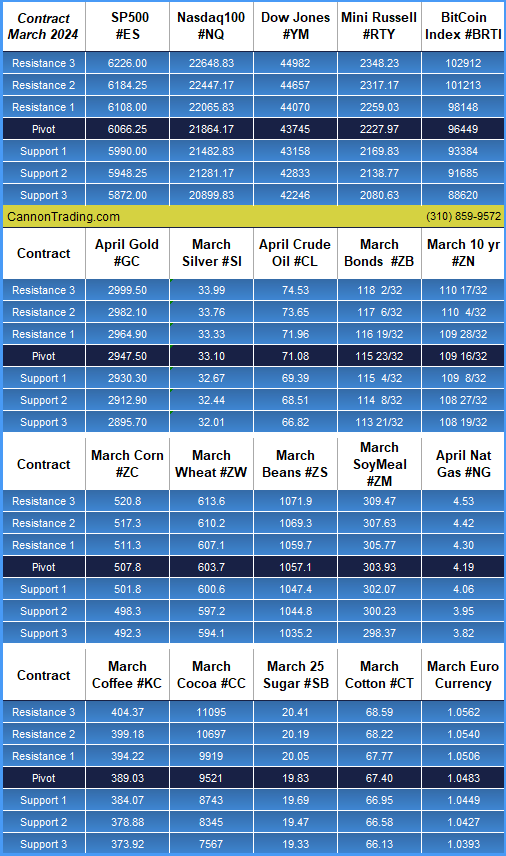
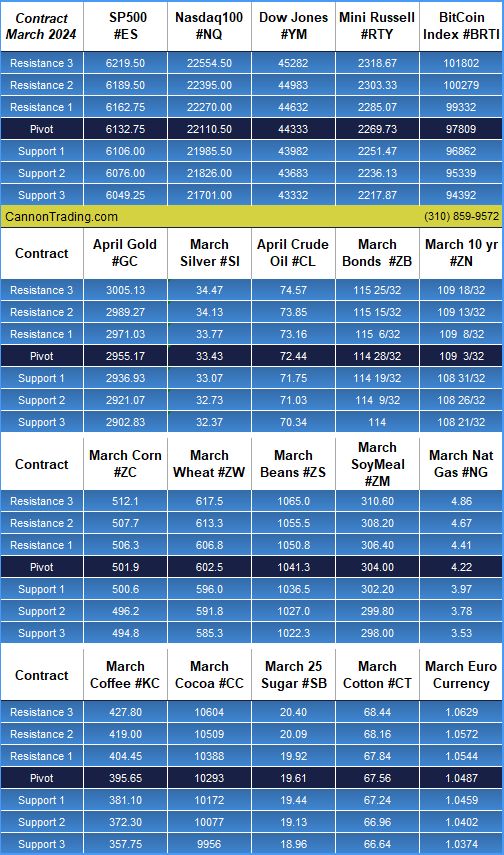
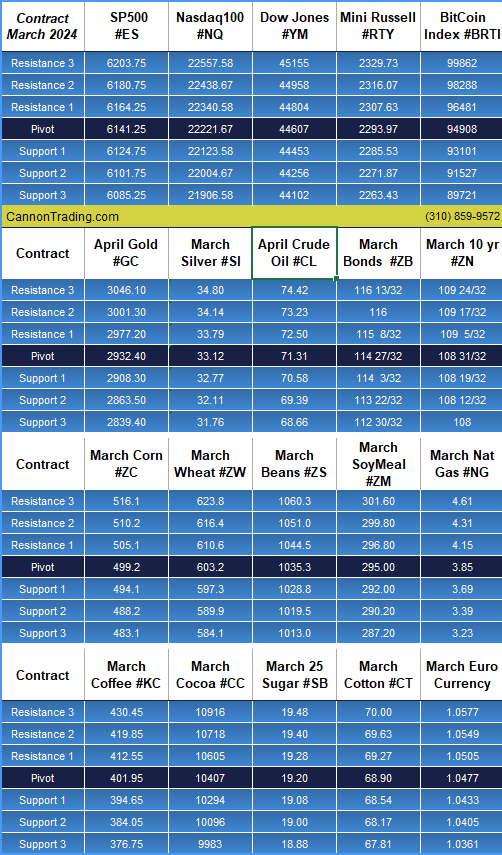
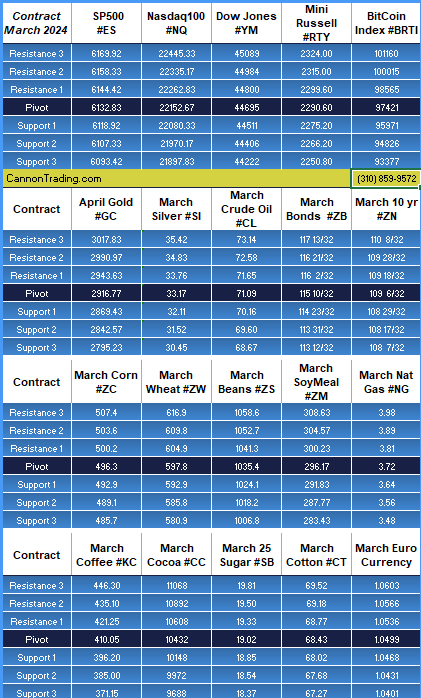
Daily Levels for October 21st, 2024

6b7189b7 de1c 4948 84c1 3cfece6c1954

Weekly Levels for the week of October 21st, 2024

4cbc5539 f55f 49b2 8740 bbceade4e60e


bf9b3e0d 9c23 44e8 980c a8c01bfbe2cf

Trading Reports for Next Week

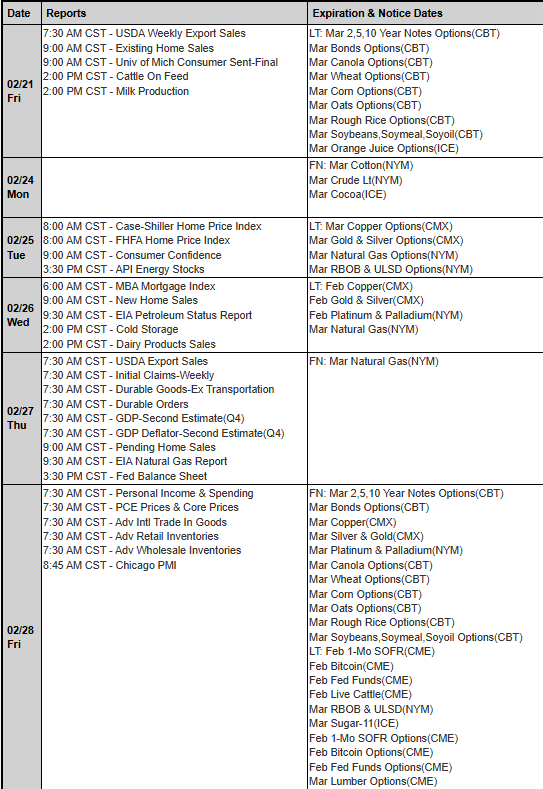
First Notice (FN), Last trading (LT) Days for the Week:
3f492ad8 7aae 4b88 8a16 73e5bfa0972a

Improve Your Trading Skills

Get access to proprietary indicators and trading methods, consult with an experienced broker at 1-800-454-9572.

Explore trading methods. Register Here

* This is not a solicitation of any order to buy or sell, but a current market view provided by Cannon Trading Inc. Any statement of facts here in contained are derived from sources believed to be reliable, but are not guaranteed as to accuracy, nor they purport to be complete. No responsibility is assumed with respect to any such statement or with respect to any expression of opinion herein contained. Readers are urged to exercise their own judgement in trading.

Gold Futures Hit All-Time Highs: Margin Updates and Chart Review

Join our Private Facebook group

Subscribe to our YouTube Channel

Listen to our podcast: Subscribe on AppleSpotify, Amazon, or wherever you listen to podcasts!

Gold Futures

All time highs on gold futures today!

See both daily and weekly charts below.

On a different note, as the CME raises margins, the day trading margins may be higher as well.

Depending on the trading platform you are using, your day trading margins may be a percent of the overnight margins. If you are using the E-Futures International, then your day trading margins between 7:45 AM central and 3:30 PM central are as below:

0e7bab50 b9f3 4646 8319 513832198a9e
Any questions, please reach out to your broker.

Gold Daily and Weekly Charts below for review:

cd76fe04 1943 431a b57b c6064909cdb0
1de04609 46a5 4566 8910 c4a18f4ddeb9
Any questions, please reach out to your broker.


stars
 

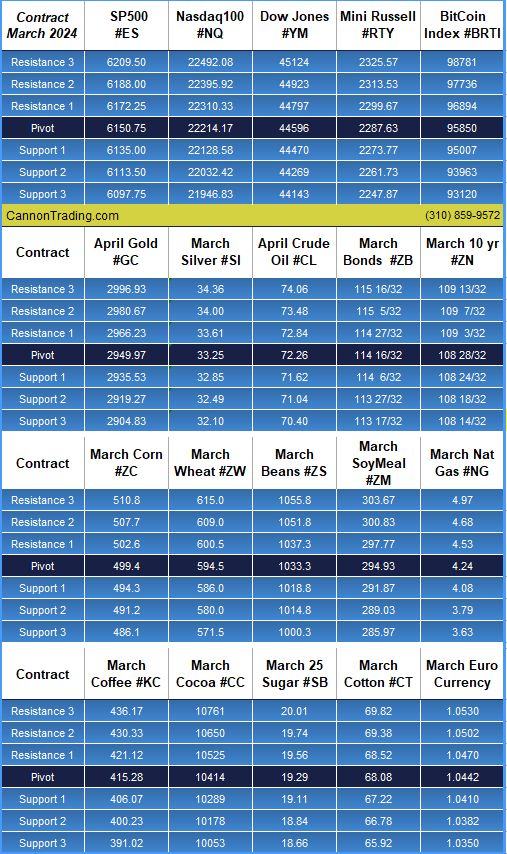
Daily Levels for Oct. 18th 2024

2a7873ec b985 4c8f a624 5891ad69c4ec

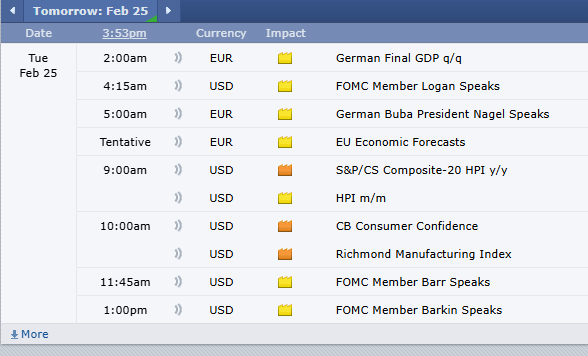
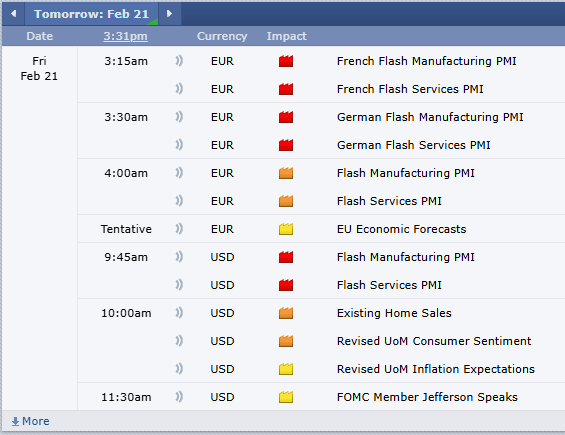
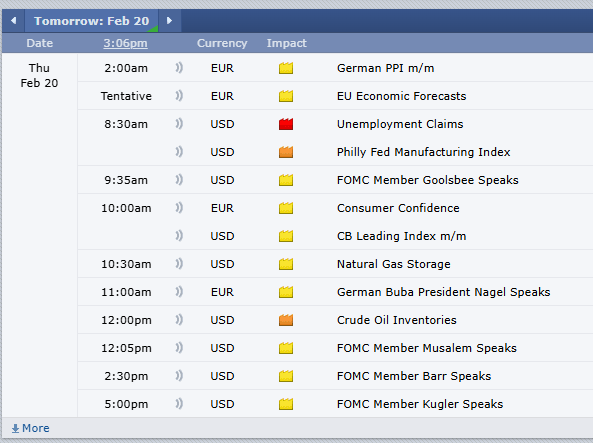
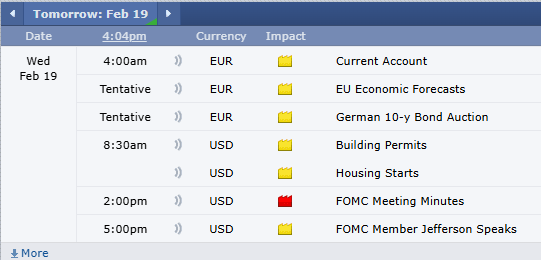
Economic Reports
provided by:ForexFactory.com
All times are Eastern Time ( New York)
81f8a3d4 6971 4c2f a701 d3644685743f
Good Trading!
About: Cannon Trading is an independent futures brokerage firm established in 1988 in Los Angeles. Our mission is to provide reliable service along with the latest technological advances and choices while keeping our clients informed and educated in the field of futures and commodities trading.
Trading Futures, Options on Futures, and retail off-exchange foreign currency transactions involves substantial risk of loss and is not suitable for all investors. You should carefully consider whether trading is suitable for you in light of your circumstances, knowledge, and financial resources. You may lose all or more of your initial investment. Opinions, market data, and recommendations are subject to change at any time.
Contact
S
Cannon Trading Company
12100 Wilshire Boulevard
Suite 1640
Los Angeles, CA 90025
(800) 454-9572
Follow Us
Facebook  Twitter  Instagram
Visit Our Website


Quick Videos on Trading Techniques + Futures Trading Levels for 9.25

Get Real Time updates and more by joining our Private Facebook Group! Subscribe to our YouTube Channel Listen to our Market Recap Podcasts on Apple Podcasts
C37
 

Trading Videos

Instant Viewing

Watch a series of short videos, where our VP, Ilan Levy-Mayer shares his personal preferences and opinions on different trading topics.

  • Ever wondered when to exit a trade? Take a look at what Ilan has to share on Bollinger Bands and a study called PARABOLICS
  • Some common uses you can make of support and resistance levels.
  • Filter out the noise with range bar charts
  • “Price Confirmation”

WATCH NOW

 
stars
     

Daily Levels for September 26, 2024

1088a659 e5de 42bc 8e24 66ef19a6e359 Economic Reports provided by: ForexFactory.com All times are Eastern Time ( New York)
f631f965 3216 44b0 a79b df7a62871290

Improve Your Trading Skills

Get access to proprietary indicators and trading methods, consult with an experienced broker at 1-800-454-9572. Explore trading methods. Register Here
3b644da2 2bee 4d39 8d98 5208a20bec39
* This is not a solicitation of any order to buy or sell, but a current market view provided by Cannon Trading Inc. Any statement of facts here in contained are derived from sources believed to be reliable, but are not guaranteed as to accuracy, nor they purport to be complete. No responsibility is assumed with respect to any such statement or with respect to any expression of opinion herein contained. Readers are urged to exercise their own judgement in trading.   #Equities, #Consolidation phase, #Interest rates, #Precious metals, #Gold, #Silver, #US Dollar, #Crude oil prices, #HurricaneHelene, #Middle East tensions, #Chinese stimulus, #Redbook US Retail Sales, #Case Schiller US Metro-Area Home Prices, #Richmond Fed Manufacturing Index, #Service Sector Index, #Consumer Confidence, #New Home Sales, #Micron Technology

Weekly Newsletter: FOMC next Week, Bonds Outlook & Trading Levels for April 29th

Get Real Time updates and more by joining our Private Facebook Group!
Subscribe to our YouTube Channel

C47

Cannon Futures Weekly Letter Issue # 1191

In this issue:
  • Important Notices – FOMC & NFP Next Week
  • Futures 101 – Understanding Volume
  • Hot Market of the Week – June Bonds
  • Broker’s Trading System of the Week – ES intraday System
  • Trading Levels for Next Week
  • Trading Reports for Next Week


Important Notices – Next Week Highlights:

    • FOMC Rate Announcement Wed.
    • Heavy Earnings, AMZN and AMD Tues, AAPL Thur. all after the close
    • Heavy Data, Chicago PMI, Consumer Confidence, Construction Spending, ISM Manufacturing PMI, Jobless Claims.
    • NON FARM Payrolls to cap off the week on Fri. , preopening


Futures 101 : Understanding VOLUME

Volume is reported for all futures contracts. It is calculated by counting the number of contracts that have been bought and sold over a given time. You can track volume using different time intervals like daily or intraday.
When a futures contract is traded, whether bought or sold, it counts towards volume for that contract.
For example, a trader closes a short position in the E-mini S&P 500 (ES) futures contract by buying one contract in the ES, so volume will increase by 1.
Traders often use and interpret the rise or decline of volume in a futures contract to help make trading decisions.
Volume can give important information to traders such as:
  • Indicate the price levels at which traders are more or less interested in trading a futures contract
  • During the roll, indicate to traders when to switch to trading the front month futures contract as volume decreases in the expiring contract
  • Identify the times of day when a futures contract is most liquid
Price Levels
When volume changes as price of a futures contract moves towards certain levels, this can indicate to a trader that a change in direction may occur. Some traders may use this information to indicate whether to buy or sell at those key levels.
­Contract Roll
During the futures rollover, traders pay attention to the contract that is taking the higher levels of volume. Traders use this information to determine when to start trading the next month contract. As volume decreases in the expiring contract, trading will shift to the next available month contract.
For example, say the June ES (E-mini S&P 500) futures contract is about to expire and September will become the new front month. On the Thursday of rollover week, watch how the June contract starts to lose volume and the September contract begins to pick up volume. When the September contract has more volume than the June contract, it is time to switch to the September contract.
Active Periods
Traders typically prefer higher volume times to trade, as it means that more traders are actively interested in buying and selling. When volume is high, the bid-ask spread is typically smaller, orders are filled faster and less gaps may exist between ticks.
For example, markets can have lower volume between the hours of 12:00 p.m.-2:00 p.m. ET, before major economic releases; conversely, market often see higher volume around the open and close of the trading day.
Traders also can look at average daily volume over a longer time period, such as a few weeks or months, to see if the markets currently are in a lower or higher volume than is typical.
Summary
What volume can’t show however, is whether traders are buying or selling, or opening or closing a position.
For example, if the ES contract is trading at 2375 and suddenly pushes down to 2360 while volume increases, the volume that comes into the market could be from traders opening new long positions at key levels of support. That could indicate a bullish sentiment. Volume also can be generated by liquidation of exiting long positions or opening of new short positions, a possible bearish indication.
A spike in volume at 2360 doesn’t necessarily mean that buyers are coming into the market and that the price will bounce.
Volume data is readily available for each futures contract and for the market as a whole. Although traders may use volume in different ways to interpret how to trade, volume can be an important factor to help inform your trading decisions.


stars

3b644da2 2bee 4d39 8d98 5208a20bec39


  • Hot Market of the Week – June Bonds
Hot market of the week is provided by QT Market Center, A Swiss army knife charting package that’s not just for Hedgers, Cooperatives and Farmers alike but also for Spread traders, Swing traders and shorter time frame application for intraday traders with a unique proprietary indicator that can be applied to your specific trading needs.
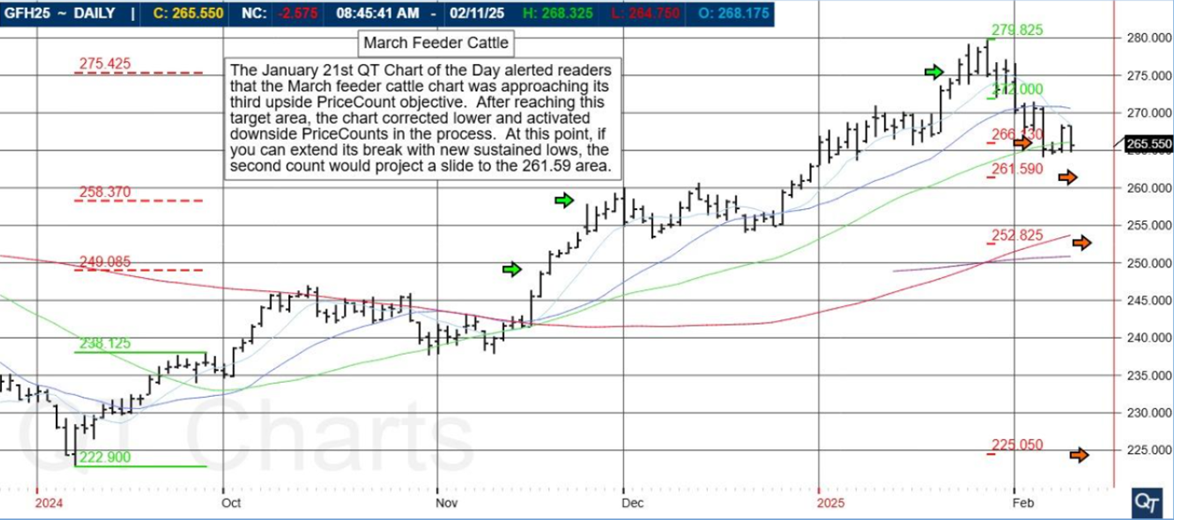
June 30 Year T-Bonds
The June 30 Year T-Bond break found temporary stability at its second downside PriceCount objective recently. Now, the chart has resumed its slide into new lows which, if sustained, would project a run to the third count in the 109^20 area.
PriceCounts – Not about where we’ve been , but where we might be going next!
e705ddd3 93f1 4833 80e3 d1e808fbc117
The PriceCount study is a tool that can help to project the distance of a move in price. The counts are not intended to be an ‘exact’ science but rather offer a target area for the four objectives which are based off the first leg of a move with each subsequent count having a smaller percentage of being achieved. It is normal for the chart to react by correcting or consolidating at an objective and then either resuming its move or reversing trend. Best utilized in conjunction with other technical tools, PriceCounts offer one more way to analyze charts and help to manage your positions and risk. Learn more at www.qtchartoftheday.com
Trading in futures, options, securities, derivatives or OTC products entails significant risks which must be understood prior to trading and may not be appropriate for all investors. Past performance of actual trades or strategies is not necessarily indicative of future results.
  • Broker’s Trading System of the Week

With algorithmic trading systems becoming more prevalent in portfolio diversification, the following system has been selected as the broker’s choice for this month.
PRODUCT
SYSTEM TYPE
Intraday
COST
USD 110 / monthly
Recommended Cannon Trading Starting Capital
$10,000
a5fd1228 3ba8 42c5 a40d c3e46544bdd0
The performance shown above is hypothetical in that the chart represents returns in a model account. The model account rises or falls by the average single contract profit and loss achieved by clients trading actual money pursuant to the listed system’s trading signals on the appropriate dates (client fills), or if no actual client profit or loss available – by the hypothetical single contract profit and loss of trades generated by the system’s trading signals on that day in real time (real‐time) less slippage, or if no real time profit or loss available – by the hypothetical single contract profit and loss of trades generated by running the system logic backwards on back adjusted data. Please read full disclaimer HERE.
Would you like to receive daily support & resistance levels?
Yes
S
No
S


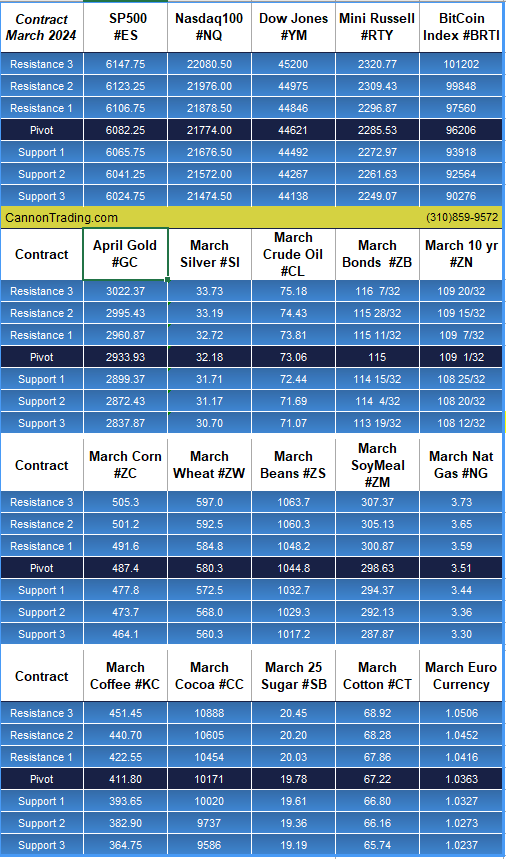
Daily Levels for April 29th 2024

eb118b97 a50d 48fb ab4a efafa6ff5968

Trading Reports for Next Week

d398c77d 24dc 450b 92fb ef3ef27b13d9
d259df9c bf07 4429 9fa8 d12b53c37804
First Notice (FN), Last trading (LT) Days for the Week:
6d1a7821 c606 4107 83ef 6fa197eb7433

Improve Your Trading Skills

Get access to proprietary indicators and trading methods, consult with an experienced broker at 1-800-454-9572.

Explore trading methods. Register Here

* This is not a solicitation of any order to buy or sell, but a current market view provided by Cannon Trading Inc. Any statement of facts here in contained are derived from sources believed to be reliable, but are not guaranteed as to accuracy, nor they purport to be complete. No responsibility is assumed with respect to any such statement or with respect to any expression of opinion herein contained. Readers are urged to exercise their own judgement in trading.
GDP Tomorrow, Earnings Season in Full Play  + Levels for April 25th

Get Real Time updates and more by joining our Private Facebook Group!
Subscribe to our YouTube Channel


C30


A few tips for tomorrow:

  • If you are trading stock index futures, note price action has been VERY choppy during the day session as most earnings come out after the close…
  • Coffee and Coca volatility is as high as I have seen in recent months. Large intraday and overnight moves in both, as much as +/- 8% per day!
  • We have GDP and home sales tomorrow.
  • Big pullback in both silver and gold and the key question is: Was this profit taking/ deflation of geo political fear and GOOD entry to the long side? OR…is this the near term top for both markets??
  • Corn daily chart for your review below.

91d5fe9f befc 4c02 b5d6 4fe775ba7b0e


stars

e35cb555 9ff3 4f00 9fe8 0655b28fbd90

Daily Levels for April 25th, 2024

c966fcd9 e95b 47a3 a4d4 aa6f33599e0a

thumbnail?url=http%3A%2F%2Fi.ytimg.com%2Fvi%2FJnHAMUGdNoM%2Fhqdefault

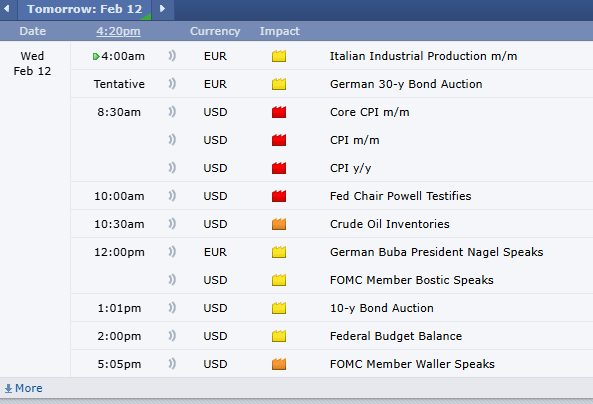
Economic Reports
provided by: ForexFactory.com
All times are Eastern Time ( New York)
7d0dfe51 9084 4e90 9e70 216bff610617

Improve Your Trading Skills

Get access to proprietary indicators and trading methods, consult with an experienced broker at 1-800-454-9572.

Explore trading methods. Register Here

3b644da2 2bee 4d39 8d98 5208a20bec39

* This is not a solicitation of any order to buy or sell, but a current market view provided by Cannon Trading Inc. Any statement of facts here in contained are derived from sources believed to be reliable, but are not guaranteed as to accuracy, nor they purport to be complete. No responsibility is assumed with respect to any such statement or with respect to any expression of opinion herein contained. Readers are urged to exercise their own judgement in trading.

Bullet Points, Highlights, Announcements  + Levels for April 24th

Get Real Time updates and more by joining our Private Facebook Group!
Subscribe to our YouTube Channel


C37

Bullet Points, Highlights, Announcements   

by Mark O’Brien, Senior Broker

General:  


Futures traders with positions in deliverable futures contracts keep an eye on the calendar for important dates at the end of the month. First Notice Day (FND) and Last Trading Day (LTD) for many futures contracts are close at hand. Make sure you steer safely clear of receiving delivery notices for physical commodities (FND), or greatly reduced liquidity (LTD). If you’re unsure, contact your Cannon Trading Co. broker.


The economic calendar for the rest of the week is scarce with Thursday’s Q1 GDP report taking center stage.


Prospects for a fed rate cut announcement at the Fed’s 4/30-5/1 meeting, as well as its mid-June meeting have all but evaporated and many Fed watchers expect the central bank to keep its “higher for longer” mantra in place for most and possibly all of 2024.


Worries over a wider Middle East conflict have subsided and traders are discounting the risk of further escalations. Case in point, June gold lost ±67 per ounce (±2%) yesterday after posting its latest all-time record high close of $2,413.80/ounce on Friday. Iran downplayed Israel’s retaliatory drone strike against it, in what appeared to be a move aimed at averting regional escalation.


Energies: 


  • The ±$2.50/barrel selloff in May crude oil and the ±¢9.75/gallon May RBOB gasoline futures last week likely signaled the markets do not see an Iranian supply disruption in the near future, so the markets will be given to focusing on global energy demand going forward

47489e7c 5065 45b3 8e85 55c7ad3a0f3e


Softs:  


May Cocoa futures declined sharply yesterday and today, down nearly $1,300/ton (a $13,000 per contract move) marking its worst two-day slump since February. This after a 3-day / Wed.-Fri. rally of $1,635/ton to its all-time record high close of 11,878/ton on Friday. ICE U.S. has set the initial margin requirement to $11,260 per contract.

stars

e35cb555 9ff3 4f00 9fe8 0655b28fbd90

Daily Levels for April 24th, 2024

b8b30c15 9c5e 43f1 858e 25ebcd94928e

thumbnail?url=http%3A%2F%2Fi.ytimg.com%2Fvi%2FJnHAMUGdNoM%2Fhqdefault

Economic Reports
provided by: ForexFactory.com
All times are Eastern Time ( New York)
f4aacb3b d0e3 45f4 82bf 45cec9587768

Improve Your Trading Skills

Get access to proprietary indicators and trading methods, consult with an experienced broker at 1-800-454-9572.

Explore trading methods. Register Here

3b644da2 2bee 4d39 8d98 5208a20bec39

* This is not a solicitation of any order to buy or sell, but a current market view provided by Cannon Trading Inc. Any statement of facts here in contained are derived from sources believed to be reliable, but are not guaranteed as to accuracy, nor they purport to be complete. No responsibility is assumed with respect to any such statement or with respect to any expression of opinion herein contained. Readers are urged to exercise their own judgement in trading.

Notes from a Day Trader + Levels for April 23rd

Get Real Time updates and more by joining our Private Facebook Group!
Subscribe to our YouTube Channel


C15


The Week Ahead and Controlling your Emotions

by John Thorpe, Senior Broker

No Fed speakers this week, it is the blackout period in advance of next weeks FED meeting and rates decision.

Look for earnings to move the market this week  MSFT, GOOG, META, XOM, Visa, TSLA

Last week, my colleague posted an article about FOMO just about the same time a client of mine was battling his own fear of missing out.

Of course I asked my client if , after redacting account information, he wouldn’t mind if I shared his “journal Entry” with everyone.


John,

I’ll give you an explanation of what happened yesterday. After we talked I left for my job. I returned at 2:30 and saw that I missed all the “short” activity yesterday.

Disappointed, I made the mistake of trying to catch up . I had several positive trades and then several negative trades that put me in the negative for the day.

I was active in a “short” trade, sitting at my desk. I nodded off. I don’t know how long, but it must have been enough seconds that the price action had dramatically turned “long”. Unfortunately, I nodded off with my hand on my mouse. It seems that I touched the mouse and now I discovered that I had clicked a second contract. I was hoping to recover the $1800 loss but it was too late.

1. I went back to practice simulation. First on the 15th from 9 AM and with 3 clicks I had made $2300. Then stopped while ahead.

2. Today I again started practice at 9 AM and within 2 hours made $530. Then stopped while ahead My mistakes. What do I learn from this:

1. Don’t fall asleep while trading.

2. Don’t fall asleep with your finger hovering over the mouse.

3. Stop when you’re ahead and don’t try to make money on the short price action movements.

4. Reminding again to only trade with the trend.

One of the most common pitfalls of traders in Futures Trading is the fear of missing out (FOMO).

Understanding FOMO in Trading:

  • FOMO, or the fear of missing out, is a powerful emotion that can cloud judgment and lead to impulsive decisions.
  • Recognizing the signs of FOMO is crucial for traders to maintain a disciplined approach to their strategies.

The Role of Emotions in Trading:

  • Emotions play a significant role in trading, influencing decisions and reactions to market movements.
  • Acknowledging emotions like greed, fear, and excitement is the first step towards effective emotional control.

Strategies for Controlling Emotions: 

1/ Establishing a Trading Plan:

Having a well-defined trading plan helps set clear goals and guidelines, reducing the influence of emotions.

2/ Setting Realistic Expectations:

Realistic expectations prevent disappointment and impulsive actions based on unrealistic goals.

3/ Utilizing Risk Management:

Implementing risk management strategies ensures that trades are within acceptable risk limits.

4/ Taking Breaks:

Stepping away from the screen during intense market movements can provide a fresh perspective and prevent emotional reactions.

Mindfulness Techniques:

  • Incorporating mindfulness practices, such as deep breathing or meditation, can help traders stay focused and calm during stressful trading situations.

Learn from Past Trades:

  • Analyzing past trades, especially those influenced by emotions, provides valuable insights for improvement.
  • Keeping a trading journal helps identify patterns in emotional responses and areas for growth.


d4713afd abe8 4cf1 9326 6dc2eb9a0db2

stars

e35cb555 9ff3 4f00 9fe8 0655b28fbd90

Daily Levels for April 23rd, 2024

edb9b0f9 5402 4319 a041 f50b4c97188e

thumbnail?url=http%3A%2F%2Fi.ytimg.com%2Fvi%2FJnHAMUGdNoM%2Fhqdefault

Economic Reports
provided by: ForexFactory.com
All times are Eastern Time ( New York)
76e28bf7 7b35 4327 b631 29adba0cf3b5

Improve Your Trading Skills

Get access to proprietary indicators and trading methods, consult with an experienced broker at 1-800-454-9572.

Explore trading methods. Register Here

3b644da2 2bee 4d39 8d98 5208a20bec39

* This is not a solicitation of any order to buy or sell, but a current market view provided by Cannon Trading Inc. Any statement of facts here in contained are derived from sources believed to be reliable, but are not guaranteed as to accuracy, nor they purport to be complete. No responsibility is assumed with respect to any such statement or with respect to any expression of opinion herein contained. Readers are urged to exercise their own judgement in trading.

Coffee Outlook, Beige Book and Crude Oil Numbers + Levels for April 17th

Get Real Time updates and more by joining our Private Facebook Group!
Subscribe to our YouTube Channel


C33


Powell spoke and stock index futures traded in a volatile, zig zag type of trading most of the day unable to break one way or the other and closing near the unchange.

On the daily chart, both the SP and NASDAQ are noticing more pressure to the downside.

One of the keys for day Traders is to try and establish early on what type of day trading environment they are in.

Is this going to be a trend day it is this going to be a choppy low volatility trading day? is the day unfolding has a potential to be a volatile two-sided type of trading day?

Being aware of the top of trading day that is unfolding in front of you can help you decide which strategies to apply on that trading day.

Knowing what reports are coming out. the general direction of the long term charts can help you.

Different strategies will work better in different type of trading environments.

On a different note, softs, i.e. Cocoa, cotton, Coffee , Sugar, OJ are experiencing much higher volatility than historical norms. Cocoa just dropped close to 8% today after trading above the historical mark of $100 per metric ton.

below you will see a daily chart of Coffee futures and possible future direction.


62d19d5f caa4 41f4 9c2e dacb47995f39


stars

e35cb555 9ff3 4f00 9fe8 0655b28fbd90

Daily Levels for April 17th, 2024

535aeb7d 56cc 4a29 baec 89cf769d0efe

thumbnail?url=http%3A%2F%2Fi.ytimg.com%2Fvi%2FJnHAMUGdNoM%2Fhqdefault

Economic Reports
provided by: ForexFactory.com
All times are Eastern Time ( New York)
611bf28a 191a 4e89 bb29 ea18ac3b07a0

Improve Your Trading Skills

Get access to proprietary indicators and trading methods, consult with an experienced broker at 1-800-454-9572.

Explore trading methods. Register Here

3b644da2 2bee 4d39 8d98 5208a20bec39

* This is not a solicitation of any order to buy or sell, but a current market view provided by Cannon Trading Inc. Any statement of facts here in contained are derived from sources believed to be reliable, but are not guaranteed as to accuracy, nor they purport to be complete. No responsibility is assumed with respect to any such statement or with respect to any expression of opinion herein contained. Readers are urged to exercise their own judgement in trading.

How Important is Hedging for Farmers? + Levels for April 16th

Get Real Time updates and more by joining our Private Facebook Group!
Subscribe to our YouTube Channel


C42


This week we will see a number of fed speakers,

Tomorrow

Live @ 12:15CDT Link to Discussion With Jerome Powell we are providing this link for those that will watch the market and listen simultaneously


A bit of a departure from the usual Monday blog bites. The planting season in the northern hemisphere is under way so a quick review of the importance of Hedging follows:

How Important is Hedging for Farmers?

For farmers, especially those involved in producing commodities like wheat, corn, soybeans, and livestock, the prices of these products can fluctuate significantly due to various factors such as weather conditions, global demand, geopolitical events, and market speculation. These fluctuations can directly impact a farmer’s profitability and financial stability. Here’s why hedging is so important:

  • Price Stability: Futures trading allows farmers to lock in prices for their produce or livestock at predetermined levels, providing them with a sense of stability and predictability in their revenue streams.
  • Risk Management: By hedging, farmers can protect themselves against adverse price movements. For example, if a farmer expects the price of corn to decrease before their harvest, they can take a short position in corn futures to offset potential losses.
  • Budgeting and Planning: Knowing the approximate revenue from their crops or livestock enables farmers to budget effectively, plan future investments, and manage expenses with more confidence.
  • Access to Capital: Having predictable revenue streams through hedging can make it easier for farmers to secure financing from lenders as they demonstrate a more stable financial outlook.
  • Competitive Advantage: Farmers who hedge can often compete more effectively in the market by offering consistent pricing to buyers, thereby securing long-term contracts and relationships.
  • Futures trading serves as a powerful tool for farmers to manage price risk and ensure a more stable financial outlook. By hedging their crops like wheat, corn, soybeans, and livestock, farmers can mitigate the impact of market volatility, plan their budgets effectively, and compete more confidently in the agricultural sector. Understanding and implementing various hedging strategies empower farmers to navigate unpredictable market conditions while safeguarding their profitability.


stars

e35cb555 9ff3 4f00 9fe8 0655b28fbd90

Daily Levels for April 16th, 2024

a238bad2 46e6 4ed7 83ee e36679069fb8

thumbnail?url=http%3A%2F%2Fi.ytimg.com%2Fvi%2FJnHAMUGdNoM%2Fhqdefault

Economic Reports
provided by: ForexFactory.com
All times are Eastern Time ( New York)
96cb8e6d 9394 4713 8637 00f35f70a350

Improve Your Trading Skills

Get access to proprietary indicators and trading methods, consult with an experienced broker at 1-800-454-9572.

Explore trading methods. Register Here

3b644da2 2bee 4d39 8d98 5208a20bec39

* This is not a solicitation of any order to buy or sell, but a current market view provided by Cannon Trading Inc. Any statement of facts here in contained are derived from sources believed to be reliable, but are not guaranteed as to accuracy, nor they purport to be complete. No responsibility is assumed with respect to any such statement or with respect to any expression of opinion herein contained. Readers are urged to exercise their own judgement in trading.

Weekly Newsletter: May Crude Oil on the Move? & Trading Levels for April 15th

Get Real Time updates and more by joining our Private Facebook Group!
Subscribe to our YouTube Channel

C2

Cannon Futures Weekly Letter Issue # 1189

In this issue:
  •  Important Notices – Earnings, Gold all time Highs & More
  • Trading Resource of the Week – Trading Videos
  • Hot Market of the Week – May Crude Oil
  • Broker’s Trading System of the Week – NQ Swing System
  • Trading Levels for Next Week
  • Trading Reports for Next Week


Important Notices –

    • Earnings Tues- JNJ,BAC ,Morgan Stanley MS, Wed. -ABT, Thu.- AXP, NFLX
    • Econ Data  Mon- Retail Sales , Tues Housing Starts, Bldg Permits , Thu. Jobless claims, Existing home sales..
    • quiet on the fed speaker front
    • No Congressional action to speak of
    • The U.S. dollar index this morning forged another higher high and reached the highest level since early November.
    • With the June gold futures contract breaking a string of new all-time highs (eight straight days) yesterday, the market is facing the first definitive corrective environment since the middle of last month.
    • The bearish sentiment in financial futures (30-yr. T-bond, 10-yr. T-note) is escalating dramatically and could become overdone soon with some chatter in the market suggesting there might not be a single rate cuts this year.
    • Crude oil may see support this week from renewed talk of an imminent Iranian retaliation (as per U.S. officials) for the Israeli attack in Syria. U.S. officials have openly suggested Iranian retaliation against Israel is likely soon. Fears of disrupted supply remain front and center.


Trading Resource of the Week: Trading Videos, Instant Viewing

Watch a series of short videos, where our VP, Ilan Levy-Mayer shares his personal preferences and opinions on different trading topics.
·    Ever wondered when to exit a trade? Take a look at what Ilan has to share on Bollinger Bands and a study called PARABOLICS
·    Some common uses you can make of support and resistance levels.
·    Filter out the noise with range bar charts
·    “Price Confirmation”


stars

3b644da2 2bee 4d39 8d98 5208a20bec39


  • Hot Market of the Week – May Crude Oil
Hot market of the week is provided by QT Market Center, A Swiss army knife charting package that’s not just for Hedgers, Cooperatives and Farmers alike but also for Spread traders, Swing traders and shorter time frame application for intraday traders with a unique proprietary indicator that can be applied to your specific trading needs.
The March 20th Chart of the Day highlighted May crude oil had completed its first upside PriceCount objective. Now, the chart is consolidating after satisfying its second upside PriceCount objective. A this point, IF the chart can sustain further gains, the third count would project a possible run to the 94.82 area.
PriceCounts – Not about where we’ve been , but where we might be going next!
8b794a41 1b6d 49e3 be59 0a99af03b890
The PriceCount study is a tool that can help to project the distance of a move in price. The counts are not intended to be an ‘exact’ science but rather offer a target area for the four objectives which are based off the first leg of a move with each subsequent count having a smaller percentage of being achieved. It is normal for the chart to react by correcting or consolidating at an objective and then either resuming its move or reversing trend. Best utilized in conjunction with other technical tools, PriceCounts offer one more way to analyze charts and help to manage your positions and risk. Learn more at www.qtchartoftheday.com
Trading in futures, options, securities, derivatives or OTC products entails significant risks which must be understood prior to trading and may not be appropriate for all investors. Past performance of actual trades or strategies is not necessarily indicative of future results.
  • Broker’s Trading System of the Week

With algorithmic trading systems becoming more prevalent in portfolio diversification, the following system has been selected as the broker’s choice for this month.
PRODUCT
SYSTEM TYPE
Swing
COST
USD 299 / monthly
Recommended Cannon Trading Starting Capital
$75,000
32655e40 466f 43ab ae59 5d633fcbf7c3
The performance shown above is hypothetical in that the chart represents returns in a model account. The model account rises or falls by the average single contract profit and loss achieved by clients trading actual money pursuant to the listed system’s trading signals on the appropriate dates (client fills), or if no actual client profit or loss available – by the hypothetical single contract profit and loss of trades generated by the system’s trading signals on that day in real time (real‐time) less slippage, or if no real time profit or loss available – by the hypothetical single contract profit and loss of trades generated by running the system logic backwards on back adjusted data. Please read full disclaimer HERE.
Would you like to receive daily support & resistance levels?
Yes
S
No
S


Daily Levels for April 15th 2024

771a1b3e a8b5 4c92 93ff 8af9b7ddc603

Trading Reports for Next Week

355e348f 486b 4680 a381 a80073d0f10f
d259df9c bf07 4429 9fa8 d12b53c37804
First Notice (FN), Last trading (LT) Days for the Week:
863255b9 3bfd 4269 bc70 e4613f026765

Improve Your Trading Skills

Get access to proprietary indicators and trading methods, consult with an experienced broker at 1-800-454-9572.

Explore trading methods. Register Here

* This is not a solicitation of any order to buy or sell, but a current market view provided by Cannon Trading Inc. Any statement of facts here in contained are derived from sources believed to be reliable, but are not guaranteed as to accuracy, nor they purport to be complete. No responsibility is assumed with respect to any such statement or with respect to any expression of opinion herein contained. Readers are urged to exercise their own judgement in trading.