Weekly Newsletter 1122: Volume Profile, Order Flow & Footprint Charts + Levels for November 7th

Cannon Futures Weekly Newsletter Issue # 1122


If you’re not living in Arizona, Hawaii or a few other U.S. territories, get ready to wave goodbye to Daylight Savings Time. This Sunday at 2:00 A.M., local time (that’s right, each time zone switches at a different time) set your clocks back one hour and welcome back to Standard Time.
International Traders please pay special attention and remember to adjust on your local time zone to the reflect current market hours.


Volume Profile, Order Flow & Footprint Charts

VolSys (Volumetrica Trading) is a professional trading platform which its main goal is the analysis of the volume profiles, time and sales, order flow and footprint all developed by a group of individual traders.
The trading platform has all you need for fast and convenient market evaluation – Adv. Time And Sales, Adv. Chart, Correlation Viewer and HFT algorithms tracking. Our platforms process the order flow data and display it in an innovative and intuitive way.
The Trading platform provides one-click chart and DOM trading in order to help scalper and day traders.
VolSys offers the most powerful indicators (Volume Profile, Order Flow Analyzer, Footpring etc) in order to understand the market movements through the volume analysis, while VolBook offers an innovative way to view the depth of the market.

Hot Market

Will the NQ and little brother MNQ test the October 13th lows?
FOMC and non Farm Payrolls are behind us but Election week is next….
Will it test?
Will it hold support?
If it breaks below what are the next levels?
Daily chart below for your review. CLICK FOR LARGER IMAGE.
#NQ, Stock Index Futures
Emini Nasdaq Futures Daily Continuation Chart


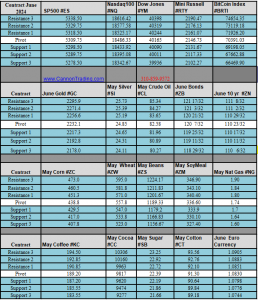
Futures Trading Levels

11-07-2022

Daily Levels
#goldfutures #sp500futures #crudeoilfutures # nasdaqfutures #dowfutures #futurestrading #futuresbrokers
SP500 #ES_FNasdaq100  #NQ_FDow Jones  #YM_FMini Russell #RTY_FBitCoin Index #BRTI SP500 Dec. Gold #GC_F Dec. Silver #SI_F Oct. Crude Oil #CL-F Dec. Bonds  #ZB_F Dec. 10 yr  #ZN_F Dec. Corn #ZC_F Dec.  Wheat #ZW_F Nov. Beans #ZS_F Dec. SoyMeal #ZM_F Oct. Nat Gas #NG_F Dec. Coffee #KC_F Dec. Cocoa #CC_F October Sugar #SB_F Dec. Cotton #CT_F Sept.  Euro Currency

Weekly Levels

fba96315 5356 432a b240 546c56f1febe


Reports, First Notice (FN), Last trading (LT) Days for the Week:

https://mrci.com

Date Reports/Expiration Notice Dates
d25f1f62 6756 414c a275 7546cc5779f1

This is not a solicitation of any order to buy or sell, but a current market view provided by Cannon Trading Inc. Any statement of facts herein contained are derived from sources believed to be reliable but are not guaranteed as to accuracy, nor they purport to be complete. No responsibility is assumed with respect to any such statement or with respect to any expression of opinion herein contained. Readers are urged to exercise their own judgment in trading

Pay Attention to the Road Signs While Trading + Trading Levels 10.27.2022

Get Real Time updates and more on our private FB group!

Pay Attention to the Road Signs…..

by Mark O’Brien, Senior Broker

Please be aware of the potential for the market you’re trading to react suddenly and forcefully in terms of price change. The most common catalyst is one typically staring right at you on your calendar of government and private reports. “Core” economic reports likely take center stage for stock indexes and treasuries. Currently that list includes measurements on the U.S. employment rate, inflation (CPI, PPI) business and consumer confidence and the like. Markets closely tied to the global economy like crude oil and its products, precious metals (gold & silver), industrial metals (copper, platinum) and currencies also react to U.S. reports. The U.S. is well on through its grain harvesting season when regional yields are being closely monitored and compiled to produce the totals that will be combined with the rest of the world’s production. At the same time, important southern hemisphere crops – particularly in South America – are just developing and estimates on their contribution to the world’s grain demands are being watched by the “big three” futures contracts on the CBOT: corn, wheat and soybeans.

Last but not least, earnings…..take a look at what happened yesterday on the NQ and MNQ right at the close of the cash market in stocks ( below is a 10 seconds chart – yes, TEN SECONDS…):
#MNQ
Micro NQ 10 seconds Chart


Please register for QT Market Center – Price Counts Forecasting & Professional Trading Tools on Nov 9, 2022 11:01 AM PST at:

https://attendee.gotowebinar.com/register/8624681785028468236

In this webinar you will learn and see live examples:


• Proprietary Price Counts Price Forecasting Tool

• Realtime Agricultural/Livestock/Ethanol-Energy News, Weather, Audio

• Daily Chart of the Day Subscription with Price Counts Price Forecasting Levels Included

• Realtime Live Streaming Agricultural & World Weather Audio Market Commentary Updates (accessible from Desktop, Tablet & Smartphone when out in the field)

• Access Current and 11+ years of Archived USDA Reports,

SPACE is LIMITED, so reserve your space now!

https://attendee.gotowebinar.com/register/8624681785028468236

Trading Futures, Options on Futures, and retail off-exchange foreign currency transactions involves substantial risk of loss and is not suitable for all investors.  You should carefully consider whether trading is suitable for you in light of your circumstances, knowledge, and financial resources. You may lose all or more of your initial investment. Opinions, market data, and recommendations are subject to change at any time when it comes to Futures Trading.

Futures Trading Levels

for 10-27-2022

#goldfutures #sp500futures #crudeoilfutures # nasdaqfutures #dowfutures #futurestrading #futuresbrokers
SP500 #ES_FNasdaq100  #NQ_FDow Jones  #YM_FMini Russell #RTY_FBitCoin Index #BRTI SP500 Dec. Gold #GC_F Dec. Silver #SI_F Oct. Crude Oil #CL-F Dec. Bonds  #ZB_F Dec. 10 yr  #ZN_F Dec. Corn #ZC_F Dec.  Wheat #ZW_F Nov. Beans #ZS_F Dec. SoyMeal #ZM_F Oct. Nat Gas #NG_F Dec. Coffee #KC_F Dec. Cocoa #CC_F October Sugar #SB_F Dec. Cotton #CT_F Sept.  Euro Currency


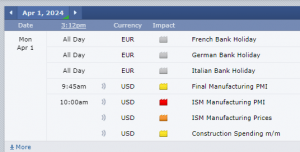
Economic Reports, Source: 

Forexfactory.com

89ce9038 abca 4851 80a2 fa74875b66bd

This is not a solicitation of any order to buy or sell, but a current market view provided by Cannon Trading Inc. Any statement of facts here in contained are derived from sources believed to be reliable, but are not guaranteed as to accuracy, nor they purport to be complete. No responsibility is assumed with respect to any such statement or with respect to any expression of opinion herein contained. Readers are urged to exercise their own judgement in trading.

In House Trading Indicators Free Trial + Futures Trading Levels 10.12.2022

Get Real Time updates and more on our private FB group!

Try our in-house created family of technical studies

  • Identify BUY and SELL signals
  • Plug into your own charts
  • Select your own market and timeframe

Free 3-week trial includes video tutorial and 23-page PDF e-book, explaining the studies’ approach and how to apply them to your trading.

Approach focuses on counter-trend and trend following price action and trade management.

Examples from Friday’s session using the E-mini SP500 chart below for your review. This is a 10,000 volume chart right before and after the NFP report.

As always, plan your trade and trade your plan. Please contact your broker or Cannon Trading with any questions.


Emini S&P 10,000 Volume Bar Chart
#ES #EminiFutures

The above chart is an example of mostly “good signals”. Like any other concept, this model has “failed signals” as well and it is always MUCH easier to explain and review any method looking back after the fact then when one is trading live money in real time. Please read disclaimer below as it is VERY appropriate.

HYPOTHETICAL PERFORMANCE RESULTS HAVE MANY INHERENT LIMITATIONS, SOME OF WHICH ARE DESCRIBED BELOW. NO REPRESENTATION IS BEING MADE THAT ANY ACCOUNT WILL OR IS LIKELY TO ACHIEVE PROFITS OR LOSSES SIMILAR TO THOSE SHOWN. IN FACT, THERE ARE FREQUENTLY SHARP DIFFERENCES BETWEEN HYPOTHETICAL PERFORMANCE RESULTS AND THE ACTUAL RESULTS SUBSEQUENTLY ACHIEVED BY ANY PARTICULAR TRADING PROGRAM.

ONE OF THE LIMITATIONS OF HYPOTHETICAL PERFORMANCE RESULTS IS THAT THEY ARE GENERALLY PREPARED WITH THE BENEFIT OF HINDSIGHT. IN ADDITION, HYPOTHETICAL TRADING DOES NO INVOLVE FINACIAL RISK, AND NO HYPOTHETICAL TRADING RECORD CAN COMPLETLEY ACCOUNT FOR THE IMPACT OF FINANCIAL RISK IN ACTUAL TRADING. FOR EXAMPLE, THE ABILITY TO WITHSTAND LOSSES OR TO ADHERE TO A PARTICULAR TRADING PROGRAM IN SPITE OF TRADING LOSSES ARE MATERIAL POINTS WHICH CAN ALSO ADVERSELY AFFECT ACTUAL TRADING RESULTS. THERE ARE NUMEROUS OTHER FACTORS RELATED TO THE MARKETS IN GENERAL OR TO THE IMPLEMENTATION OF ANY SPECIFIC TRADING PROGRAM WHICH CANNOT BE FULLY ACCOUNTED FOR IN THE PREPARATION OF HYPOTHETICAL PERFORMANCE RESULTS AND ALL OF WHICH CAN ADVERSELY AFFECT ACTUAL TRADING RESULTS.


Leading Trading Platform for Hedgers, Farmers and Global Traders:

  • Custom and Preset Quote Pages
  • Charts
  • Options
  • QT News
  • Weather
  • QT Audio
  • Messaging
  • Bids
  • Electronic Buy/Sell Grain System
  • Order Entry Abilities
  • RTD Live-link to Excel
  • Producer Profitability Calculator

FREE TRIAL

Trading Futures, Options on Futures, and retail off-exchange foreign currency transactions involves substantial risk of loss and is not suitable for all investors.  You should carefully consider whether trading is suitable for you in light of your circumstances, knowledge, and financial resources. You may lose all or more of your initial investment. Opinions, market data, and recommendations are subject to change at any time when it comes to Futures Trading.

Futures Trading Levels

for 10-12-2022

#goldfutures #sp500futures #crudeoilfutures # nasdaqfutures #dowfutures #futurestrading #futuresbrokers
SP500 #ES_FNasdaq100  #NQ_FDow Jones  #YM_FMini Russell #RTY_FBitCoin Index #BRTI SP500 Dec. Gold #GC_F Dec. Silver #SI_F Oct. Crude Oil #CL-F Dec. Bonds  #ZB_F Dec. 10 yr  #ZN_F Dec. Corn #ZC_F Dec.  Wheat #ZW_F Nov. Beans #ZS_F Dec. SoyMeal #ZM_F Oct. Nat Gas #NG_F Dec. Coffee #KC_F Dec. Cocoa #CC_F October Sugar #SB_F Dec. Cotton #CT_F Sept.  Euro Currency

Improve Your Trading Skills

Get access to proprietary indicators and trading methods, consult with an experienced broker
 1-800-454-9572 Explore trading methods. Register Here


Economic Reports, Source: 

Forexfactory.com


10848e99 7187 4602 8818 8426a40c965e

This is not a solicitation of any order to buy or sell, but a current market view provided by Cannon Trading Inc. Any statement of facts here in contained are derived from sources believed to be reliable, but are not guaranteed as to accuracy, nor they purport to be complete. No responsibility is assumed with respect to any such statement or with respect to any expression of opinion herein contained. Readers are urged to exercise their own judgement in trading.

Weekly Newsletter 1103: Learn to use Bollinger Bands & Parabolics when trading + Futures Trading Levels 6.27.2022

Cannon Futures Weekly Newsletter Issue # 1103

Dear Traders,

Like us on FaceBook!
Get Real Time updates and market alerts on Twitter!

Trading Videos 201: Bollinger Bands, Parabolics, Price Confirmation and more!

Watch a series of short videos, where our VP, Ilan Levy-Mayer shares his personal preferences and opinions on different trading topics.

Good Trading

Trading Futures, Options on Futures, and retail off-exchange foreign currency transactions involves substantial risk of loss and is not suitable for all investors.  You should carefully consider whether trading is suitable for you in light of your circumstances, knowledge, and financial resources. You may lose all or more of your initial investment. Opinions, market data, and recommendations are subject to change at any time when it comes to Futures Trading.

Futures Trading Levels

06-27-2022

Futures Trading Support + Resistance Levels 6.27.2022

Weekly Levels

Weekly Futures Trading Support + Resistance Levels
Weekly Trading Levels for 6.27-7.01

Reports, First Notice (FN), Last trading (LT) Days for the Week:

https://mrci.com

Date Reports/Expiration Notice Dates
MRCI Reports

This is not a solicitation of any order to buy or sell, but a current market view provided by Cannon Trading Inc. Any statement of facts herein contained are derived from sources believed to be reliable but are not guaranteed as to accuracy, nor they purport to be complete. No responsibility is assumed with respect to any such statement or with respect to any expression of opinion herein contained. Readers are urged to exercise their own judgment in trading

Learning The Different Types Of Charts And Patterns & Support and Resistance Levels 5.03.2022

Get Real Time updates and more on our private FB group!

Learning The Different Types Of Charts And Patterns Will Be Another Arsenal In Your Trading Tools!

Ascending Triangle Futures Trading Chart Pattern
What is an Ascending Triangle Futures Chart Pattern?
An ascending triangle is a bullish futures pattern that can indicate a breakout in the upwards direction.
How do I Recognize an Ascending Triangle Futures Chart Pattern?
An ascending triangle is formed when resistance remains flat and support rises.

Trading Futures, Options on Futures, and retail off-exchange foreign currency transactions involves substantial risk of loss and is not suitable for all investors.  You should carefully consider whether trading is suitable for you in light of your circumstances, knowledge, and financial resources. You may lose all or more of your initial investment. Opinions, market data, and recommendations are subject to change at any time when it comes to Futures Trading.

Futures Trading Levels

05-03-2022


4c4f9974 8489 4489 87ef ea151e12f5d7


Improve Your Trading Skills

Get access to proprietary indicators and trading methods, consult with an experienced broker
 1-800-454-9572 Explore trading methods. Register Here


Economic Reports, Source: 

Forexfactory.com

bf4357b6 e127 428c 9694 58b0624d77c4


This is not a solicitation of any order to buy or sell, but a current market view provided by Cannon Trading Inc. Any statement of facts here in contained are derived from sources believed to be reliable, but are not guaranteed as to accuracy, nor they purport to be complete. No responsibility is assumed with respect to any such statement or with respect to any expression of opinion herein contained. Readers are urged to exercise their own judgement in trading.

3 Main Types of Trading Days, 30 Year Bond Chart Review & Support and Resistance Levels 11.12.2021

Dear Futures Trader,

Get Real Time updates and more on our private FB group!
Yesterday we had a nice volatile day, with price action both up and down and then we followed it today ( Veteran’s Day, banks are closed) with very choppy, much narrower price action. Tomorrow is Friday, after a quiet day and with some meanigful reports – which encouraged me to share the following with you on the different types of trading days:

 In my opinion there are 3 main types of trading days:

1. The most common day are two sided trading action with swings up and down – this type of trading day is most suitable for using support and resistance levels along with overbought/oversold indicators.
2. Strong trending days, mostly one directional – this type of trading day is the least common, many times will happen on Mondays and maybe 3-5 times a month at most – this type of trading day is most suitable for using ADX, MACD crossovers and pretty much looking for pullbacks to jump on the trend perhaps with the help of parabolics.
3. Slow and/or choppy trading days – this type of trading day is best suited for taking small profits from the market by looking at volume spikes, using stochastics as possible entry signals and usually wait for a pullback before jumping in.
·A good question I’ve been asked is how can one asses what type of trading day we will have while the market is still trading….I have been doing some work in finding the answers and will be happy to hear feedback via email but here are some initial observations:
1.  Was the overnight session a wide, two sided trading range? If the answer is yes, good chances for similar trading day during the primary session (primary session is when the cash/stock market is open)
2. Mondays have the highest chance for trending days
3. The behavior of the first hour of trading can also suggests the type of action for the rest of the day.
4. If the first 30 minutes of the trading day have good volume, better chances for type 1 or type 2 trading days.
5. Low volume during the first 30 minutes can suggest a choppy (type 3 trading day)
6. Are there other strong trends in other sectors? ( bonds? metals? energies? Dollar index? )
Trading Futures, Options on Futures, and retail off-exchange foreign currency transactions involves substantial risk of loss and is not suitable for all investors. You should carefully consider whether trading is suitable for you in light of your circumstances, knowledge, and financial resources. You may lose all or more of your initial investment. Opinions, market data, and recommendations are subject to change at any time when it comes to Futures Trading.
Hourly/ 60 minutes chart click for larger image) of the 30 yr bonds (ZB or USA) for your review below. I have heard from some clients that they “like the personality of the bonds” better than the ES and NQ. Different dynamics, larger tick size – may be worth your time to follow and try in SIM MODE first
Futures US Treasury Bond 60 minute Chart
If you are looking for other reference material please contact your Cannon Broker for lists of solid, informative and helpful trading tomes

Good Trading

Trading Futures, Options on Futures, and retail off-exchange foreign currency transactions involves substantial risk of loss and is not suitable for all investors.  You should carefully consider whether trading is suitable for you in light of your circumstances, knowledge, and financial resources. You may lose all or more of your initial investment. Opinions, market data, and recommendations are subject to change at any time when it comes to Futures Trading.


Futures Trading Levels

11-12-2021


Futures Support and Resistance Levels 11.12.2021


Economic Reports, source: 

https://bettertrader.co/ 

BetterTrader Reports


This is not a solicitation of any order to buy or sell, but a current market view provided by Cannon Trading Inc. Any statement of facts here in contained are derived from sources believed to be reliable, but are not guaranteed as to accuracy, nor they purport to be complete. No responsibility is assumed with respect to any such statement or with respect to any expression of opinion herein contained. Readers are urged to exercise their own judgement in trading.

Weekly Newsletter 1073: Using Tick/Volume charts and Oscillators for Scalping & Trading Levels for the Week Ahead

Cannon Futures Weekly Letter Issue # 1073

Dear Traders,

Like us on FaceBook!
Get Real Time updates and market alerts on Twitter!


Day Trading 201: Using Tick/Volume charts and Oscillators for Scalping

Using tick charts and oscillators for day-trading (by Ilan Levy-Mayer VP of Cannon Trading and CTA at Levex.net )
I really don’t think anyone has found a “perfect way” to day-trade.
Different techniques work well in different market environment.
In this week short educational feature, I will touch on one technique you can add to your trading arsenal. This technique works better on choppy, two sidedway and/or volatile markets. It does NOT work well when the market has a strong trend.
The chart below illustrates a few principals I like:
  1. It uses a tick chart rather than a time chart. I like tick charts ( range bar, volume charts, renko) better when day-trading shorter time frames for the simple reason it already includes a big factor in the market, VOLUME. If you are using a 5 minute chart for example, you may get signals simply because time “has passed” and certain indicators you are using adopt certain values. When using tick charts during periods where there are lots of movement, you won’t have to wait until your time frame bar closes to get your signal, volume becomes a bigger more important part of your trading decision.
  2. The other part for this trading approach is to use overbought/ oversold indicators in an attempt to catch exhuastion in selling or buying and catch the counter trend move. Sometimes that move will be minor, sometimes it will be a trend reversal and at other times just a little pause in a strong trend….no crystal balls here, just another tool to observe and consider in your trading. In the PDF you will see the same indicators, same market, same time frame BUT using different type of charts…..

Good Trading

Trading Futures, Options on Futures, and retail off-exchange foreign currency transactions involves substantial risk of loss and is not suitable for all investors.  You should carefully consider whether trading is suitable for you in light of your circumstances, knowledge, and financial resources. You may lose all or more of your initial investment. Opinions, market data, and recommendations are subject to change at any time when it comes to Futures Trading.


Futures Trading Levels

11-01.2021


Futures Levels 11.01.2021

Weekly Levels

fe9405fd c27a 464d 8fee 11d94285d4b3


Reports, First Notice (FN), Last trading (LT) Days for the Week:

https://mrci.com

Date Reports/Expiration Notice Dates

1f53c4e1 de2d 4aaf bd17 a4f58561ba57

This is not a solicitation of any order to buy or sell, but a current market view provided by Cannon Trading Inc. Any statement of facts here in contained are derived from sources believed to be reliable, but are not guaranteed as to accuracy, nor they purport to be complete. No responsibility is assumed with respect to any such statement or with respect to any expression of opinion herein contained. Readers are urged to exercise their own judgement in trading

Futures Trading Levels for Oct. 28th 2021

Dear Traders,

Get Real Time updates and more on our private FB group!
🙂
Today is the day for some futures market philosophy.
But first, a heads up: Start trading in January beans – November beans entering first notice day.
You should be already trading December natural gas.
My colleague, Mark O’Brien shared this with me today as he heard my frustration with some of the trades and markets…
“Every battle is won or lost before it is ever fought.”
Sun Tzu
The Art of War
This passage  that dates back the 6th century B.C. , can aptly be applied to trading futures. Prepare for each trade and set your risk.  If the initial outcome is favorable, use your enemy’s (the market’s) resources (move your stop) to sustain your trading.
Don’t engage in extended battles (over trade) and consume your resources (money, time, mental energy).
Your “enemy,” (the market) only has the power to destroy your account if you let it.

Good Trading

Trading Futures, Options on Futures, and retail off-exchange foreign currency transactions involves substantial risk of loss and is not suitable for all investors.  You should carefully consider whether trading is suitable for you in light of your circumstances, knowledge, and financial resources. You may lose all or more of your initial investment. Opinions, market data, and recommendations are subject to change at any time when it comes to Futures Trading.

Futures Trading Levels

10-28-2021

Support & Resistance Levels for 10/28/2021

Did you know?

Cannon offers over 10 TRADING PLATFORMS CLICK HERE for a demo


Economic Reports, source: 

https://bettertrader.co/ 

Better Trader Report 10/28/2021

This is not a solicitation of any order to buy or sell, but a current market view provided by Cannon Trading Inc. Any statement of facts here in contained are derived from sources believed to be reliable, but are not guaranteed as to accuracy, nor they purport to be complete. No responsibility is assumed with respect to any such statement or with respect to any expression of opinion herein contained. Readers are urged to exercise their own judgement in trading.

Order Flow, Buy & Sell Zones, & Support and Resistance Levels 9.24.2021

Dear Traders,

Get Real Time updates and more on our private FB group!
Separator

Yesterday we hosted a very interesting webinar with Bookmap about order flow, buy and sell zones, liquidity of large orders and MUCH MORE.

On a personal level I really enjoyed the information as I am the type of guy who has been looking at indicators/ volume charts, range bar charts and probably many of the things that many of futures traders are used to. The data and information shared yesterday during live market hours with forward thinking analysis was very interesting to me and I will do more homework on the topic.

If you did not attend the webinar and would like to see a recording, CLICK HERE.

Good Trading

Trading Futures, Options on Futures, and retail off-exchange foreign currency transactions involves substantial risk of loss and is not suitable for all investors.  You should carefully consider whether trading is suitable for you in light of your circumstances, knowledge, and financial resources. You may lose all or more of your initial investment. Opinions, market data, and recommendations are subject to change at any time when it comes to Futures Trading.


Futures Trading Levels

9-24-2021

e31b0360 5d01 44b0 a703 8e8d03c54ccb

Economic Reports, source: 

 www.BetterTrader.co

dc0eca88 6936 4ecf 8aaf edac3d3e25d6

This is not a solicitation of any order to buy or sell, but a current market view provided by Cannon Trading Inc. Any statement of facts here in contained are derived from sources believed to be reliable, but are not guaranteed as to accuracy, nor they purport to be complete. No responsibility is assumed with respect to any such statement or with respect to any expression of opinion herein contained. Readers are urged to exercise their own judgement in trading as well as options on futures.