|
|
Investment is a game of money of securing future money by taking a risk today. Trading therefore comes with a list of rules to play by. Commodity trading in particular offers tremendous potential for becoming a completely different asset class.
However, before investing in any kind of commodity, you must do an in depth research and also ask your broker as many questions as possible. Through this category archive we provide you as much information and valuable insights into the world of commodity trading.
We at Cannon Trading are here to help you with your commodity trading needs. You as a trader should select your commodity trading advisor only after performing a due diligence on him/her. We in fact do that for you. This way, you get only the best advice to help you with your commodity trading.
We’ve got the information that you might need at every step of commodity trading, and you’ll find it all right here in the commodity trading section of our blog. Read up, and read on to get equipped!
|
|
|
|
The S&P 500 Index Futures, also known as standard & poor’s 500 index futures, is a financial derivative that allows traders to speculate on the future value of the S&P 500 Index, one of the most widely followed stock market indices in the world. These futures contracts serve as a means of managing risk, offering both hedging capabilities and speculative opportunities. The s and p 500 futures contract provides exposure to the U.S. stock market’s performance without requiring traders to hold the actual underlying stocks. This contract’s prominence has made it one of the most traded assets globally, reflecting trends, economic indicators, and market sentiment.
The standard and poor’s 500 futures contract has its roots in the financial markets of the early 1980s. Developed by the Chicago Mercantile Exchange (CME), it was officially introduced for trading in 1982. The concept was initially designed to give institutional and retail investors an efficient way to hedge their portfolios against fluctuations in the S&P 500, which represents approximately 80% of the total U.S. market capitalization.
In the late 1970s, U.S. markets were becoming increasingly volatile due to various economic factors, such as inflation and changes in monetary policy. The S&P 500 index, established decades earlier, had gained a solid reputation for accurately representing the U.S. economy’s performance. As a result, financial professionals and individual investors alike were seeking new ways to protect their investments. The development of spx index futures was a direct response to these demands, providing an innovative tool for managing equity risk.
Since its inception, standard & poor’s 500 index futures have experienced significant price fluctuations, reflecting changes in market sentiment, macroeconomic factors, and global events. Initially, these futures contracts began trading at levels near the index’s value, allowing investors to gain exposure to the market’s performance with minimal capital. Throughout the 1980s and 1990s, the S&P 500 index experienced steady growth as the economy expanded, with notable milestones in the technology and internet boom of the late 1990s.
The early 2000s, however, marked a significant downturn in the market due to the dot-com bubble. This period saw the s and p 500 futures contract decline sharply as technology stocks collapsed. The S&P 500 index futures reached their lowest levels during the early 2000s recession, but the market eventually rebounded due to monetary policy changes and renewed investor confidence. The 2008 global financial crisis led to another significant decline in standard and poor’s 500 futures, reflecting the uncertainty and economic strain at the time. However, aggressive fiscal policies and quantitative easing measures helped stabilize the market, leading to a prolonged recovery.
In the 2010s, the s&p 500 futures index saw remarkable growth, reaching new highs as technology stocks led the way and economic conditions improved. The introduction of automated and algorithmic trading contributed to increased liquidity and trading volume, propelling the futures contracts’ popularity further. Most recently, futures s&p 500 experienced unprecedented volatility due to the COVID-19 pandemic, which led to sharp declines and a rapid recovery as governments and central banks around the world implemented economic stimulus measures. By 2024, the futures sp trades at an impressive level of 5,994, reflecting the resilience and sustained growth of the U.S. economy.
Several factors have influenced the price movement of sp500 index futures, including:
Current Trading Level and Market Position
As of now, futures s&p 500 are trading at approximately 5,994. This level represents years of market growth driven by strong corporate performance, advances in technology, and accommodative monetary policies. The current price level also suggests investor optimism and confidence in the U.S. economy’s resilience, despite recent economic challenges.
Cannon Trading Company stands out as an ideal broker for trading spx index futures due to several key factors:
For traders looking to navigate the complexities of this market, Cannon Trading Company stands as a reliable partner, offering decades of experience, a free trading platform, exceptional customer service, and a stellar regulatory reputation. With Cannon Trading, traders can confidently access the s and p 500 futures contract, making it an excellent choice for those seeking a robust and reputable brokerage.
For more information, click here.
Ready to start trading futures? Call us at 1(800)454-9572 – Int’l (310)859-9572 (International), or email info@cannontrading.com to speak with one of our experienced, Series-3 licensed futures brokers and begin your futures trading journey with Cannon Trading Company today.
Disclaimer: Trading Futures, Options on Futures, and retail off-exchange foreign currency transactions involve substantial risk of loss and are not suitable for all investors. Past performance is not indicative of future results. Carefully consider if trading is suitable for you in light of your circumstances, knowledge, and financial resources. You may lose all or more of your initial investment. Opinions, market data, and recommendations are subject to change at any time.
Important: Trading commodity futures and options involves a substantial risk of loss. The recommendations contained in this article are opinions only and do not guarantee any profits. This article is for educational purposes. Past performances are not necessarily indicative of future results.
This article has been generated with the help of AI Technology and modified for accuracy and compliance.
Follow us on all socials: @cannontrading

In this issue:
Important Notices – Next Week Highlights:
The Week Ahead
By John Thorpe, Senior Broker
503 corporate earnings reports and a number of meaningful Economic data releases.
FOMC Minutes 1:00P.M. Central this upcoming Tuesday!, highlights Thanksgiving week data points. No Fed speakers.
Prominent Earnings this Week:
FED SPEECHES:
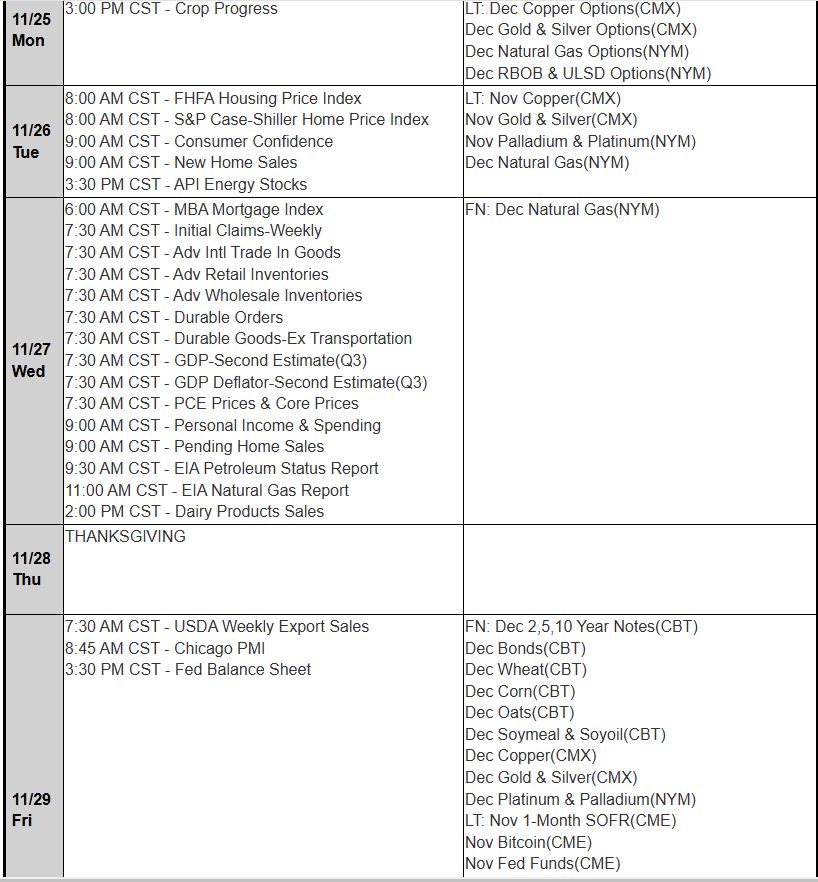
Economic Data week:
Thanksgiving 2024 Holiday Schedule for CME Exchange HoursClick here for the detailed schedule
|

Hot market of the week is provided by QT Market Center, A Swiss army knife charting package that’s not just for Hedgers, Cooperatives and Farmers alike but also for Spread traders, Swing traders and shorter time frame application for intraday traders with a unique proprietary indicator that can be applied to your specific trading needs.
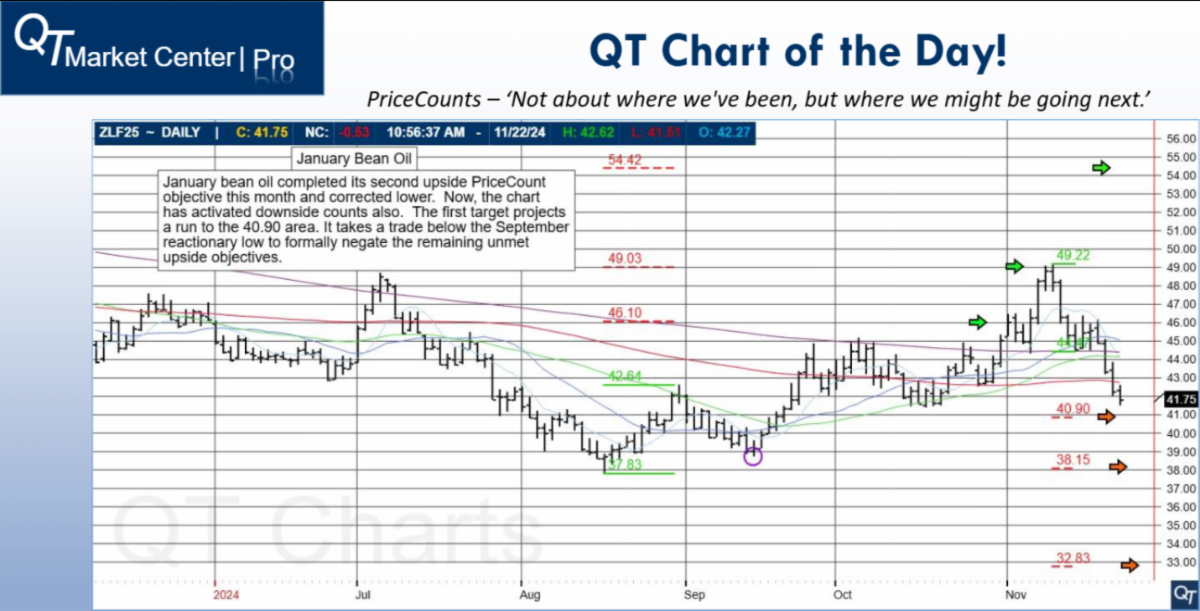
January Bean Oil
January bean oil completed its second upside PriceCount objective this month and corrected lower. Nw, the chart has activated downisde counts also. The first target projects a run to the 40.90 area. It takes a trade below the September reactionary low to formally negate the remaining unmet upside objectives.
PriceCounts – Not about where we’ve been , but where we might be going next!


Get access to proprietary indicators and trading methods, consult with an experienced broker at 1-800-454-9572.
Explore trading methods. Register Here
* This is not a solicitation of any order to buy or sell, but a current market view provided by Cannon Trading Inc. Any statement of facts here in contained are derived from sources believed to be reliable, but are not guaranteed as to accuracy, nor they purport to be complete. No responsibility is assumed with respect to any such statement or with respect to any expression of opinion herein contained. Readers are urged to exercise their own judgement in trading.
|
|
|
|
|
|
|
The Dow Jones Industrial Average (DJIA), commonly known as the Dow, has long served as a benchmark for American stock market performance, capturing the movement of 30 prominent U.S. companies across various sectors. Since the inception of DJIA Index Futures, often referred to as Dow futures or Dow Jones futures, traders have had unique opportunities to speculate on the index’s movements, providing a way to manage risk and potentially earn profits based on the future value of the Dow. As the futures market evolved, DJIA Index Futures established themselves as some of the most versatile tools in a trader’s portfolio.
This article explores why DJIA Index Futures have remained a mainstay in the futures market, the key players involved in the development of the Dow Jones futures contract, and why Cannon Trading Company is an excellent brokerage for trading these futures contracts. With decades of expertise in futures trading and a reputation for exceptional customer service, Cannon Trading Company has earned its place as a premier option for traders looking to invest in DJIA Index Futures and emini Dow futures.
DJIA Index Futures have demonstrated remarkable versatility since their introduction to the market. This versatility stems from several key factors:
The idea of creating futures contracts based on major stock indices emerged in response to increased demand for risk management tools in the 1980s. The Chicago Board of Trade (CBOT) was instrumental in bringing this concept to life. The late Leo Melamed, a visionary in financial futures and a key figure at the Chicago Mercantile Exchange (CME), recognized the potential of introducing futures on financial indices. Working alongside industry pioneers, Melamed helped to popularize index futures as a way for investors to protect their portfolios from adverse movements in stock prices.
The initial success of the S&P 500 futures contract set the stage for further innovation in the market. The creation of DJIA Index Futures was a natural progression. In 1997, the CBOT launched the DJIA Index Futures contract, providing investors a means to speculate or hedge on the movements of one of the most well-known indices in the world. This product allowed for a diversified approach to futures trading, as it reflected the performance of the Dow Jones Industrial Average, a cornerstone of American financial markets.
While Melamed was a pivotal figure, the development and launch of DJIA Index Futures were collaborative efforts that involved input from regulators, financial institutions, and industry experts. Their goal was to create a futures product that mirrored the Dow Jones index and offered accessible, transparent, and efficient trading for institutions and retail investors alike.
With its reputation for excellence and over three decades of experience in futures trading, Cannon Trading Company has become a trusted broker for traders interested in DJIA Index Futures. Known for its high ratings on platforms like TrustPilot, where it maintains a 5-star rating, Cannon Trading Company has earned a solid reputation for customer service and reliability. Here’s why Cannon Trading Company is a standout choice for trading DJIA Index Futures and other futures contracts.
In addition to standard DJIA Index Futures, the introduction of emini Dow futures has expanded accessibility for retail traders. These miniaturized contracts represent a fraction of the size of traditional Dow futures, allowing traders with smaller capital to participate in Dow Jones futures trading. Emini Dow futures retain many of the features of standard contracts, including liquidity, leverage, and round-the-clock trading. Cannon Trading Company provides access to emini Dow futures, enabling retail traders to benefit from the versatility of Dow Jones futures without the large financial commitment of full-sized contracts.
As a futures trading instrument, DJIA Index Futures offer several advantages that make them popular among traders worldwide:
Since their inception, DJIA Index Futures have proven to be a valuable asset in the futures trading landscape. These contracts offer traders a unique combination of leverage, liquidity, and flexibility, making them suitable for a wide range of strategies, including hedging, speculation, and arbitrage. The versatility of Dow futures, combined with their close association with the U.S. stock market, has made them a go-to choice for traders seeking exposure to the American economy.
Cannon Trading Company’s dedication to providing a top-tier trading experience, combined with its 5-star TrustPilot rating, extensive experience, and regulatory compliance, makes it a highly recommended broker for trading DJIA Index Futures. With access to advanced trading platforms, educational resources, and high-quality customer service, Cannon Trading Company empowers traders to capitalize on opportunities in DJIA Index Futures and emini Dow futures with confidence.
Whether you’re a seasoned futures trader or just starting your journey with Dow Jones futures, the support and expertise offered by Cannon Trading Company make it a trustworthy partner for achieving your trading goals. DJIA Index Futures, with their unique attributes and market appeal, remain an indispensable tool for futures traders worldwide.
For more information, click here.
Ready to start trading futures? Call us at 1(800)454-9572 – Int’l (310)859-9572 (International), or email info@cannontrading.com to speak with one of our experienced, Series-3 licensed futures brokers and begin your futures trading journey with Cannon Trading Company today.
Disclaimer: Trading Futures, Options on Futures, and retail off-exchange foreign currency transactions involve substantial risk of loss and are not suitable for all investors. Past performance is not indicative of future results. Carefully consider if trading is suitable for you in light of your circumstances, knowledge, and financial resources. You may lose all or more of your initial investment. Opinions, market data, and recommendations are subject to change at any time.
Important: Trading commodity futures and options involves a substantial risk of loss. The recommendations contained in this article are opinions only and do not guarantee any profits. This article is for educational purposes. Past performances are not necessarily indicative of future results.
This article has been generated with the help of AI Technology and modified for accuracy and compliance.
Follow us on all socials: @cannontrading
A futures trader is a professional who buys and sells futures contracts on commodities, financial instruments, and other assets in order to profit from fluctuations in their price. Engaging in futures trading involves significant risk and complexity, but when done right, it can yield considerable rewards. However, to maintain a long-term career in futures trading, a trader must adhere to a set of core principles that promote sustainable growth and risk management. Key principles for longevity in this field include emotional control, adherence to trading plans, disciplined risk management, and an understanding of how to balance opportunity with caution. Futures trading is a demanding profession, and those who approach it without a structured approach often find themselves struggling to maintain consistency.
One of the most critical principles for any futures trader is emotional control. The fast-paced nature of trading futures, coupled with the significant leverage available, can make it easy to fall into the traps of fear and greed. Emotional control allows traders to respond to market movements calmly rather than react impulsively, which is essential in avoiding irrational decisions that can lead to losses.
For instance, a futures trader may be tempted to double down on a losing position out of frustration or stubbornness, hoping to recoup losses. However, experienced traders know that emotional decisions are rarely profitable in the long term. Instead, successful futures traders have the discipline to cut losses when needed and avoid revenge trading — the tendency to try and “win back” losses through risky moves. Achieving emotional control is often about creating a mindset that recognizes that losses are a natural part of trading in futures and can be managed with a clear strategy.
While emotional control is vital, it can also conflict with the excitement of seizing opportunities. The futures market often presents fast-moving opportunities, and a futures trader may feel an impulse to “catch the wave” of a sudden price move. However, seasoned traders understand that making emotionally driven decisions rarely yields consistent profits. They approach each opportunity with a clear mind and refrain from overtrading, no matter how tempting it may feel in the moment.
A trading plan is a carefully crafted roadmap that outlines a trader’s strategy, including entry and exit points, stop-loss levels, position sizes, and risk tolerance. For a futures trader, adhering to a trading plan is crucial for maintaining consistency in an environment known for its volatility. A trading plan helps remove the emotional component from decision-making, as it provides clear guidelines on how to react under different market conditions.
One of the most significant challenges that futures traders face is resisting the urge to deviate from their trading plans in pursuit of short-term gains. Trading in futures can sometimes feel unpredictable, and an unexpected market shift may lead traders to stray from their plan to try to capitalize on a sudden price movement. While the allure of quick profits can be strong, a successful futures trader recognizes the importance of sticking to the plan and avoiding impulsive trades that do not align with their long-term objectives.
For example, let’s say a futures trader sees an unexpected market rally that they did not anticipate in their plan. Jumping in impulsively could expose them to excessive risk and result in a significant loss if the market reverses. Instead, a disciplined futures trader will assess the situation and determine if the opportunity aligns with their trading criteria. If not, they will patiently wait for a setup that fits their plan. This adherence to a structured approach not only minimizes unnecessary risks but also helps in building a consistent track record over time.
Risk management is arguably one of the most important principles for anyone involved in futures trading. Unlike other forms of trading, futures contracts are highly leveraged, allowing a futures trader to control large positions with a relatively small amount of capital. While this leverage can magnify profits, it also significantly increases the potential for losses. Proper risk management involves understanding the potential downside of each trade and implementing safeguards to protect capital.
One of the main ways to manage risk is by avoiding overleveraging. Overleveraging occurs when a trader takes on too large a position relative to their account size, which can lead to substantial losses if the market moves unfavorably. Many futures traders are tempted to overleverage in an attempt to maximize profits, but this approach often leads to a quick depletion of their capital. Instead, experienced traders limit their leverage to a level that allows them to weather market volatility without risking catastrophic losses.
Resisting overleveraging is critical, but it sometimes conflicts with a trader’s desire to take advantage of an attractive opportunity. For instance, if a futures trader identifies what they perceive as a high-probability trade, they may feel compelled to increase their leverage to maximize their gains. However, seasoned traders understand that any single trade carries risk, and overextending oneself on one trade can lead to financial trouble. The most successful futures traders balance their enthusiasm for opportunity with a disciplined approach to leverage, ensuring that they have enough capital to remain in the market for the long haul.
While discipline and skill are essential, selecting a reliable futures broker is also a crucial decision for any futures trader. The right broker provides a foundation of support, from trade execution to customer service and technical troubleshooting. Cannon Trading Company, for instance, is known for its decades of experience in the futures markets, and with a 5 out of 5-star rating on TrustPilot, it has established a reputation for reliability and client satisfaction.
Working with a broker like Cannon Trading offers multiple advantages for futures traders trading futures. First, their extensive experience in the futures markets means they understand the nuances and challenges traders face daily. This insight allows them to provide valuable guidance and support, which can be especially beneficial for newer traders who are still learning the complexities of trading futures. Additionally, their high customer service ratings indicate a strong commitment to assisting clients promptly, which can be essential in the fast-paced world of futures trading where platform issues or trade execution delays can have financial consequences.
Cannon Trading’s dedication to customer service and troubleshooting helps traders focus on their strategies without the added stress of technical issues. In futures trading, having a broker who can resolve issues efficiently and provide ongoing support can be the difference between a successful trade and a missed opportunity. Cannon Trading’s ratings reflect their reliability in providing broker assistance, which is invaluable for futures traders who rely on quick access to information and a seamless trading experience.
The futures markets are constantly evolving, with new technologies, strategies, and market conditions emerging regularly. For a futures trader to succeed over the long term, a commitment to continuous learning is essential. This could involve studying market trends, understanding new regulations, or refining trading strategies based on past experiences. A willingness to adapt and evolve as a trader ensures that one remains competitive and avoids becoming complacent.
Additionally, the support of a knowledgeable broker like Cannon Trading Company can aid in this learning process. With their years of experience, they can offer educational resources, insights, and market analysis that are beneficial to traders at all skill levels. Leveraging the resources provided by an experienced broker can help traders stay informed and make more educated decisions.
The life of a futures trader is a delicate balance between seizing opportunities and maintaining discipline. The desire to capitalize on favorable market conditions is natural, but without the guiding principles of emotional control, adherence to a trading plan, and disciplined risk management, traders may fall into habits that undermine their long-term success. Resisting the temptation to overleverage and choosing a trustworthy broker like Cannon Trading Company can further support a sustainable approach.
Futures trading is not a career suited to impulsive decision-making or excessive risk-taking. Traders who respect the markets, remain vigilant, and continuously refine their strategies have the best chances of success. The journey of a futures trader is marked by patience, adaptability, and a focus on consistent, incremental gains rather than high-stakes risks. By adhering to these core principles and leveraging the support of an experienced broker, traders can pursue a rewarding and sustainable career in the dynamic world of futures trading.
For more information, click here.
Ready to start trading futures? Call us at 1(800)454-9572 – Int’l (310)859-9572 (International), or email info@cannontrading.com to speak with one of our experienced, Series-3 licensed futures brokers and begin your futures trading journey with Cannon Trading Company today.
Disclaimer: Trading Futures, Options on Futures, and retail off-exchange foreign currency transactions involve substantial risk of loss and are not suitable for all investors. Past performance is not indicative of future results. Carefully consider if trading is suitable for you in light of your circumstances, knowledge, and financial resources. You may lose all or more of your initial investment. Opinions, market data, and recommendations are subject to change at any time.
Important: Trading commodity futures and options involves a substantial risk of loss. The recommendations contained in this article are opinions only and do not guarantee any profits. This article is for educational purposes. Past performances are not necessarily indicative of future results.
This article has been generated with the help of AI Technology and modified for accuracy and compliance.
Follow us on all socials: @cannontrading