Crude Oil Futures Trading Updates for February 2019

Crude Oil Futures Trading Updates for February 2019

Crude oil futures experienced one of the strongest sell offs to finish 2018. The market sold from the mid 70’s into the mid 40’s in a matter of 7 weeks.

See daily chart below:

CrudeOilChart21319


There were many reasons for the sell off. US China trade talks or lack off, OPEC production, US $ strength and much more but all this is old news at this point and the main focus of futures traders going forward is ”what next?” Before I try to answer that, lets take a look at some key factors that are general in nature to futures trading and crude oil futures trading:

Crude Oil is part of the energy sector along with “it’s” brothers “RBOB – Unleaded gas” and heating oil and cousin, natural gas. All traded on the NYMEX/GLOBEX exchange.

Crude Oil Futures Specs
Hours: 5:00 PM to 4:00 PM next day PM Central Time
Margins: $3410 initial, $3100 Maint. ( as of the date of this newsletter)
Point Value: full point = $1000 ( Example: 71.80 to 72.80 ). Min fluctuation is 0.1 = $10 ( Example: 71.80 to 71.81)
Settlement: Physical, deliverable commodity

Months: Monthly cycle, All Months

Weekly Options: YES
Crude Oil is one of my favorite markets for Day Trading because of the intraday volatility and movements. Be careful, these factors can work against you or in your favor.

Some of the basic fundamentals to keep in mind when you are considering a trade in the crude oil as well as other energies

  1. Longer term view of current market prices
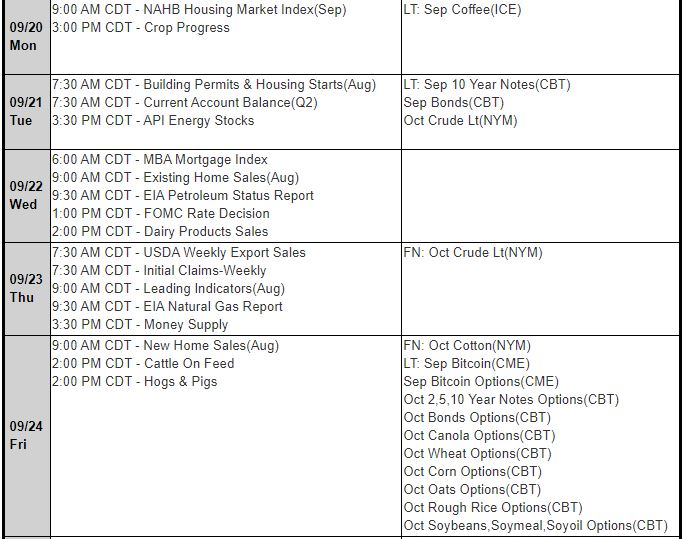
  2.  Dates and times of important reports. Namely, Tuesday afternoon report (API) and the DOE report on Wednesday mornings at 10:30 Am EST
  3. Weather and Seasonality
  4. Correlation to US Dollar prices
  5. Inflationary prospects
  6. Geopolitical Stability
  7. U.S. Fiscal and Monetary Stability

Keep in mind that the GLOBEX/NYMEX also offers the mini Crude oil contract which is half the size and may be a good alternative for smaller/ begginer traders.

MINI Crude Oil Futures Specs
Hours: 5:00 PM to 4:00 PM next day PM Central Time
Margins: $1705 initial, $1550 Maint. ( as of the date of this newsletter)
Point Value: full point = $500 ( Example: 62.80 to 63.80 ). Min fluctuation is 0.25 = $12.5 ( Example: 61.80 to 61.825)
Settlement: Cash Settled commodity one day prior to the Big Contract

Months: Monthly cycle, All Months

So just like when you are trading any commodity or futures contract, one has to ask themselves the following questions in my opinion:

  • What time frame are you trading / looking at? Seconds and minutes? Hours and days or maybe even weeks and months? The answer can definitely impact the type of strategy you will use
  • Do you have a view of the market? Is it going higher? Going lower? Range bound? Is there a trend?
  • What is your personal preference? Risk capital? How much time do you have for following the markets?
  • Are you experienced enough to take a go at it on your own or would you like to chat/ discuss, dissect the markets with a commodity broker, a series 3 licensed futures broker?

If your goal is to scalp and day trade crude oil futures, then take a look at what I consider a timeless piece I wrote a few years back on how to utilize fear and greed to day-trade crude oil futures.

This article has some chart examples and specific trading set ups using crude oil futures trading: Crude Oil Day Trading

Now back to the “million dollar question” – What is next for Crude Oil Futures in the next few weeks?

In order to answer that I will look at the daily chart above and then take a look at the weekly chart below:

CrudeOilChart21319weekly

Based on the fact that we had a major sell off that stopped on support levels, the fact that we are bouncing since then and the opinion I hold that crude oil longer term pressure is still down, my current view for this market is that we will see expanded range bound trading. I am looking for the market to trade between $48 and $59 ( hence the word expanded) over the next few weeks and perhaps more BEFORE it may attempt to take another stab at the down side.

“Well, what good is that you may say to yourself…..” If I am right and you are willing to speculate with risk capital, then this information can be valuable.

My preferred method would be to try and sell call options spread ( vertical call spreads) when the market rallies and sell vertical put spreads when the market sells off. Selling options is a risky strategy!! It is not for new commers and you can learn much more here.

The main theory behind selling the calls and the puts is to take advantage of the time decay of options.

As many of us know, geo political events affect the markets in general and crude oil futures in specific. No one can tell what news, wars, events will take place and that is obviously the unknown factor.

I tell my clients many times on different occasions that entering a trade is only the first part of the equation, the main and even more important part is: how to manage the trade? Where do I exit if I am correct? Where should I exit if I am wrong? Should I use multiple contracts? How much am I willing to risk on the trade?

Many ways to trade any market, many ways to lose money in any market and only very few ways to lock in gains – this one is not different. If you need help creating a trading plan, visit our broker assist services.

Disclaimer – Trading Futures, Options on Futures, and retail off-exchange foreign currency transactions involves substantial risk of loss and is not suitable for all investors. Past performance is not indicative of future results. You should carefully consider whether trading is suitable for you in light of your circumstances, knowledge, and financial resources. You may lose all or more of your initial investment. Opinions, market data, and recommendations are subject to change at any time.

Futures eBook & Trading Levels for 8.17.2018

____________________________________________________________________

Voted #1 Blog and #1 Brokerage Services on TraderPlanet for 2016!!  

____________________________________________________________________

Dear Traders,
Like us on FaceBook!
Get Real Time updates and market alerts on Twitter!
image005
Cannon Trading’s eBook! Written by our very own staff of brokers, this eBook is designed as a guide to the commodities market for both beginners and veterans alike. Inside you can find:
  • A plan with steps for success
  • The top mistakes traders make daily
  • How to handle the market noise
  • And much more!
The futures industry is complex and risky, which is why you need someone to be forthright with you….

Futures Forthright eBook – FREE INSTANT DOWNLOAD

Good Trading!
Trading Futures, Options on Futures, and retail off-exchange foreign currency transactions involves substantial risk of loss and is not suitable for all investors.  You should carefully consider whether trading is suitable for you in light of your circumstances, knowledge, and financial resources. You may lose all or more of your initial investment. Opinions, market data, and recommendations are subject to change at any time.

Futures Trading Levels

08.17.2018

Trustpilot Logo
Trustpilot Stars
TrustScore

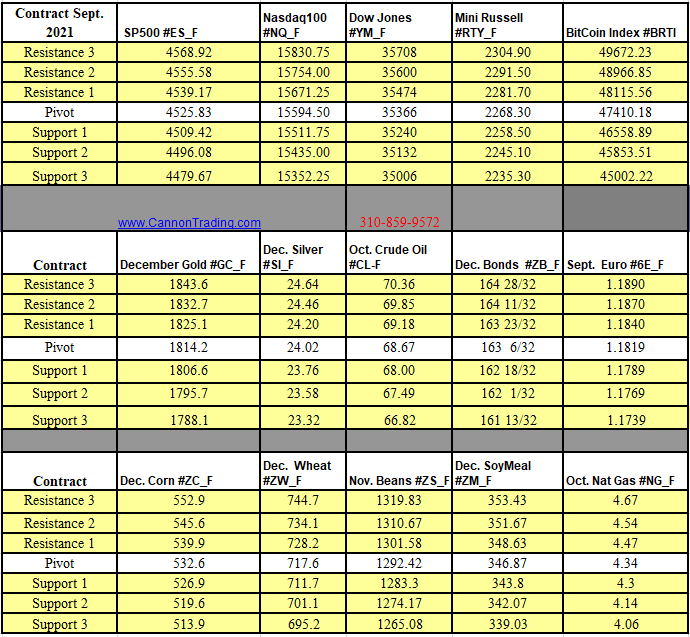
Futures Trading Levels For Aug. 17th
Contract September 2018  SP500 #ES_F Nasdaq100  #NQ_F Dow Jones  #YM_F Mini Russell #RTY_F BitCoin Index #XBT_F
Resistance 3 2892.08 7499.50 26206 1719.00 6778.73
Resistance 2 2871.92 7467.00 25907 1706.00 6628.49
Resistance 1 2857.83 7428.25 25745 1697.00 6515.45
Pivot 2837.67 7395.75 25446 1684.00 6365.21
Support 1 2823.58 7357.00 25284 1675.00 6252.17
Support 2 2803.42 7324.50 24985 1662.00 6101.93
Support 3 2789.33 7285.75 24823 1653.00 5988.89
Contract December Gold #GC_F Sept. Silver #SI-F Sept. Crude Oil #CL-F Sept.  Bonds  #ZB_F Sept.  Euro #6E_F
Resistance 3 1212.6 15.38 66.93 145 12/32 1.1507
Resistance 2 1200.8 15.10 66.22 145  1/32 1.1470
Resistance 1 1190.7 14.87 65.84 144 26/32 1.1434
Pivot 1178.9 14.59 65.13 144 15/32 1.1397
Support 1 1168.8 14.36 64.75 144  8/32 1.1360
Support 2 1157.0 14.08 64.04 143 29/32 1.1323
Support 3 1146.9 13.85 63.66 143 22/32 1.1287
Contract Dec.  Corn #ZC_F Sept. Wheat #ZW_F Nov. Beans #ZS_F Dec. SoyMeal #ZM_F Sept. Nat Gas #NG_F
Resistance 3 384.5 576.8 916.17 346.43 3.00
Resistance 2 383.3 572.2 907.83 342.27 2.97
Resistance 1 381.5 567.1 902.42 339.63 2.94
Pivot 380.3 562.4 894.08 335.47 2.92
Support 1 378.5 557.3 888.7 332.8 2.9
Support 2 377.3 552.7 880.33 328.67 2.86
Support 3 375.5 547.6 874.92 326.03 2.83

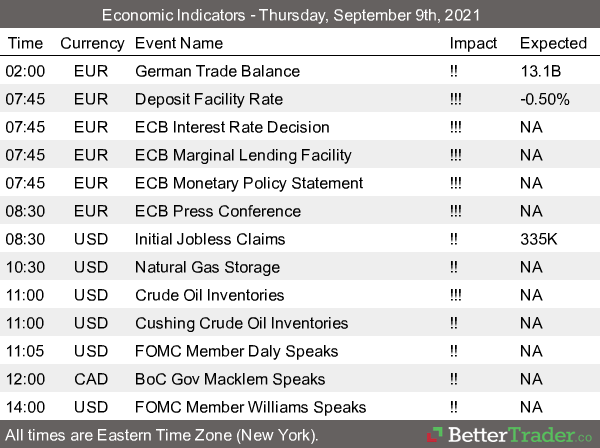
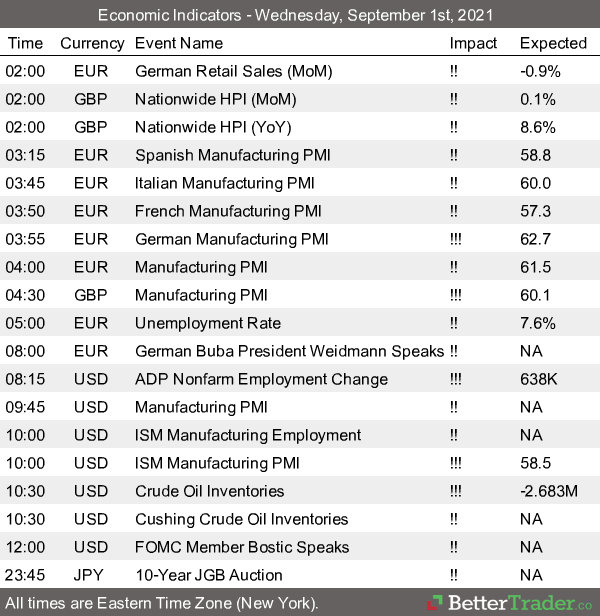
Economic Reports,  source:


Economic Reports, source

https://app.bettertrader.com


a2858758 9387 4642 b780 7921e7a4accb


This is not a solicitation of any order to buy or sell, but a current market view provided by Cannon Trading Inc. Any statement of facts here in contained are derived from sources believed to be reliable, but are not guaranteed as to accuracy, nor they purport to be complete. No responsibility is assumed with respect to any such statement or with respect to any expression of opinion herein contained. Readers are urged to exercise their own judgement in trading.

Trading Crude Oil Futures

Tips for day trading NYMEX crude oil futures

By Ilan Levy-Mayer, VP Cannon Trading Co, Inc.

When it comes to day trading futures contracts, crude oil futures are assumed one of the leading positions as far as trading volume.


During the month of May 2018,  crude oil futures averaged around 1 Million contracts traded per day! That actually surpasses contracts like the ten-year notes, mini SP, mini Nasdaq and others who have traditionally been leaders’ in terms of volume.


Part of the growth in crude oil futures is attributed to day trader participation. Day traders, by definition, will enter and exit their positions during the same trading day. This adds volume to the market traded.


Some of the tips I am sharing below can be applied to most futures contracts as well as other financial products that are traded like stocks, forex, bonds and others. Some of the advice I am sharing is very specific to the crude oil futures trading field.


  1. Know the product you are trading:


  1. Just like a trader who trades a stock like Facebook knows what Facebook does, when its earning reports are due and other factors, so does a crude oil futures day trader needs to know a few facts about crude oil:


  • Contract Size: Crude Oil Futures consist of 1,000 barrels. For the trader this means that each full $1 move in crude futures = $1,000 against you or in your favor.


For example:  A move from 72.10 to 73.10 = $1,000 and a move from 72.10 to 72.11 = $10 (the minimum fluctuation size or the tick size). Be aware that the CME also offers the mini crude contract,  which is half the size.


  • Trading Hours: Crude oil futures trade on the Globex terminal between the hours of 5:00 PM CST the DAY BEFORE to 4:00 PM CST the following day. Which means 23 hours of straight trading. It is important to know that most of the volume will trade between the hours of 8:00 AM CST and 1:30 PM CST, as these hours correspond to the “pit session” of the old trading floor.


Another key aspect to remember is that crude oil is a deliverable commodity and the “front month” will change every 30 days or so. For example: since May 22nd 2018 we have been trading July crude oil.


  • Reports: There are more than a few reports that will affect crude oil future prices indirectly. These include monthly unemployment, the FOMC rate decision, and a few others.


However, there are two major reports that move crude oil futures and its by-products (unleaded gasoline and heating oil) sharply: The API report, which comes out at 3:30 PM CST every Tuesday, and the DOE (Dept. of Energy) inventory numbers, which come out almost every Wednesday at 9:30AM CST.


Take a look at this one-minute chart from Wednesday, May 16th right around the report time below to understand the volatility involved.

chart1

As you can see above, the market made a move of $700 per ONE contract in a matter of minutes, perhaps even seconds! That type of risk and opportunity is one of the factors attracting day-traders into the crude oil market.


  • Geo Political Events: Middle East tensions, the Iran nuclear deal, tensions between Iraq and its neighbors…these are all examples of events that affect crude oil prices. Not to mention OPEC meetings!


  1. Trading Personality:


In my opinion crude oil (like many other markets) will have one of the following 3 modes: trending, two-sided volatility, or Choppy/quiet/range bound trading.


My experience is that crude will more often fall into the first 2 categories:  strong trend or two-sided volatility.  This leads me to my next point below, different trading set-ups.


  1. Trading Set-Ups:


My preferred methods for trading crude are either breakout concept in an attempt to catch a strong move up or down once the market broke some key support or resistance levels, AND/OR counter trend methods to take advantage of when the market is oversold or overbought. Crude does seem to bring more fear and greed out of traders. So looking at RSI levels, for example, and using moving averages ON the RSI to try and get a feel for market reversals are methods worth exploring.


  1. Keep a journal:


Like with any other trading, keep a journal. Take notes on how the market reacted to certain reports, how the markets traded during certain times of the day, and action you took and emotions you had that either helped or hurt you while trading. These notes will help you going forward.


In summary, crude oil futures volume has increased significantly these past few years. The crude oil futures offer traders certain dynamics that other markets may not at certain times. Volatility, fear and greed are key traits for this market. Remember that trading crude oil futures specifically and futures and options in general carries a large degree of risk and is not suitable for all investors. Make sure you consult with a series 3 broker if you never traded this market before. As always, I wish you Good Trading!


Important: Trading commodity futures and options involves a substantial risk of loss.

The recommendations contained in this letter are of opinion only and do not guarantee any profits.

There is not an actual account trading these recommendations.

Past performances are not necessarily indicative of future results.

5 Fact about Brent Crude 5.4.018

____________________________________________________________________

Voted #1 Blog and #1 Brokerage Services on  TraderPlanet   for 2016!!

____________________________________________________________________

Dear Traders,
5 Facts about Brent Crude 
By Senior Broker, Mark O’ Brien

Brent crude is a primary classification of crude oil used as a reference price for trading crude oil around the world. It is also known as London Brent and Brent Blend.

It was first extracted in 1976 from a small area in the North Sea called the Brent field by Shell U.K. Limited (now Royal Dutch Shell), which made it a practice of naming oil fields after water birds.  For this particular area, the name comes from a small water bird called the Brent goose.

While the Brent field is now no longer economically viable, Brent crude is now comprised of oil extracted from fifteen later-developed oil fields located throughout the North Sea, an area of roughly 220,000 square miles.  This area comprises by far the largest oil reserves in western Europe – land or sea.

Read more at

http://www.stockhouse.com/opinion/independent-reports/2018/05/01/5-facts-about-brent-crude#aPaDiqdofoX4VG2J.99

Continue reading “5 Fact about Brent Crude 5.4.018”

Day Trading Crude Oil Futures & Levels 4-18-2018

____________________________________________________________________

Voted #1 Blog and #1 Brokerage Services on  TraderPlanet   for 2016!!

____________________________________________________________________

Dear Traders,

With the energy numbers coming out tomorrow, which impact crude oil quite a bit, I thought it would be a good time to share this article I wrote once again:

Crude Oil Futures volatility offers a “different market personality” than stock index futures. Here is some of the things you need to know about day trading crude oil futures:
By: Ilan Levy-Mayer, Cannon Trading Commodities Broker & VP

Crude Oil is one of MY favorite futures market for day trading. Before I dive in and share with you how the volatility in crude oil fits my risk tolerance for day trading and provide a couple of chart examples, we should review some of the specifications of Crude Oil Futures.

Crude Oil Futures have monthly expiration. So each month we trade a different contract month, so one needs to know when is the first notice day and last trading day for crude oil futures in order to always make sure we are trading the proper month with the most liquidity and avoid any chance of getting into delivery situation.

Continue reading “Day Trading Crude Oil Futures & Levels 4-18-2018”

Trading Resources! 1.31.2018

____________________________________________________________________

Voted #1 Blog and #1 Brokerage Services on  TraderPlanet   for 2016!!

____________________________________________________________________

Front month for crude oil and Natural gas is March.

Front month for gold is now April.

Tomorrow is the last trading day of the month. I have seen the markets make some large moves on last/first trading days of the months and my assumption is that large funds either exit/ enter/close positions for different reasons on these days.

Take notes and keep a journal!! 

Some good resources for you to browse:

Day trading crude oil article: https://www.cannontrading.com/community/day-trading-crude-oil-futures

Trading Calendar: https://www.cannontrading.com/tools/futures-trading-calendar

Chart Patterns: https://www.cannontrading.com/tools/recognizing-charts-patterns

Continue reading “Trading Resources! 1.31.2018”

Crude Oil Futures Flirts with $60 Mark for First Time in Over 30 Months

____________________________________________________________________

Voted #1 Blog and #1 Brokerage Services on TraderPlanet for 2016!!  

____________________________________________________________________

Dear Traders,

Trading was MUCH lighter today than normal…mini SP volume is normally above 1,000,000 contracts per day. Today volume was approx. 300000.

I suspect the lower volume to continue until next Tuesday when we start trading for 2018.

Don’t confuse low volume with “dead price action”. The lower volume can sometimes help exaggerate price moves when certain news or events take place.

The market of today, was definitely crude oil (yes not bitcoin futures this time…). The front month, February touched 60.01 for the first time in
months, maybe couple of years…

Daily chart for review below:

Crude Light(Globex), Equalized Active Daily Continuation Daily Chart

Continue reading “Crude Oil Futures Flirts with $60 Mark for First Time in Over 30 Months”

Saudi Arabia, Crude Oil and Futures Trading Levels for 11.30.2017

____________________________________________________________________

Voted #1 Blog and #1 Brokerage Services on TraderPlanet for 2016!!  

____________________________________________________________________

Dear Traders,

Front month for Silver and most grains is now March.

Front month for gold is now February.

Front month for bonds and other interest futures is now March 2018. 

Saudi Arabia: Turbulence on the Horizon?

  • 21 Nov 2017
  • By Erik Norland
  • Topics: Economic Events

There is considerable change underway in Saudi Arabia, from how the country is governed and managed to an even more activist role in the politics of the volatile Middle East. Options markets, however, appear to be almost entirely unconcerned about recent developments in the country, the world’s largest exporter of crude oil and a key U.S. ally in the Middle East.

At-the-money implied volatility on West Texas Intermediate (WTI) Crude Oil options has been trading near its lowest point since late 2014 and is well below its long-term average.  For example, on November 17, 90-day WTI options closed at 23% implied volatility, well below their 31% average so far this decade (Figure 1).  Are markets too complacent in the face of potential political disruption in Saudi Arabia and its neighboring countries. READ THE REST

Continue reading “Saudi Arabia, Crude Oil and Futures Trading Levels for 11.30.2017”

Big day on the last trading day of the month tomorrow! 11.30.2016

Connect with Us! Use Our Futures Trading Levels and Economic Reports RSS Feed.

Like us on FacebookFollow us on TwitterView our profile on LinkedInFind us on Google+Cannon Trading Futures Trading Resistance & Support Levels and Economic ReportsFind us on Yelp

In today’s blog, note about tomorrow’s full day of reports, changes to Russell contract size, reminder of current front months

Dear Traders,

Looking at the schedule for tomorrow – BIG day ahead.

We have OPEC, Crude Oil report, Beige book, ADP employment report, CPI and much more.

Check the calendar on section 3 of this blog. Set alarms. Know which reports affect the markets you trade so you don’t get caught in one of those moments where you yell ” What the heck just happened??

Effective on trade date Monday, December 5th,  ICE Futures US will change the contract size for mini Russell 2000:

Mini Russell 2000 used to be that one point  was $100 or 1 tick was $10. As of next Monday, one point will be worth $50 and each tick will be $5.

Assigned Deliveries can be a very costly process to try and reverse…..make sure you are trading the correct months:

  • Front month for Gold is February.
  • Silver front month is March.
  • Front month for most grains is March.
  • Crude oil and Natural gas are January.

If you enjoy our blog and the information we share, please vote for us as #1 under the “Blog Section” and provide us with the strength and energy to continue and providing you with the best tips and information on this blog!!

You can vote daily, both for the blog and for Cannon Brokerage services!!

Vote here

Continue reading “Big day on the last trading day of the month tomorrow! 11.30.2016”

Getting Stopped Out on the Highs and Lows? Read This Article….11-18-2016

Connect with Us! Use Our Futures Trading Levels and Economic Reports RSS Feed.

Like us on FacebookFollow us on TwitterView our profile on LinkedInFind us on Google+Cannon Trading Futures Trading Resistance & Support Levels and Economic ReportsFind us on Yelp

1. Market Commentary
2. Futures Support and Resistance Levels – S&P, Nasdaq, Dow Jones, Russell 2000, Dollar Index
3. Commodities Support and Resistance Levels – Gold, Euro, Crude Oil, T-Bonds
4. Commodities Support and Resistance Levels – Corn, Wheat, Beans, Silver
5. Futures Economic Reports for Friday November 18, 2016

Greetings!

Dear Traders,

Many of you shared with me how frustrated you get when you get stopped out only to see the market goes back to where you wanted it to or positioned for….

This article by my colleague John Thorpe, talks about using weekly mini SP 500 options and can be applied to  gold, bonds, crude oil and other markets that have weekly options.  Must read.

Weekly Mini S&P option contracts

There are 100’s of indicators available to traders to assist with decision making that can be applied to technical analysis, which is precisely the reason to utilize a sound and inexpensive weekly ES strategy to compliment a day trading strategy.

There are two main uses for the Weekly options
  1. As a hedge, no need for stops
  2. As a pure speculation. A relatively inexpensive way to speculate on market direction in a time frame that can be for minutes, hours or a few days without the need to use stops.

Read the full article!

Continue reading “Getting Stopped Out on the Highs and Lows? Read This Article….11-18-2016”