Crude Oil Futures Flirts with $60 Mark for First Time in Over 30 Months

____________________________________________________________________

Voted #1 Blog and #1 Brokerage Services on TraderPlanet for 2016!!  

____________________________________________________________________

Dear Traders,

Trading was MUCH lighter today than normal…mini SP volume is normally above 1,000,000 contracts per day. Today volume was approx. 300000.

I suspect the lower volume to continue until next Tuesday when we start trading for 2018.

Don’t confuse low volume with “dead price action”. The lower volume can sometimes help exaggerate price moves when certain news or events take place.

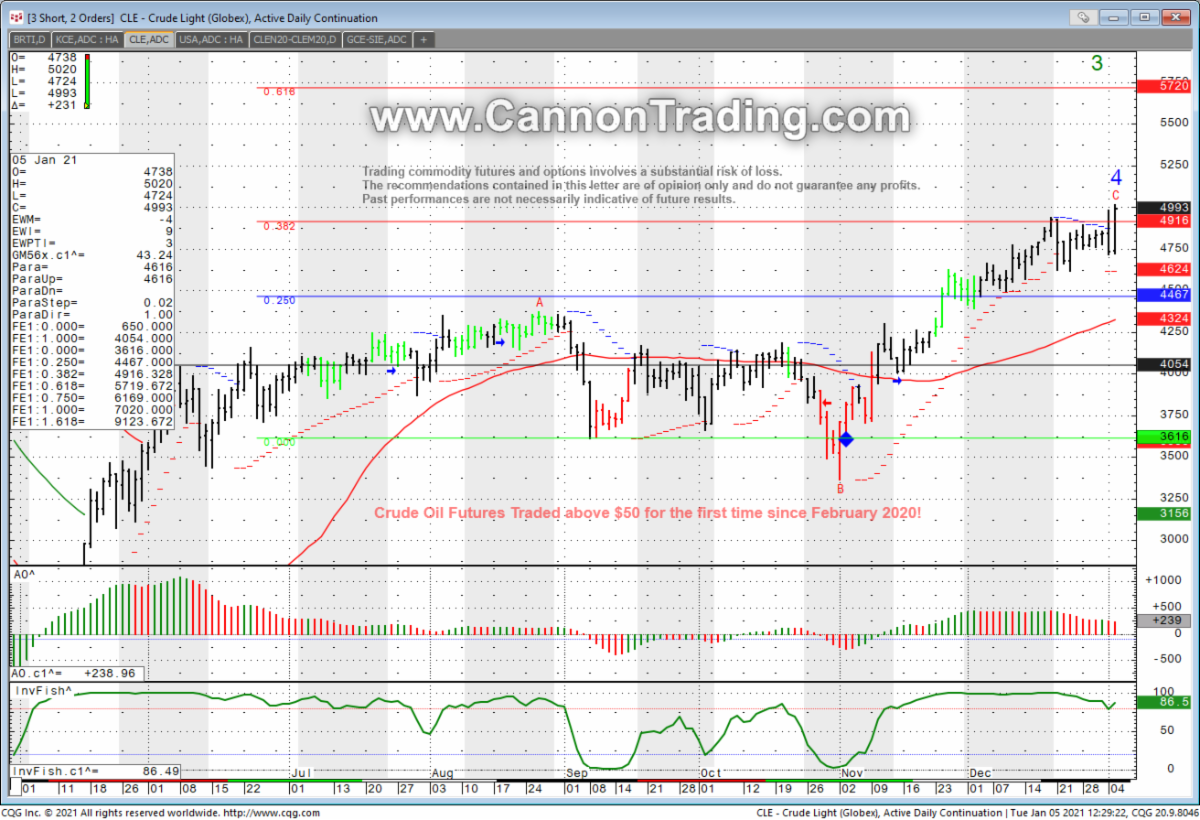
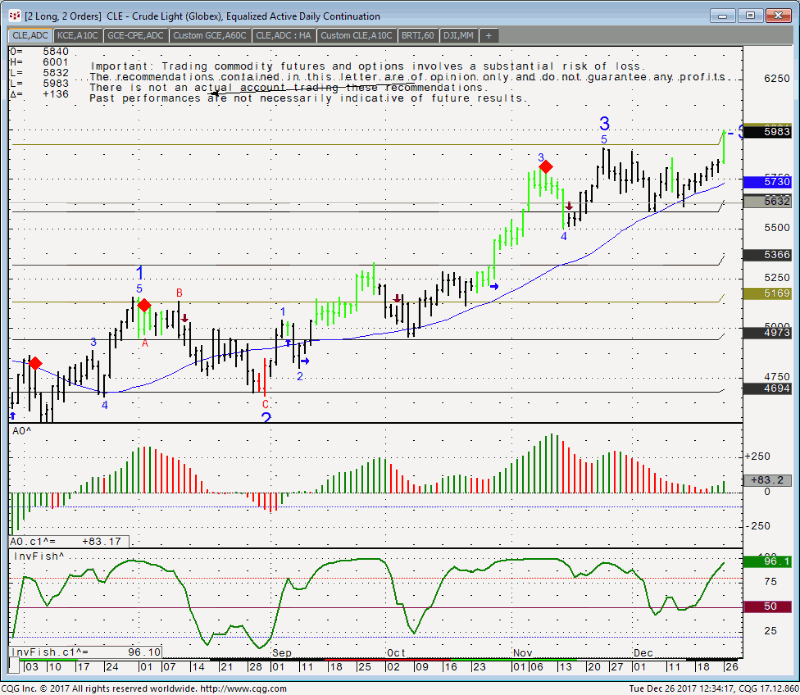
The market of today, was definitely crude oil (yes not bitcoin futures this time…). The front month, February touched 60.01 for the first time in
months, maybe couple of years…

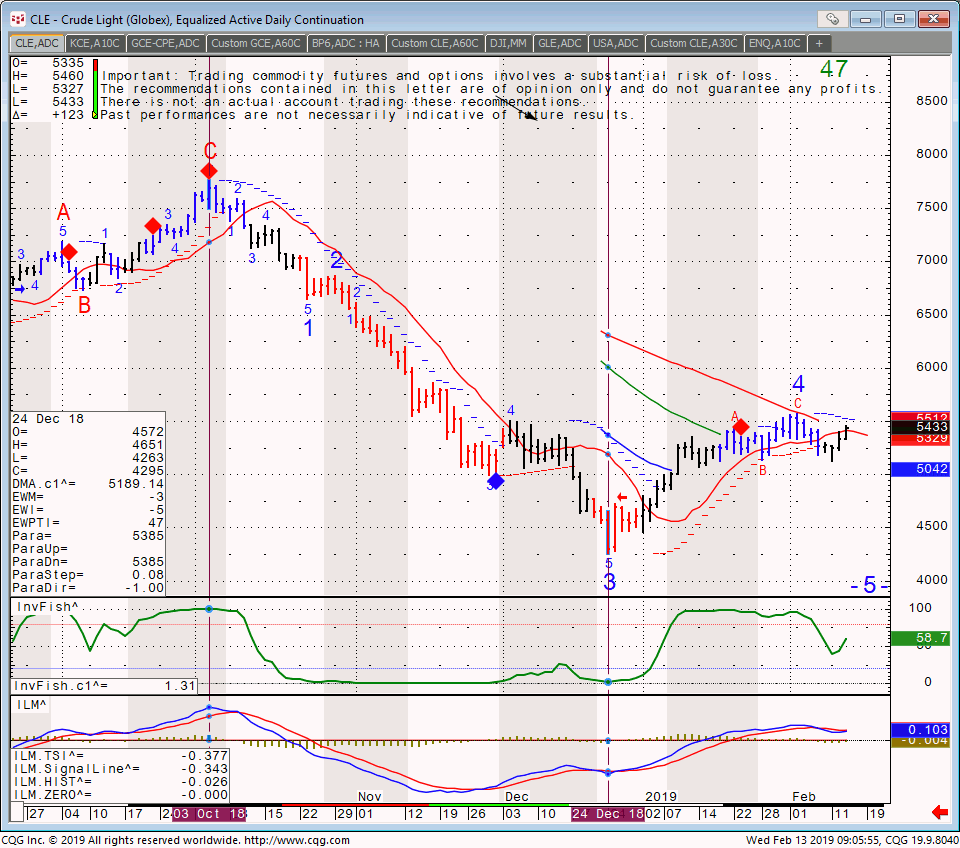
Daily chart for review below:

Crude Light(Globex), Equalized Active Daily Continuation Daily Chart

Continue reading “Crude Oil Futures Flirts with $60 Mark for First Time in Over 30 Months”

Saudi Arabia, Crude Oil and Futures Trading Levels for 11.30.2017

____________________________________________________________________

Voted #1 Blog and #1 Brokerage Services on TraderPlanet for 2016!!  

____________________________________________________________________

Dear Traders,

Front month for Silver and most grains is now March.

Front month for gold is now February.

Front month for bonds and other interest futures is now March 2018. 

Saudi Arabia: Turbulence on the Horizon?

  • 21 Nov 2017
  • By Erik Norland
  • Topics: Economic Events

There is considerable change underway in Saudi Arabia, from how the country is governed and managed to an even more activist role in the politics of the volatile Middle East. Options markets, however, appear to be almost entirely unconcerned about recent developments in the country, the world’s largest exporter of crude oil and a key U.S. ally in the Middle East.

At-the-money implied volatility on West Texas Intermediate (WTI) Crude Oil options has been trading near its lowest point since late 2014 and is well below its long-term average.  For example, on November 17, 90-day WTI options closed at 23% implied volatility, well below their 31% average so far this decade (Figure 1).  Are markets too complacent in the face of potential political disruption in Saudi Arabia and its neighboring countries. READ THE REST

Continue reading “Saudi Arabia, Crude Oil and Futures Trading Levels for 11.30.2017”

Big day on the last trading day of the month tomorrow! 11.30.2016

Connect with Us! Use Our Futures Trading Levels and Economic Reports RSS Feed.

Like us on FacebookFollow us on TwitterView our profile on LinkedInFind us on Google+Cannon Trading Futures Trading Resistance & Support Levels and Economic ReportsFind us on Yelp

In today’s blog, note about tomorrow’s full day of reports, changes to Russell contract size, reminder of current front months

Dear Traders,

Looking at the schedule for tomorrow – BIG day ahead.

We have OPEC, Crude Oil report, Beige book, ADP employment report, CPI and much more.

Check the calendar on section 3 of this blog. Set alarms. Know which reports affect the markets you trade so you don’t get caught in one of those moments where you yell ” What the heck just happened??

Effective on trade date Monday, December 5th,  ICE Futures US will change the contract size for mini Russell 2000:

Mini Russell 2000 used to be that one point  was $100 or 1 tick was $10. As of next Monday, one point will be worth $50 and each tick will be $5.

Assigned Deliveries can be a very costly process to try and reverse…..make sure you are trading the correct months:

  • Front month for Gold is February.
  • Silver front month is March.
  • Front month for most grains is March.
  • Crude oil and Natural gas are January.

If you enjoy our blog and the information we share, please vote for us as #1 under the “Blog Section” and provide us with the strength and energy to continue and providing you with the best tips and information on this blog!!

You can vote daily, both for the blog and for Cannon Brokerage services!!

Vote here

Continue reading “Big day on the last trading day of the month tomorrow! 11.30.2016”

Getting Stopped Out on the Highs and Lows? Read This Article….11-18-2016

Connect with Us! Use Our Futures Trading Levels and Economic Reports RSS Feed.

Like us on FacebookFollow us on TwitterView our profile on LinkedInFind us on Google+Cannon Trading Futures Trading Resistance & Support Levels and Economic ReportsFind us on Yelp

1. Market Commentary
2. Futures Support and Resistance Levels – S&P, Nasdaq, Dow Jones, Russell 2000, Dollar Index
3. Commodities Support and Resistance Levels – Gold, Euro, Crude Oil, T-Bonds
4. Commodities Support and Resistance Levels – Corn, Wheat, Beans, Silver
5. Futures Economic Reports for Friday November 18, 2016

Greetings!

Dear Traders,

Many of you shared with me how frustrated you get when you get stopped out only to see the market goes back to where you wanted it to or positioned for….

This article by my colleague John Thorpe, talks about using weekly mini SP 500 options and can be applied to  gold, bonds, crude oil and other markets that have weekly options.  Must read.

Weekly Mini S&P option contracts

There are 100’s of indicators available to traders to assist with decision making that can be applied to technical analysis, which is precisely the reason to utilize a sound and inexpensive weekly ES strategy to compliment a day trading strategy.

There are two main uses for the Weekly options
  1. As a hedge, no need for stops
  2. As a pure speculation. A relatively inexpensive way to speculate on market direction in a time frame that can be for minutes, hours or a few days without the need to use stops.

Read the full article!

Continue reading “Getting Stopped Out on the Highs and Lows? Read This Article….11-18-2016”

Oil outlook by Erik Nolan of the CME group 10.28.2016

Connect with Us! Use Our Futures Trading Levels and Economic Reports RSS Feed.

Like us on FacebookFollow us on TwitterView our profile on LinkedInFind us on Google+Cannon Trading Futures Trading Resistance & Support Levels and Economic ReportsFind us on Yelp

1. Market Commentary
2. Futures Support and Resistance Levels – S&P, Nasdaq, Dow Jones, Russell 2000, Dollar Index
3. Commodities Support and Resistance Levels – Gold, Euro, Crude Oil, T-Bonds
4. Commodities Support and Resistance Levels – Corn, Wheat, Beans, Silver
5. Futures Economic Reports for Friday October 28, 2016

Greetings!

Good read by the CME about oil prices:

Oil: Tell-Tale Signs in U.S. Inventories

  • 25 Oct 2016
  • By Erik Norland
  • Topics: Energy

For those hoping for a sustained rebound in oil prices, U.S. inventories might present a mixed picture.  First the bad news: crude oil inventories are still near record high levels and are continuing to rise on a year-on-year basis.  Gasoline and ultra-low sulfur diesel (ULSD) inventories are also increasing year on year but to a lesser extent.  Inventories of all three remain near seasonally-adjusted record highs.

The good news is that the pace of inventory accumulation is slowing rapidly.  For a while in 2015, crude oil inventories were rising as much as 31% year on year.  Currently, they are just 5% greater than a year ago (Figure 2).  Gasoline inventories are up about 4% from last year while ULSD inventories are up about 7% from a year ago.  At their peak rate of increase, gasoline inventories rose at about 11% year on year, while ULSD inventories increased by as much as 27% year on year.

Read the rest along with graphs and charts.

Continue reading “Oil outlook by Erik Nolan of the CME group 10.28.2016”

Crude Oil Volatility and Chart 9.29.2016

Connect with Us! Use Our Futures Trading Levels and Economic Reports RSS Feed.

Like us on FacebookFollow us on TwitterView our profile on LinkedInFind us on Google+Cannon Trading Futures Trading Resistance & Support Levels and Economic ReportsFind us on Yelp

1. Market Commentary
2. Futures Support and Resistance Levels – S&P, Nasdaq, Dow Jones, Russell 2000, Dollar Index
3. Commodities Support and Resistance Levels – Gold, Euro, Crude Oil, T-Bonds
4. Commodities Support and Resistance Levels – Corn, Wheat, Beans, Silver
5. Futures Economic Reports for Thursday September 29, 2016

Greetings!

What a volatile day in the energy sector…..

We started with the energy report sending prices much lower only to get some reports on agreement between some of the oil producing countries to limit production…..

Buy the rumor sell the fact?

time will tell but if you are trading energies be aware of the news and adjust your trading as volatility expands like it just did…..

Daily chart of Crude Oil for fun….

Crude Oil Chart

Crude Oil Numbers Tomorrow 9.28.2016

Connect with Us! Use Our Futures Trading Levels and Economic Reports RSS Feed.

Like us on FacebookFollow us on TwitterView our profile on LinkedInFind us on Google+Cannon Trading Futures Trading Resistance & Support Levels and Economic ReportsFind us on Yelp

1. Market Commentary
2. Futures Support and Resistance Levels – S&P, Nasdaq, Dow Jones, Russell 2000, Dollar Index
3. Commodities Support and Resistance Levels – Gold, Euro, Crude Oil, T-Bonds
4. Commodities Support and Resistance Levels – Corn, Wheat, Beans, Silver
5. Futures Economic Reports for Wednesday September 28, 2016

Greetings!

We have a full day tomorrow!

Crude Oil numbers, Fed. members speaking, Draghi speaking, durable goods….

I wrote before on trading or not trading during big numbers.
Each of you is a different person, different trader and hence the importance of keeping a personal trading journal. If you trade crude oil, you will be able to look back at your journal and decide if to trade or not during crude numbers and read from past weekly reprots which will greatly help you preparing for tomorrow report.

Crude Oil and Mini SP 500 Charts – Sitting on Major Support! 9.15.2016

Connect with Us! Use Our Futures Trading Levels and Economic Reports RSS Feed.

Like us on FacebookFollow us on TwitterView our profile on LinkedInFind us on Google+Cannon Trading Futures Trading Resistance & Support Levels and Economic ReportsFind us on Yelp

1. Market Commentary
2. Futures Support and Resistance Levels – S&P, Nasdaq, Dow Jones, Russell 2000, Dollar Index
3. Commodities Support and Resistance Levels – Gold, Euro, Crude Oil, T-Bonds
4. Commodities Support and Resistance Levels – Corn, Wheat, Beans, Silver
5. Futures Economic Reports for Thursday September 15, 2016

Greetings!

No words of wisdom today…so instead two charts of two markets that are sitting or very close to major support.

First is the mini SP 500, followed by Crude Oil.

Mini SP 500 Daily Chart

Mini SP 500 Daily Chart

Crude Oil Daily Chart

Crude Oil Daily Chart

If you need help, feel like chatting markets or getting feedback  – we are here!

Continue reading “Crude Oil and Mini SP 500 Charts – Sitting on Major Support! 9.15.2016”

Crude Oil Outlook 8.26.2016

Connect with Us! Use Our Futures Trading Levels and Economic Reports RSS Feed.

Like us on FacebookFollow us on TwitterView our profile on LinkedInFind us on Google+Cannon Trading Futures Trading Resistance & Support Levels and Economic ReportsFind us on Yelp

1. Market Commentary
2. Futures Support and Resistance Levels – S&P, Nasdaq, Dow Jones, Russell 2000, Dollar Index
3. Commodities Support and Resistance Levels – Gold, Euro, Crude Oil, T-Bonds
4. Commodities Support and Resistance Levels – Corn, Wheat, Beans, Silver
5. Futures Economic Reports for Friday August 26, 2016

Hello Traders,

Greetings!

Crude Oil Futures Are Reaching a Decision Point
I like the potential of being bullish on crude oil futures for next few weeks! Here are a few ways you can do this:

dc8a94b4 3fc7 11e6 a396

Crude oil futures have been providing quite a bit of excitement the last few months. Most traders, myself included, like excitement when it comes to trading. It means two things: opportunities and risks.

The recent pullback in crude oil future prices present a buying opportunity, in my opinion.

Looking at the daily chart of crude oil below, you will see that I marked what I feel should be a support level for resumption of the upside move.

Read the Rest of the article along with charts here

Continue reading “Crude Oil Outlook 8.26.2016”