2 Important Updates: Bear Market Rally, June Canadian Dollar

9dc1e02e d5f7 4ff4 abf7 1df60775f196

Bear Market Rally?

June Canadian Dollar updates

bear market

A week of impactful earnings reports (2242 globally) as the Bear market rally continues,

by John Thorpe, Senior Broker

Please speak with your broker about ways that you may not be aware of to assist you with your risk management plans. They may surprise you with the creative solutions you may find more efficient than simple stop orders or the old “hand on the mouse blow yourself out” strategy.

Bear Market

Market volatility is here to stay for the foreseeable future

Choose your opportunities wisely in this Bear Market.

Economists are expecting the first look at US 1Q 2025 GDP to show the economy grew +0.4% on quarter over quarter terms. The advanced 1Q 2025 chain weighted price index is expected up +3.0% and compares with the 4Q 2024 at +2.3%. The data will be released at 7:30 am CT Wednesday morning.

Bear Market Updates

Mini Dow’s range today? 482 points $value? = $2410.00 from hi to lo

Mini S & P’s range today? 75.75 points $ Value? = $3787.50 from hi to lo

Mini Nasdaq’s range today? 310.50 points $value? = $6210.00 from hi to lo

Tomorrow – Last trading Day of the month! President Trump may be speaking during market hours:

Econ Data:  Core PCE, ADP, GDP first look Q1, Chicago PMI , Pending home sales, EIA Energy stocks.

FED Speak: Blackout period

Earnings: Microsoft, Meta, Qualcomm, Caterpillar

Tariff news: Anything goes!

That’s a Bear Market for you!

S

1bb0c235 06f8 40ab 9e8e 4a1740988236

June Canadian Dollar

The June CAD established a bottom in February and recently activated upside PriceCounts off the lows. The chart is now taking aim at its first upside target in the .7320 area.

e6d98658 301e 4cbb 8f21 d767609cf831

The PriceCount study is a tool that can help to project the distance of a move in price. The counts are not intended to be an ‘exact’ science but rather offer a target area for the four objectives which are based off the first leg of a move with each subsequent count having a smaller percentage of being achieved.

It is normal for the chart to react by correcting or consolidating at an objective and then either resuming its move or reversing trend. Best utilized in conjunction with other technical tools, PriceCounts offer one more way to analyze charts and help to manage your positions and risk.

Learn more at www.qtchartoftheday.com

Trading in futures, options, securities, derivatives or OTC products entails significant risks which must be understood prior to trading and may not be appropriate for all investors. Past performance of actual trades or strategies is not necessarily indicative of future results.

Daily Levels for April 30th, 2025

e46e1053 5d9d 472f 99a1 ef75ba1c863d
Want to feature our updated trading levels on your website? Simply paste a small code, and they’ll update automatically every day! Click here for quick and easy instructions.
822b33c5 2339 45ed bc84 e9c8f8c7358e

Economic Reports

provided by: ForexFactory.com

All times are Eastern Time (New York)

085fbb72 9a1f 4a83 8ca7 095bc4bc5f5c

Find us on Trustpilot

stars

Trading Futures, Options on Futures, and retail off-exchange foreign currency transactions involves substantial risk of loss and is not suitable for all investors. You should carefully consider whether trading is suitable for you in light of your circumstances, knowledge, and financial resources. You may lose all or more of your initial investment. Opinions, market data, and recommendations are subject to change at any time.

Call Now

Join our Private Facebook group

Subscribe to our YouTube Channel

Listen to our podcast: Subscribe on AppleSpotify, Amazon

or wherever you listen to podcasts!

S
Facebook  Instagram  LinkedIn
S
ef3ab1c9 8d6d 4e60 a3f1 af5d9d4ecbb3
Services
Software
Tools
Community
Contact

Futures Trading Platform Sierra Charts

Sierra Charts is widely regarded as one of the best futures trading platforms available today. Known for its depth, precision, and robust customization, Sierra Chart software is built for traders who value speed, stability, and flexibility in their charting and order execution. Whether you’re a new entrant exploring the world of trading futures or a seasoned institutional trader looking for a powerful toolset, Sierra Charts is designed to meet your needs with professional-grade features.

Try a FREE DEMO!

Cannon Trading Company stands out as the ideal brokerage partner for users of Sierra Charts, offering decades of experience, unmatched client support, and a suite of benefits that enhance every trader’s workflow.

Overview of Sierra Charts

Sierra Chart software is a high-performance, low-latency platform tailored for futures trading. It delivers a comprehensive solution with advanced technical analysis tools, real-time market data, and support for automated trading systems. Developed with an emphasis on efficiency and control, Sierra Charts is not only an institutional trading platform but also accessible to independent traders who demand performance.

Key Advantages:

  • True Tick-by-Tick Data: Allows ultra-accurate historical and real-time charting.
  • Advanced Charting Tools: Hundreds of studies, indicators, and custom scripting options.
  • Order Flow Analysis: DOM, TPO profiles, volume profile, and footprint charts.
  • Low-Latency Execution: Built for speed with server-side bracket orders and direct connections to leading data feeds.
  • Unmatched Customization: From chart styles to keyboard shortcuts, nearly everything is user-configurable.

With support for multiple data providers and brokers, Sierra Charts positions itself as a true institutional trading platform with appeal across the professional spectrum.

10 Expert Tips & Tricks for Sierra Charts Users

  1. Utilize Study Subgraphs for Conditional Alerts
    Create visual and audible alerts when specific study conditions are met. For instance, use moving average crossovers to trigger signals, which is invaluable for trading futures reactively.
  1. Save Chartbooks by Market Segment
    Organize your workspace by separating chartbooks (e.g., one for equity indices, one for energies). This improves load times and keeps your Sierra Chart software streamlined.
  1. Master Global Drawing Tools
    Annotate your charts with precision and have them appear across all charts for the same symbol—critical when trading across timeframes in futures trading.
  1. Use Spreadsheet Systems for Custom Strategies
    Leverage Sierra Charts’ built-in spreadsheet functions to build custom automated strategies without writing code. This is perfect for advanced yet code-averse Sierra Charts users.
  1. Enable Volume-by-Price for Order Flow Insights
    Use this tool to detect high-activity price zones and potential reversal points. Sierra Chart software gives deep insights that are usually reserved for high-end institutional trading platforms.
  1. Customize the Trade DOM for Speed
    Tailor the DOM interface with custom columns, color settings, and quick buttons—vital for scalpers and short-term futures trading strategies.
  1. Utilize Replay Mode for Trade Reviews
    Sierra Charts’ replay mode lets you run past market sessions in real-time speed. This is perfect for backtesting and refining your trading futures skills.
  1. Implement Attached Orders with OCO/OSO Logic
    Use server-side OCO (One Cancels Other) and OSO (Order Sends Order) orders to safeguard your trades with automated stops and targets.
  1. Keyboard Shortcuts for Order Execution
    Set hotkeys for entering/exiting trades to streamline execution—a time-saver during fast markets on this best futures trading platform.
  1. Automate Chart Backups to Prevent Data Loss
    Set up automatic chartbook and settings backups to prevent data loss. With Sierra Charts, your entire trading environment can be recovered with ease.

Try a FREE DEMO!

Why Cannon Trading Company Is the Ideal Sierra Charts Partner

Platform Sierra Charts

Platform Sierra Charts

Cannon Trading Company is uniquely positioned to support Sierra Charts users for several compelling reasons:

Decades of Experience

With over 35 years in the industry, Cannon Trading is one of the most trusted names in futures trading. Their deep expertise ensures clients receive insightful guidance for both platform use and market strategies.

Stellar Reputation

The firm boasts a near-perfect TrustPilot rating, with many reviews applauding its fast support and knowledgeable brokers—ideal for trading futures confidently.

Regulatory Excellence

Cannon Trading has maintained an exemplary record with regulators, giving traders peace of mind that they are working with a reliable and transparent partner.

Diverse Platform Suite

In addition to Sierra Chart software, Cannon Trading provides access to a top-tier selection of platforms including CTS T4, Firetip, Rithmic, and more—cementing its reputation as a leader in best futures trading platform solutions.

Try a FREE DEMO!

Whether you’re a short-term scalper or a long-term trend trader, Sierra Charts delivers a versatile, robust, and high-performance experience that meets the demands of modern futures trading. When paired with the trusted, experienced team at Cannon Trading Company, you gain not only the tools but also the support to take your trading futures journey to the next level.

From institutional-grade features to tailored service, the synergy between Sierra Chart software and Cannon Trading is unmatched in the industry.

For more information, click here.

Ready to start trading futures? Call us at 1(800)454-9572 (US) or (310)859-9572 (International), or email info@cannontrading.com to speak with one of our experienced, Series-3 licensed futures brokers and begin your futures trading journey with Cannon Trading Company today.

Disclaimer: Trading Futures, Options on Futures, and retail off-exchange foreign currency transactions involve substantial risk of loss and are not suitable for all investors. Past performance is not indicative of future results. Carefully consider if trading is suitable for you in light of your circumstances, knowledge, and financial resources. You may lose all or more of your initial investment. Opinions, market data, and recommendations are subject to change at any time.

Important: Trading commodity futures and options involves a substantial risk of loss. The recommendations contained in this article are opinions only and do not guarantee any profits. This article is for educational purposes. Past performances are not necessarily indicative of future results.

This article has been generated with the help of AI Technology and modified for accuracy and compliance.

Follow us on all socials: @cannontrading

Futures Trading Platform RTrader Pro

The Trader/Rithmic Futures Trading Platform has emerged as one of the leading solutions for active futures traders seeking high-performance market connectivity, advanced order execution, and precise risk management tools. Known for its ultra-low latency and institutional-grade technology, this platform is powered by Rithmic, a prominent name in the industry offering direct market access and high-fidelity data feeds. Whether you’re an individual retail trader or a professional prop firm operator, the Trader/Rithmic suite, especially RTrader Pro, equips you with powerful tools to navigate volatile futures markets effectively.

Understanding the Trader/Rithmic Ecosystem

At the core of the Trader/Rithmic Futures Trading Platform is the Rithmic infrastructure—a robust trading engine that delivers real-time market data and trade execution with minimal latency. Rithmic provides API solutions, enabling seamless integration with various charting and order execution platforms. Traders using the Trader/Rithmic system can access a vast network of exchanges with direct market routing capabilities, ensuring that their orders are executed at top speed and accuracy.

Try a FREE demo!

The platform is often accessed through RTrader Pro, Rithmic‘s flagship graphical user interface. RTrader Pro is designed to deliver an advanced trading experience with real-time P&L tracking, automated trading support, and customizable market views. Together, Rithmic, Trader/Rithmic, and RTrader Pro form a comprehensive ecosystem that supports a wide array of futures trading strategies.

RTrader Pro

RTrader Pro

Key Features of the Trader/Rithmic Futures Trading Platform

Below are the most important features that make the Trader/Rithmic Futures Trading Platform a top-tier choice for futures traders:

  1. Ultra-Low Latency Market Data
    Rithmic is renowned for its lightning-fast market data feed, crucial for high-frequency traders and scalpers. The data is delivered in real-time, with minimal delay, allowing traders to react swiftly to market movements. The low-latency environment also enhances the effectiveness of algorithmic trading strategies. Many traders choose the Trader/Rithmic Futures Trading Platform precisely for this reason.
  1. Direct Market Access (DMA)
    Through Rithmic, traders get direct access to major futures exchanges such as CME, CBOT, NYMEX, ICE, and more. This direct connectivity reduces slippage and provides better price transparency. DMA is a critical feature for professional traders using the Trader/Rithmic infrastructure. Additionally, RTrader Pro makes it easy to manage orders and execution across multiple venues seamlessly.
  1. Advanced Order Types
    The Trader/Rithmic Futures Trading Platform supports complex order types such as OCO (One Cancels Other), OSO (Order Sends Order), trailing stops, and bracket orders. These tools, especially when accessed via RTrader Pro, offer nuanced control over trade execution and risk management. Traders who automate strategies will find RTrader Pro highly accommodating to their needs.
  1. Real-Time Risk Management and Account Monitoring
    RTrader Pro provides granular control over margin usage, real-time position tracking, and order history. Rithmic servers continuously monitor trades for risk limits and margin compliance, ensuring that traders stay within safe operational parameters. This is particularly useful for firms managing multiple accounts or using automated risk control parameters.

Try a FREE demo!

  1. Server-Side Order Execution
    The platform supports server-side order execution, meaning that stop and limit orders are held on the Rithmic server rather than on the client terminal. This minimizes the chance of order failure due to connectivity issues and offers a more robust trading environment. Combined with RTrader Pro, traders can trust that their risk strategies will be executed without interruption.
  1. High-Fidelity Simulation Mode
    The Trader/Rithmic platform offers a simulation mode that mirrors real market conditions, including latency and slippage. This allows traders to test strategies using live market data without risking capital—ideal for both new traders and experienced professionals fine-tuning automated systems. Using RTrader Pro, this simulation becomes even more accurate and user-friendly.
  1. Multi-Platform Integration
    Thanks to Rithmic’s API offerings, the platform integrates easily with third-party charting tools like NinjaTrader, MultiCharts, Sierra Chart, and more. This flexibility makes the Trader/Rithmic Futures Trading Platform a versatile hub for diverse trading styles. RTrader Pro acts as a foundational interface, while traders benefit from the wide selection of charting and analysis options.
  1. Trade Journal and Analytics Tools
    Another underrated feature of RTrader Pro is its ability to provide detailed trade journaling and analytical tools. The platform tracks each executed trade, offering reports that help traders review performance metrics such as win rate, drawdown, and average trade duration. These insights are valuable for refining strategies and understanding personal trading behaviors.
  1. Custom Alerts and Notifications
    The Trader/Rithmic Futures Trading Platform enables users to set up custom alerts based on price movement, volume spikes, or specific order activity. These alerts, available through RTrader Pro, can be configured to notify via sound, popup, or even external integrations. This proactive alerting system ensures that traders never miss key trading opportunities.
  1. Robust Security and Reliability
    Security is paramount in any trading environment. Rithmic employs encrypted data streams and secure login protocols to ensure the safety of client data and trades. Moreover, RTrader Pro features automatic backup and restore options, session logging, and reconnection functionalities that maintain trading continuity during disconnections or platform errors.

Use Cases Across Trader Profiles

The Trader/Rithmic Futures Trading Platform caters to a wide spectrum of trading profiles:

  • Retail Day Traders benefit from real-time price updates, order speed, and user-friendly design.
  • Professional Prop Traders utilize the platform’s robust risk controls and multi-account support.
  • Algorithmic Traders value the high-speed APIs and back-testing support.
  • Educators and Mentors use the simulation and journaling features to train new traders.

RTrader Pro provides an intuitive interface that bridges these user types with the depth of the Rithmic infrastructure.

The Trader/Rithmic Futures Trading Platform is a high-performance solution tailored for futures market participants who demand speed, precision, and flexibility. Powered by Rithmic’s advanced infrastructure and complemented by RTrader Pro’s user-centric design, this platform caters to the full spectrum of trading needs—from day trading to algorithmic execution.

Try a FREE demo!

Whether you’re a retail trader seeking an edge or a professional managing multiple accounts, the Trader/Rithmic platform delivers the tools and technology required to thrive in today’s fast-paced futures markets.

For more information, click here.

Ready to start trading futures? Call us at 1(800)454-9572 – Int’l (310)859-9572 (International), or email info@cannontrading.com to speak with one of our experienced, Series-3 licensed futures brokers and begin your futures trading journey with Cannon Trading Company today.

Disclaimer: Trading Futures, Options on Futures, and retail off-exchange foreign currency transactions involve substantial risk of loss and are not suitable for all investors. Past performance is not indicative of future results. Carefully consider if trading is suitable for you in light of your circumstances, knowledge, and financial resources. You may lose all or more of your initial investment. Opinions, market data, and recommendations are subject to change at any time.

Important: Trading commodity futures and options involves a substantial risk of loss. The recommendations contained in this article are opinions only and do not guarantee any profits. This article is for educational purposes. Past performances are not necessarily indicative of future results.

This article has been generated with the help of AI Technology and modified for accuracy and compliance.

Follow us on all socials: @cannontrading

July Corn, 3 Powerful Insights from Corn’s Easter Rally: What Traders Need to Know Now

9dc1e02e d5f7 4ff4 abf7 1df60775f196

Markets are Closed Tomorrow!

Markets are closed tomorrow!! July Corn!

Trading Corn Futures

See Good Friday Schedule below.

S

Good Friday Modified Trading Schedule

This coming Friday, April 18th is Good Friday.

Please see below the modified trading schedule for Good Friday and Easter for CME and ICE exchanges

For the full schedule and details: click here.

b74b2ac0 386c 40d5 9667 eaf8476070ac

July Corn

00242896 171b 4248 a2d1 2d957e8750d7


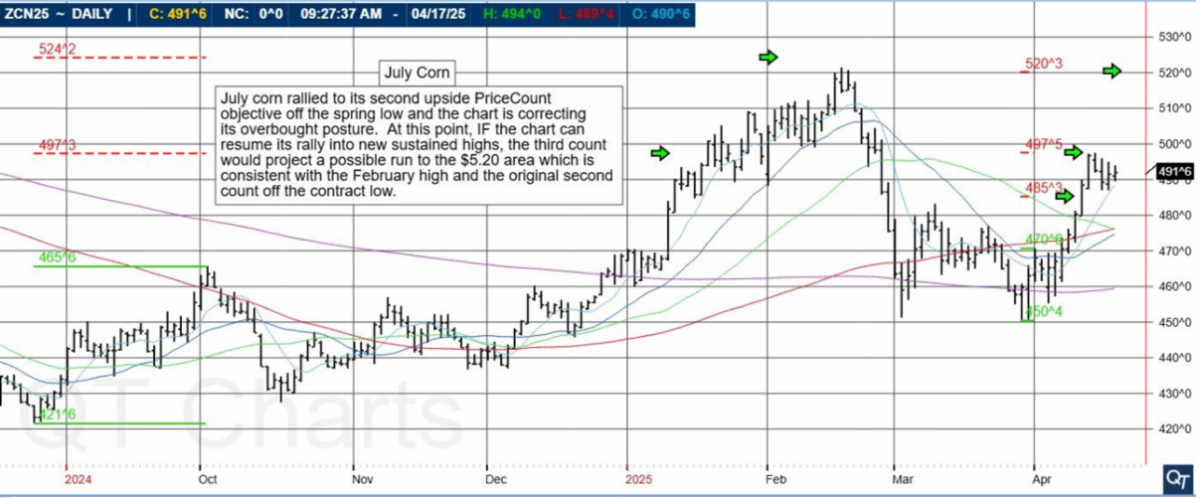
July corn rallied to its second upside PriceCount objective off the spring low and the chart is correcting its overbought posture. At this point, IF the chart can resume its rally into new sustained highs, the third count would project a possible run to the $5.20 area which is consistent with the February high and the original second count off the contract low.

Corn

The PriceCount study is a tool that can help to project the distance of a move in price. The counts are not intended to be an ‘exact’ science but rather offer a target area for the four objectives which are based off the first leg of a move with each subsequent count having a smaller percentage of being achieved.

It is normal for the chart to react by correcting or consolidating at an objective and then either resuming its move or reversing trend. Best utilized in conjunction with other technical tools, PriceCounts offer one more way to analyze charts and help to manage your positions and risk.

Learn more at www.qtchartoftheday.com

Trading in futures, options, securities, derivatives or OTC products entails significant risks which must be understood prior to trading and may not be appropriate for all investors. Past performance of actual trades or strategies is not necessarily indicative of future results.
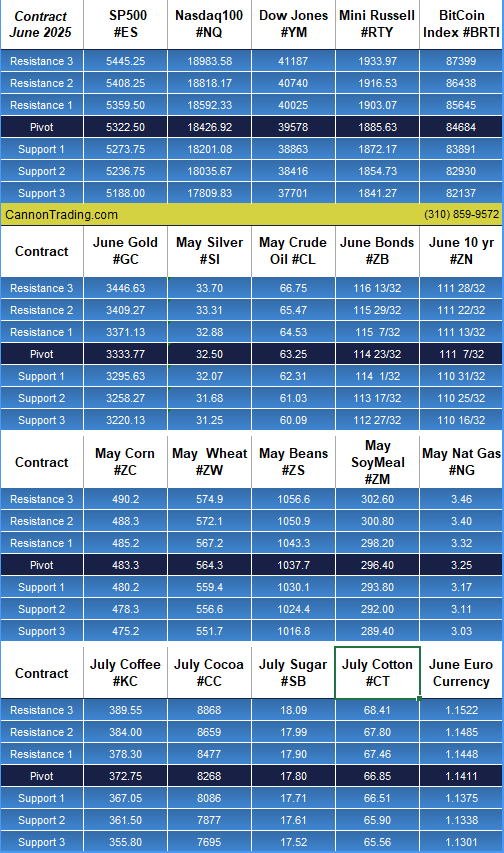
Daily Levels for April 21st, 2025

755651cf 0ad9 43b6 997c 6426aa524f44

Want to feature our updated trading levels on your website? Simply paste a small code, and they’ll update automatically every day! 

Click here for quick and easy instructions.

822b33c5 2339 45ed bc84 e9c8f8c7358e

Economic Reports

provided by: ForexFactory.com

All times are Eastern Time (New York)

e1947f77 17a7 499f 9411 00382cf562b6

Find us on Trustpilot

stars

Trading Futures, Options on Futures, and retail off-exchange foreign currency transactions involves substantial risk of loss and is not suitable for all investors. You should carefully consider whether trading is suitable for you in light of your circumstances, knowledge, and financial resources. You may lose all or more of your initial investment. Opinions, market data, and recommendations are subject to change at any time.

Call Now

Join our Private Facebook group

Subscribe to our YouTube Channel

Listen to our podcast: Subscribe on AppleSpotify, Amazon

or wherever you listen to podcasts!

S
Facebook  Instagram  LinkedIn
S
ef3ab1c9 8d6d 4e60 a3f1 af5d9d4ecbb3
Services
Software
Tools
Community
Contact


Nasdaq, Mini Dow, Mini S&P: Avoid These 4 Costly Mistakes in a $10,545 Nasdaq Whipsaw

9dc1e02e d5f7 4ff4 abf7 1df60775f196

Buckle your Seatbelts; Equities, Commodities Turbulence continues

By John Thorpe, Senior Broker

Nasdaq

nasdaq

Please speak with your broker about ways that you may not be aware of to assist you with your risk management plans. They may surprise you with the creative solutions you may find more efficient than simple stop orders or the old “hand on the mouse blow yourself out” strategy.

Market volatility is here to stay for the foreseeable future

Mini – Nasdaq

Choose your opportunities wisely.

Federal Reserve Chairman Powell: still uncertain what the administration’s new trade policies will be, and that can cause “huge” issue for manufactures input prices affected by tariffs.

Mini Dow’s range today? 1080 points $value? = $5400.00 from hi to lo

Mini S & P’s range today? 169.00 points $ Value? = $8450.00 from hi to lo

Mini Nasdaq’s range today? 527.25 points $value? = $10545.00 from hi to lo

How gold is your portfolio?

All-time highs in the yellow metal today. 3358.4 per troy ounce currently trading @ 3355.5.00 + over $110.00 per oz. We offer all exchange traded contract sizes, from 1 oz to 100 ounces.

Tomorrow:

Econ Data:  Bldg Permits, Housing Starts, Initial Jobless claims, Philly Fed, EIA Nat Gas.

FED Speak: Barr

Earnings: Netflix United Healthcare, Amex.

Tariff news: Anything goes!

S

Good Friday Modified Trading Schedule

This coming Friday, April 18th is Good Friday.

Please see below the modified trading schedule for Good Friday and Easter for CME and ICE exchanges

For the full schedule and details: click here.

b74b2ac0 386c 40d5 9667 eaf8476070ac

Daily Levels for April 17th, 2025
ec242a34 e5e0 49ed 9482 b689ef0a635f

Want to feature our updated trading levels on your website? Simply paste a small code, and they’ll update automatically every day! 

Click here for quick and easy instructions.

822b33c5 2339 45ed bc84 e9c8f8c7358e

Economic Reports

provided by: ForexFactory.com

All times are Eastern Time (New York)

a73ae84d 9f0a 4db8 8aa2 8be4008df2b8

Find us on Trustpilot

stars

Trading Futures, Options on Futures, and retail off-exchange foreign currency transactions involves substantial risk of loss and is not suitable for all investors. You should carefully consider whether trading is suitable for you in light of your circumstances, knowledge, and financial resources. You may lose all or more of your initial investment. Opinions, market data, and recommendations are subject to change at any time.

Call Now

Join our Private Facebook group

Subscribe to our YouTube Channel

Listen to our podcast: Subscribe on AppleSpotify, Amazon

or wherever you listen to podcasts!

S
Facebook  Instagram  LinkedIn
S
ef3ab1c9 8d6d 4e60 a3f1 af5d9d4ecbb3
Services
Software
Tools
Community
Contact

Powerful Market Shift: Standard and Poors GSCI’s 12% Energy Drop Signals Growing Recession Fears

9dc1e02e d5f7 4ff4 abf7 1df60775f196

Standard and Poors GSCI (formerly the Goldman Sachs Commodity Index)

By Mark O’Brien, Senior Broker

sp 500 2

General:

Stay alert tomorrow for Federal Reserve Board Chair Jerome Powell’s speech at the Economic Club of Chicago, when he will share his outlook for the U.S. economy. 12:30 P.M., Central Time.

Standard and Poors GSCI

The S&P GSCI (formerly the Goldman Sachs Commodity Index) tracks global commodities across the energy, metals and agriculture sectors and serves as a benchmark for the commodity markets as a measure of commodity performance over time.

Standard and Poors

The index currently comprises 24 commodities from all commodity sectors. The diversity of the index’s component commodities along with their weighting allows the index to respond in a stable way to world economic growth and contraction.

The index is tradable on Chicago Mercantile Exchange. Each point equals $250.

It shows that prices have declined over 8% since April 2, when U.S. President Donald Trump announced a raft of “reciprocal” tariffs – even after a slight recovery in prices after the White House leader announced a tariff about face last Wednesday.

Of all the commodities in the basket, energy fell the most since April 2, declining around 12%,

Industrial metals posted the second steepest loss of around 9%, followed by soft commodities, which fell roughly 5.2%.

Expectations of further declines in commodities prices are feeding a growing chorus of U.S. recession calls. JPMorgan expects U.S. gross domestic product to contract 0.3% this year.\

Standard and Poors

GSCI Components and Dollar Weights:

f77d8652 c7e7 4e3c b179 0e3f6eeda49d

S


Daily Levels for April 16th, 2025

52d5f718 4b97 4f6c aea2 1734a48f5587

Want to feature our updated trading levels on your website? Simply paste a small code, and they’ll update automatically every day! 

Click here for quick and easy instructions.

822b33c5 2339 45ed bc84 e9c8f8c7358e

Economic Reports

provided by: ForexFactory.com

All times are Eastern Time (New York)

1a356ba3 da23 4807 8187 fcaf510407f5

Find us on Trustpilot

stars

Trading Futures, Options on Futures, and retail off-exchange foreign currency transactions involves substantial risk of loss and is not suitable for all investors. You should carefully consider whether trading is suitable for you in light of your circumstances, knowledge, and financial resources. You may lose all or more of your initial investment. Opinions, market data, and recommendations are subject to change at any time.

Call Now

Join our Private Facebook group

Subscribe to our YouTube Channel

Listen to our podcast: Subscribe on AppleSpotify, Amazon

or wherever you listen to podcasts!

S
Facebook  Instagram  LinkedIn
S
ef3ab1c9 8d6d 4e60 a3f1 af5d9d4ecbb3
Services
Software
Tools
Community
Contact

In times of Volatility, Avoid These 7 Costly Mistakes During 3000+ Point Dow Jones Days

9dc1e02e d5f7 4ff4 abf7 1df60775f196

Extreme Volatility + CPI Tomorrow

volatile

By Mark O’Brien, Senior Broker

Dow Jones & other indices

Dow Jones

As of this typing stock index futures and other futures contracts have experienced single-day range moves not seen in years and after being down, finished up:

→ E-mini Dow Jones: UP +3044 points / 8.4%

→ E-mini S&P 500: UP +480 points / 9.5%

→ E-mini Nasdaq: UP +2038 points / 11.71%

→ Crude Oil: UP +320 points / 5.2%

Volatility is skyrocketing.

This is a completely different environment of extreme trading volatility than what we were trading in 3-4 weeks ago. Markets are evolving and you must adapt your trading to changing market conditions.

This is where you find out what kind of risk taker you are; brash, overbold, unheeding, or prudent, attentive, discriminating. Everyone possesses these traits – and they influence our decision-making differently in different situations.

In trading, if the historical price moves you’re seeing bring out the daredevil in you, plan to watch your trade results all over the place: up and down more than your everyday swings with the odds increasing your account will hit a wall.

Instead, incorporate patience and prudence. Start your trading by setting daily profit targets and daily loss limits and stick to them. Do that for each trade. These days, be aware of LIMIT moves and understand what happens when the market halts at limit levels.

Find daily price limits for CME Group Agricultural, Cryptocurrency, Energy, Equity Index, Interest Rates, and Metals products: click here.

June Dollar Index

The June dollar has had a short term correction after extending its break to the third downside PriceCount objective. IF the chart can resume its slide with new sustained lows, it would have the contract low to contend with before a possible run to the low percentage fourth count to the 98.85 area.

c311af40 0155 418d b948 790ec784ea75

The PriceCount study is a tool that can help to project the distance of a move in price. The counts are not intended to be an ‘exact’ science but rather offer a target area for the four objectives which are based off the first leg of a move with each subsequent count having a smaller percentage of being achieved.

It is normal for the chart to react by correcting or consolidating at an objective and then either resuming its move or reversing trend. Best utilized in conjunction with other technical tools, PriceCounts offer one more way to analyze charts and help to manage your positions and risk.

Learn more at www.qtchartoftheday.com

Trading in futures, options, securities, derivatives or OTC products entails significant risks which must be understood prior to trading and may not be appropriate for all investors. Past performance of actual trades or strategies is not necessarily indicative of future results.

Daily Levels for April 10th, 2025
e90500ff a7b4 4ca5 9042 d8fef46c9c57

Want to feature our updated trading levels on your website? Simply paste a small code, and they’ll update automatically every day!

Click here for quick and easy instructions.

822b33c5 2339 45ed bc84 e9c8f8c7358e

Economic Reports

provided by: ForexFactory.com

All times are Eastern Time (New York)

7c278a58 910b 4078 8d82 170340f55d07

Find us on Trustpilot

stars

Trading Futures, Options on Futures, and retail off-exchange foreign currency transactions involves substantial risk of loss and is not suitable for all investors. You should carefully consider whether trading is suitable for you in light of your circumstances, knowledge, and financial resources. You may lose all or more of your initial investment. Opinions, market data, and recommendations are subject to change at any time.

Call Now

Join our Private Facebook group

Subscribe to our YouTube Channel

Listen to our podcast: Subscribe on AppleSpotify, Amazon

or wherever you listen to podcasts!

S
Facebook  Instagram  LinkedIn
S
ef3ab1c9 8d6d 4e60 a3f1 af5d9d4ecbb3
Services
Software
Tools
Community
Contact

Massive Volatility Moves: 3 Futures Contracts Post Record One-Day Volatility

9dc1e02e d5f7 4ff4 abf7 1df60775f196

E-Mini Extreme Volatility!


The last few weeks and especially the last few trading sessions we saw tremendous volatility across many markets.

Volatility


What we witnessed last night and during today’s session reminded me of the markets when COVID first broke out and we saw limit moves across the board.

Temporarily: Most of our platforms now require 50% margins even for day trading!

tomorrow we have FOMC minutes!!

As of this typing stock index futures and other futures contracts have experienced single-day volatility moves not seen in years. Below you will see the range between high and lows made today for E-Mini stock index contracts:

→ E-mini Dow Jones: 2,173 points

→ E-mini S&P 500: 364 points

→ E-mini Nasdaq: 1,384 points

With tomorrow FOMC minutes and the furtherance of what looks to be the beginning of a global trade war,

expect no drop-off in market volatility.

Traders not only need to be extra cautious in making trading decisions, it’s also important to be aware of important aspects of the markets they’re trading.

Key among these are the daily price limits of the markets you’re trading. A price limit is the maximum price range permitted for a futures contract in each trading session. When markets hit the price limit, different actions occur depending on the product being traded.

Some markets may temporarily halt until price limits can be expanded or trading may be stopped for the day based on regulatory rules. Different futures contracts will have different price limit rules; i.e. Equity Index futures have different rules than Agricultural futures.

Price limits are re-calculated daily and remain in effect for all trading days (except in certain physically-deliverable markets, where price limits are lifted prior to expiration so that futures prices are not prevented from converging on prices for the underlying commodity).

Equity Indexes futures have a three level expansion: 7%, 13% and 20% to the downside, and a 7% limit up and down in overnight trading.

Follow the links below to the CME Group web site to find more information on price limits generally and specific price limits for the markets you’re trading:

Find daily price limits for CME Group Agricultural, Cryptocurrency, Energy, Equity Index, Interest Rates, and Metals products: click here.

S

May Feeder Cattle

May feeder cattle accelerated lower and satisfied the second downside PriceCount objective. The chart is trying to correct but if it can resume the slide into new sustained lows, the third count would project a possible run to the 256.38 area.

7f8060b0 1041 4a69 b14a 99651bdc5c19

The PriceCount study is a tool that can help to project the distance of a move in price. The counts are not intended to be an ‘exact’ science but rather offer a target area for the four objectives which are based off the first leg of a move with each subsequent count having a smaller percentage of being achieved.

It is normal for the chart to react by correcting or consolidating at an objective and then either resuming its move or reversing trend. Best utilized in conjunction with other technical tools, PriceCounts offer one more way to analyze charts and help to manage your positions and risk. Learn more at www.qtchartoftheday.com

Trading in futures, options, securities, derivatives or OTC products entails significant risks which must be understood prior to trading and may not be appropriate for all investors. Past performance of actual trades or strategies is not necessarily indicative of future results.

Daily Levels for April 9th, 2025

43bfed2e fb70 4960 b433 73268e0bbe2a

Want to feature our updated trading levels on your website? Simply paste a small code, and they’ll update automatically every day! 

Click here for quick and easy instructions.

822b33c5 2339 45ed bc84 e9c8f8c7358e

Economic Reports

provided by: ForexFactory.com

All times are Eastern Time (New York)

09974a21 ea4f 427c 9d26 478fa3d1b980

Find us on Trustpilot

stars

Trading Futures, Options on Futures, and retail off-exchange foreign currency transactions involves substantial risk of loss and is not suitable for all investors. You should carefully consider whether trading is suitable for you in light of your circumstances, knowledge, and financial resources. You may lose all or more of your initial investment. Opinions, market data, and recommendations are subject to change at any time.

Call Now

Join our Private Facebook group

Subscribe to our YouTube Channel

Listen to our podcast: Subscribe on AppleSpotify, Amazon

or wherever you listen to podcasts!

S
Facebook  Instagram  LinkedIn
S
ef3ab1c9 8d6d 4e60 a3f1 af5d9d4ecbb3
Services
Software
Tools
Community
Contact

5 Key Price Limit Insights That Help Navigate May Bean Oil Volatility

7cfe5b36 db9f 4933 824a 7f264613e7fe

Cannon Futures Weekly Letter

In Today’s Issue #1237

  • About Price Limits

  • The Week Ahead – FOMC Minutes, tariffs News to Fuel Volatility
  • Futures 102 – Technical Analysis Course
  • Hot Market of the Week – May Bean Oil
  • Broker’s Trading System of the Week – Abacus Raider NQ Day Trading System
  • Trading Levels for Next Week
  • Trading Reports for Next Week

Price Limit

price limit

A price limit is the maximum price range permitted for a futures contract in each trading session. When markets hit the price limit, different actions occur depending on the product being traded.

Some markets may temporarily halt until price limits can be expanded or trading may be stopped for the day based on regulatory rules.

Different futures contracts will have different price limit rules; i.e. Equity Index futures have different rules than Agricultural futures.

Price limits are re-calculated daily and remain in effect for all trading days (except in certain physically-deliverable markets, where price limits are lifted prior to expiration so that futures prices are not prevented from converging on prices for the underlying commodity).

Equity Indexes futures have a three level expansion: 7%, 13% and 20% to the downside, and a 7% limit up and down in overnight trading.

Follow the links below to the CME Group web site to find more information on price limits generally and specific price limits for the markets you’re trading:

Find daily price limits for CME Group Agricultural, Cryptocurrency, Energy, Equity Index, Interest Rates, and Metals products: click here.

Price Limit

Important Notices: The Week Ahead

By Mark O’Brien, Senior Broker

Tariffs News & FOMC Minutes to Dominate Markets & Volatility

U.S. stocks and many commodities like metals, energies, softs and grains were battered by a sell-off Friday after China retaliated against the United States for President Donald Trump’s tariffs in a tit-for-tat that looks to be escalating a global trade war.

The E-mini Dow Jones futures contract plunged by over 2,150 points this afternoon, ±5.3%. The broader E-mini S&P 500 was 5.9% lower. The E-mini Nasdaq futures contract dropped over 1000 points for the second day / ±5.9% on track to close in a bear market — down more than 20% from its record high in December.

Traders have been looking at the dramatic escalation of a trade war and viewing it as a potential to plunge the U.S. and global economies into recession.

The feeling is that odds of a recession would rise if countries began to retaliate against the United States — and China did so Friday. Retaliation raises the risk of further escalation and could diminish hopes for negotiation.

FED SPEECHES:

  • Mon.    Bostic 12: Fed Governor Adriana Kugler speaks, 9:30 A.M., C.T.
  • Tues.  No scheduled Fed speakers
  • Wed.    Richmond Fed President Tom Barkin speaks, 10:00 A.M.,C.T.
  • Thu.     Kansas City Fed President Jeff Schmid speaks, 9:00 A.M., C.T.
  •         Fed Governor Michelle Bowman testifies to Senate, 9:00 A.M., C.T.
  • Fri.      New York Fed President Williams speaks, 100:00 A.M., C.T.

Economic Data week:

  • Mon. Consumer Credit, 2:00 P.M., C.T.
  • Tue. Quiet
  • Wed. Wholesale Inventories, Minutes of Fed.’s March FOMC meeting
  • Thur. Consumer Price Index, Initial Jobless Claims
  • Fri. Producer Price Index

Futures 102: Technical Analysis

Course overview

There are two types of analysis used by traders to inform their trading decisions. Technical analysis and fundamental analysis. In this course, you will learn about the various patterns, indicators, and analysis techniques traders use when studying the price of a commodity.

We will start at the beginning by learning how to read price charts. Then we’ll cover some of the more popular techniques such how to identify trend and reversal patterns, finding support and resistance levels, and various oscillators.

Start FREE Course Now

3c2845af fbc7 4388 ad6a e3688a8cc925

Hot Market of the Week

Hot market of the week is provided by QT Market Center, A Swiss army knife charting package that’s not just for Hedgers, Cooperatives and Farmers alike but also for Spread traders, Swing traders and shorter time frame application for intraday traders with a unique proprietary indicator that can be applied to your specific trading needs.

Free Trial Available

bean oil

May Bean Oil

May bean oil accelerated to its third upside PriceCount objective that was consistent with a challenge of the overhead highs. Now, the chart is correcting.

At this point, IF you can break out above the Nov/Feb Peaks and sustain new highs, the low percentage fourth count would project a possible run to 53.68 which is near the original third objective at 53.90.

The convergence of PriceCounts adds to the significance of that target area.

59cf96e2 a30d 484c a83c 83aa6d9ee8ba

That’s May Bean Oil!

The PriceCount study is a tool that can help to project the distance of a move in price. The counts are not intended to be an ‘exact’ science but rather offer a target area for the four objectives which are based off the first leg of a move with each subsequent count having a smaller percentage of being achieved.

It is normal for the chart to react by correcting or consolidating at an objective and then either resuming its move or reversing trend. Best utilized in conjunction with other technical tools, PriceCounts offer one more way to analyze charts and help to manage your positions and risk. Learn more at www.qtchartoftheday.com

Trading in futures, options, securities, derivatives or OTC products entails significant risks which must be understood prior to trading and may not be appropriate for all investors. Past performance of actual trades or strategies is not necessarily indicative of future results.

Brokers Trading System of the Week

Abacus Raider NQ Trading System

Market Sector: Stock Index Futures

Markets Traded:   NQ

System Type: Day Trading

Risk per Trade: varies

Trading Rules: Partially Disclosed

Suggested Capital: $10,000

Developer Fee per contract: $70.00 Monthly Subscription

System Description: 

An NQ day trading system currently traded by the developer who has 15+ years’ experience. The system identifies opportunities where there is a high probability of profit over a time frame lasting no longer than a few minutes. Short holding periods reduce risk and drawdown size and require less capital.

The system trades long and short, performs in low or high volatility markets and has no significant correlation to the S&P500 index. It is robust with simple logic and averages 4-5 trades a month with no overnight positions. System is not available in the MNQ market.

Get Started

Learn More

efbcc397 7787 4023 884d 2c19783fb925

Disclaimer The risk of trading can be substantial and each investor and/or trader must consider whether this is a suitable investment. Past performance is not necessarily indicative of future results.

Futures Trading Disclaimer:

Transactions in securities futures, commodity and index futures and options on futures carry a high degree of risk. The amount of initial margin is small relative to the value of the futures contract, meaning that transactions are heavily “leveraged”.

A relatively small market movement will have a proportionately larger impact on the funds you have deposited or will have to deposit: this may work against you as well as for you. You may sustain a total loss of initial margin funds and any additional funds deposited with the clearing firm to maintain your position.

If the market moves against your position or margin levels are increased, you may be called upon to pay substantial additional funds on short notice to maintain your position.

If you fail to comply with a request for additional funds within the time prescribed, your position may be liquidated at a loss and you will be liable for any resulting deficit.

 Please read full disclaimer HERE.

Would you like to get weekly updates on real-time, results of systems mentioned above?
Yes
No

Trading Levels for Next Week

Daily Levels for April 7th, 2025

07661c52 0b05 47f3 8db3 a10e02c2003a

Would you like to receive daily support & resistance levels?
Yes
No

Trading Reports for Next Week

First Notice (FN), Last trading (LT) Days for the Week:

www.mrci.com

669230d5 0860 4679 9d40 097d654b4839

Find us on Trustpilot

stars

Trading Futures, Options on Futures, and retail off-exchange foreign currency transactions involves substantial risk of loss and is not suitable for all investors.

You should carefully consider whether trading is suitable for you in light of your circumstances, knowledge, and financial resources.

You may lose all or more of your initial investment. Opinions, market data, and recommendations are subject to change at any time.

Call Now

Join our Private Facebook group

Subscribe to our YouTube Channel

Listen to our podcast: Subscribe on AppleSpotify, Amazon

or wherever you listen to podcasts!

S
Facebook  Instagram  LinkedIn
S
ef3ab1c9 8d6d 4e60 a3f1 af5d9d4ecbb3
Services
Software
Tools
Community
Contact

Trading Crude Oil Futures

7 Powerful Reasons Crude Oil Futures Remain a Top Trading Opportunity

Crude oil plays a pivotal role in the global economy. It fuels transportation, powers industries, and supports the manufacture of countless products, from plastics to chemicals. Given its strategic importance, it’s no surprise that crude oil is one of the most actively traded commodities in the world. Trading crude oil futures has become an essential activity for hedgers, speculators, and institutional investors alike. This research paper delves into why crude oil futures are among the most coveted contracts in the futures market, their historical origins, evolution, risk assessments, and the benefits of using a reputable brokerage like Cannon Trading Company to engage in oil futures trading.

Origins of the Crude Oil Futures Contract

The crude oil futures contract as we know it today traces its origins back to the 1980s. Before this, crude oil was primarily traded via long-term physical contracts between producers and consumers. However, market volatility and geopolitical tensions in the 1970s, notably the oil embargo of 1973 and the Iranian Revolution of 1979, exposed the need for a more flexible pricing mechanism.

In response to these events, the New York Mercantile Exchange (NYMEX) introduced the first crude oil futures contract in 1983. This innovation provided market participants with a standardized, regulated mechanism to hedge against price volatility or speculate on price movements. The introduction of this oil futures contract was a watershed moment in the history of commodity trading, laying the groundwork for the sophisticated oil futures trading systems we see today.

Why Crude Oil Futures Are Highly Coveted

Several factors contribute to the popularity of crude oil futures contracts:

  • Liquidity and Volume: Crude oil futures are among the most liquid commodities traded. The high trading volume ensures tight bid-ask spreads and minimal slippage, making them ideal for both institutional and retail traders.
  • Global Relevance: Oil is a universally consumed commodity, and geopolitical events affecting oil-producing regions can cause significant price fluctuations. This global relevance ensures that oil futures trading remains dynamic and closely watched.
  • Volatility and Opportunity: While volatility can pose risks, it also creates opportunities for substantial profits. Traders who understand the market dynamics can capitalize on rapid price movements.
  • Accessibility and Leverage: Trading crude oil futures allows traders to control large contract sizes with relatively small margins, increasing their potential returns.
  • Hedging Mechanism: For oil producers, refineries, and large-scale consumers, crude oil futures provide a means to lock in prices and mitigate risks associated with market fluctuations.

The Rise of Speculation in Oil Futures Trading

Initially, the crude oil futures market was dominated by commercial players seeking to hedge their exposure. However, the landscape began to change in the late 1990s and early 2000s with the influx of hedge funds, institutional investors, and retail traders. Several factors contributed to this shift:

  • Financialization of Commodities: Commodities, including crude oil, were increasingly viewed as investment assets. The launch of commodity index funds and ETFs made it easier for investors to gain exposure to oil futures.
  • Technological Advancements: Online trading platforms and real-time data enabled more participants to engage in oil futures trading with greater ease and speed.
  • Macro-economic Events: Events like the 2008 financial crisis and subsequent quantitative easing measures by central banks led investors to seek alternative assets. Crude oil, being a tangible asset with intrinsic value, attracted speculative interest.
  • Price Swings and Media Coverage: High-profile price swings, such as oil reaching $147 per barrel in 2008 and the historic dip into negative prices in April 2020, generated significant media attention and drew in speculative traders.

As a result, speculators now account for a significant portion of the open interest in crude oil futures markets, adding to both the liquidity and volatility of these contracts.

Key Events That Shaped the Oil Futures Market

  • 1973 Oil Embargo: Highlighted the vulnerability of oil supply chains and the need for risk management tools.
  • 1983 Launch of NYMEX Oil Futures: Marked the formal beginning of exchange-traded oil futures.
  • 2008 Oil Price Spike: Drew attention to the potential profits in trading crude oil futures.
  • 2014 Oil Price Crash: Demonstrated the impact of oversupply and changing global demand.
  • 2020 COVID-19 and Negative Oil Prices: A historic moment where crude oil futures briefly traded below zero due to storage issues, underscoring the complexity and risk of these contracts.

Each of these events has contributed to the continued popularity of trading crude oil futures by highlighting both the risks and rewards inherent in the market.

Risk Assessment and Profit Potential

Trading crude oil futures involves significant risk, but it also offers considerable profit potential. Here is a breakdown of both:

Risks:

  • Price Volatility: Crude oil prices can fluctuate wildly due to geopolitical tensions, natural disasters, OPEC decisions, and economic indicators.
  • Leverage Risk: While leverage can amplify gains, it can also magnify losses. A small adverse movement can result in significant financial loss.
  • Market Sentiment and Speculation: The market is often driven by sentiment and news, which can lead to unpredictable price swings.
  • Liquidity Risk: While crude oil futures are generally liquid, during periods of extreme volatility, liquidity can dry up, resulting in wider spreads.

Profit Potential:

  • Strategic Speculation: Traders who accurately predict price movements can realize substantial gains.
  • Arbitrage Opportunities: Differences between spot and futures prices, or between different delivery months, can be exploited.
  • Hedging and Risk Transfer: Commercial players can lock in prices, reducing uncertainty and improving financial planning.

Over the years, risk management tools such as stop-loss orders, advanced charting, algorithmic trading, and diversified portfolios have evolved, helping traders navigate the complexities of oil futures trading more effectively.

How to Trade Oil Futures

Trading crude oil futures involves several key steps:

  • Choosing a Broker: A reliable and experienced broker is essential. They provide the platform, market data, and support needed for successful trading.
  • Understanding the Contract Specifications: Most crude oil futures contracts are standardized (e.g., NYMEX WTI contracts represent 1,000 barrels of crude).
  • Analyzing the Market: Traders use technical, fundamental, and sentiment analysis to make informed decisions.
  • Managing Risk: This includes setting stop-loss levels, using appropriate position sizing, and monitoring market exposure.
  • Executing and Monitoring Trades: Once trades are placed, they need to be monitored, and exit strategies should be in place.

The key to success in trading crude oil futures lies in education, discipline, and access to the right tools and information.

Why Cannon Trading Company Is Ideal for Oil Futures Trading

Cannon Trading Company stands out as a premier brokerage for trading crude oil futures for several compelling reasons:

  • Free Trading Platforms: Cannon Trading offers a wide selection of top-performing, professional-grade trading platforms at no cost. These platforms include advanced charting tools, real-time data, and intuitive interfaces that are perfect for both beginners and seasoned traders engaging in oil futures trading.
  • Highly Rated Customer Service: With countless 5-star ratings on TrustPilot, Cannon Trading has built a reputation for reliability, transparency, and client satisfaction. Their team is known for being the first to pick up the phone, ensuring that traders receive timely support during critical trading hours.
  • Experienced Brokers: The company’s onsite brokers bring decades of hands-on experience in trading crude oil futures. Their deep market knowledge and personalized support can be invaluable, especially during volatile market conditions.
  • Strong Regulatory Record: Cannon Trading has an exemplary compliance history with industry regulators, providing clients with confidence in the firm’s integrity and operational security.
  • Educational Resources: Cannon Trading is also committed to trader education, offering webinars, articles, and real-time market insights to help clients understand how to trade oil futures effectively.

These factors make Cannon Trading an excellent partner for anyone looking to explore or expand their oil futures trading activities. Whether you’re a novice wanting to learn how to trade oil futures or a seasoned investor seeking a better platform, Cannon Trading delivers on all fronts.

Trading crude oil futures has evolved into one of the most dynamic and potentially lucrative areas of the financial markets. From its origins in the 1980s to the speculative booms of the 21st century, the oil futures contract has proven its resilience and relevance. Despite inherent risks, the contract’s liquidity, volatility, and global importance continue to attract traders and investors from around the world.

Choosing the right broker can significantly enhance one’s oil futures trading experience. Cannon Trading Company, with its cutting-edge free trading platforms, exceptional customer service, and seasoned brokers, provides an optimal environment for trading crude oil futures successfully.

For more information, click here.

Ready to start trading futures? Call us at 1(800)454-9572 – Int’l (310)859-9572 (International), or email info@cannontrading.com to speak with one of our experienced, Series-3 licensed futures brokers and begin your futures trading journey with Cannon Trading Company today.

Disclaimer: Trading Futures, Options on Futures, and retail off-exchange foreign currency transactions involve substantial risk of loss and are not suitable for all investors. Past performance is not indicative of future results. Carefully consider if trading is suitable for you in light of your circumstances, knowledge, and financial resources. You may lose all or more of your initial investment. Opinions, market data, and recommendations are subject to change at any time.

Important: Trading commodity futures and options involves a substantial risk of loss. The recommendations contained in this article are opinions only and do not guarantee any profits. This article is for educational purposes. Past performances are not necessarily indicative of future results.

This article has been generated with the help of AI Technology and modified for accuracy and compliance.

Follow us on all socials: @cannontrading