Selling Future Options Premium

Futures Options Writing


Have you ever wondered who sells the futures options that most people buy? These people are known as the option writers/sellers. Their sole objective is to collect the premium paid by the option buyer. Option writing can also be used for hedging purposes and reducing risk. An option writer has the exact opposite to gain as the option buyer. The writer has unlimited risk and a limited profit potential, which is the premium of the option minus commissions. When writing naked futures options your risk is unlimited, without the use of stops. This is why we recommend exiting positions once a market trades through an area you perceived as strong support or resistance. So why would anyone want to write an option? Here are a few reasons:

  1. Most futures options expire worthless and out of the money. Therefore, the option writer is collecting the premium the option buyer paid.


  1. There are three things that happen to the underlying price of the option: Price goes up, goes down or stays the same. If when the option expires, the market price was at or below your strike price you collect all the premium if two of those things happen Time decay is the option writer’s friend.


  1. The writer believes the futures contract will not reach a certain strike price by the expiration date of the option. This is known as naked option selling.


  • To hedge against a futures position. For example: someone who goes long cocoa at 850 can write a 900 strike price call option with about one month of time until option expiration. This allows you to collect the premium of the call option if cocoa settles below 900, based on option expiration. It also allows you to make a profit on the actual futures contract between 851 and 900. This strategy also lowers your margin on the trade, and should cocoa continue lower to 800, you at least collect some premium on the option you wrote. Risk lies if cocoa continues to decline, because you only collect a certain amount of premium and the futures contract has unlimited risk the lower it goes. So you should trade with a stop on the futures contract. You can read on different strategies using options on futures here:


https://www.cannontrading.com/tools/education-futures-options-trading-101


Cannon offers SPAN margins for options sellers.

Many brokers will restrict or increase the margins required for options sellers, or traders who like to “collect premium”, but here at Cannon we can find you the best set up utilizing the multiple clearing arrangements we have with more than a few FCMs.

How much margin is required to sell a futures option?

That is a question we get asked often. The exact number is an output of SPAN margins. SPAN deserves a post on its own, but what it stands for is: Standard Portfolio Analysis of Risk. The formula takes into consideration volatility, time value, distance of strike price from current underlying future, and more.

Outright options may be easier to “guesstimate” margin than more complex strategies and spreads, but our free platform, E-Futures Int’l (https://www.cannontrading.com/software/e-futures-international )has a margin calculator built in so you can calculate the margin you will need for different strategies.

Commission for selling options on futures?

Commissions will vary based on the following:

Are you trading online or with a broker?

Trading volume

Account size

Risk responsibility.

The rates for selling options will vary from as low as $0.25 per side + fees for HIGH VOLUME, institutional accounts to $30 per side + fees for retail, broker assisted accounts.


Selling options is NOT for newcomers as it involves higher risk than buying options.

However, selling options and trading option spreads may offer an edge if done with proper risk management. No guarantees are made here.

Our strength at Cannon is our ability to offer CUSTOMIZED trading solutions, so contact a broker at:

https://www.cannontrading.com/company/contact

and learn more about risks and opportunities in futures trading (https://www.cannontrading.com/riskopportunity), what software you can use, consult with a broker on margin, commissions and strategy questions and much more!


Trading Futures, Options on Futures, and retail off-exchange foreign currency transactions involves substantial risk of loss and is not suitable for all investors.  You should carefully consider whether trading is suitable for you in light of your circumstances, knowledge, and financial resources. You may lose all or more of your initial investment. Opinions, market data, and recommendations are subject to change at any time.

Daily NQ Chart & Support and Resistance Levels 6.05.2019

____________________________________________________________________

Voted #1 Blog and #1 Brokerage Services on TraderPlanet for 2016!!  

____________________________________________________________________

Dear Traders,

Like us on FaceBook!
Get Real Time updates and market alerts on Twitter!
Trading 101: Free, Interactive Futures Trading Tutorial
An interactive tutorial on the basics ( and a little more) of futures trading.
Regardless if you traded before or new to the futures markets, this tutorial is nicely put together by our regulators and the CME and touches on a variety of sub topics that go into trading futures and options.
Browse through the tutorial at your leisure and at your own pace. Please call us if you have any questions about implementing your strategy or requesting a live demo or have feedback.
7b0fc19f b5eb 42c1 9fff 0da0109a7e5e
bdf6db09 7692 48a4 8450 9a8d7d5f2d31

Good Trading

Trading Futures, Options on Futures, and retail off-exchange foreign currency transactions involves substantial risk of loss and is not suitable for all investors.  You should carefully consider whether trading is suitable for you in light of your circumstances, knowledge, and financial resources. You may lose all or more of your initial investment. Opinions, market data, and recommendations are subject to change at any time.
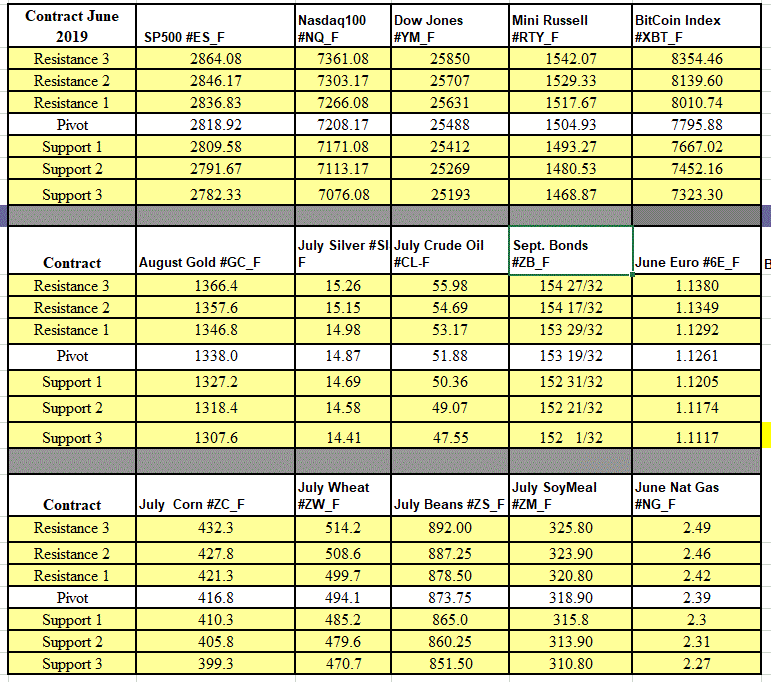
 

Futures Trading Levels

06-06-2019

ee77b883 1b88 425d 8d9c 7c6588f6b7db


Economic Reports, source: 

bettertrader.co

c38d27ef 4cd2 4107 8d67 2fd62ca1e1a4


This is not a solicitation of any order to buy or sell, but a current market view provided by Cannon Trading Inc. Any statement of facts here in contained are derived from sources believed to be reliable, but are not guaranteed as to accuracy, nor they purport to be complete. No responsibility is assumed with respect to any such statement or with respect to any expression of opinion herein contained. Readers are urged to exercise their own judgement in trading.

Trading Videos+ Trading Levels for June 4th

______________________________________________________________

Voted #1 Blog and #1 Brokerage Services on TraderPlanet for 2016!!  

____________________________________________________________________

Dear Traders,

Like us on FaceBook!
Get Real Time updates and market alerts on Twitter!
Trading 101: Trading videos on bollinger bands, Parabolics, Trading levels, Range Bars and more!
Watch the latest trading videos we have posted and shared with our clients!
In this week’s newsletter we are sharing two videos, each a few minutes long. The videos discuss practical tips for trading and sharing our experience with you
1. Using bollinger Bands as a possible tool for exiting trades
2. One way you can use the Parabolics study ( also known as PSAR) to manage current positions, possibly as a trailing stop
3. Different ways traders can utilize support and resistance levels in their trading.
4. Entering trades on a stop, using “price confirmation”.
5. Utilizing Range Bar charts for shorter term trading as a way to try and filter out some noise.
logo
stars

Good Trading

Trading Futures, Options on Futures, and retail off-exchange foreign currency transactions involves substantial risk of loss and is not suitable for all investors.  You should carefully consider whether trading is suitable for you in light of your circumstances, knowledge, and financial resources. You may lose all or more of your initial investment. Opinions, market data, and recommendations are subject to change at any time.
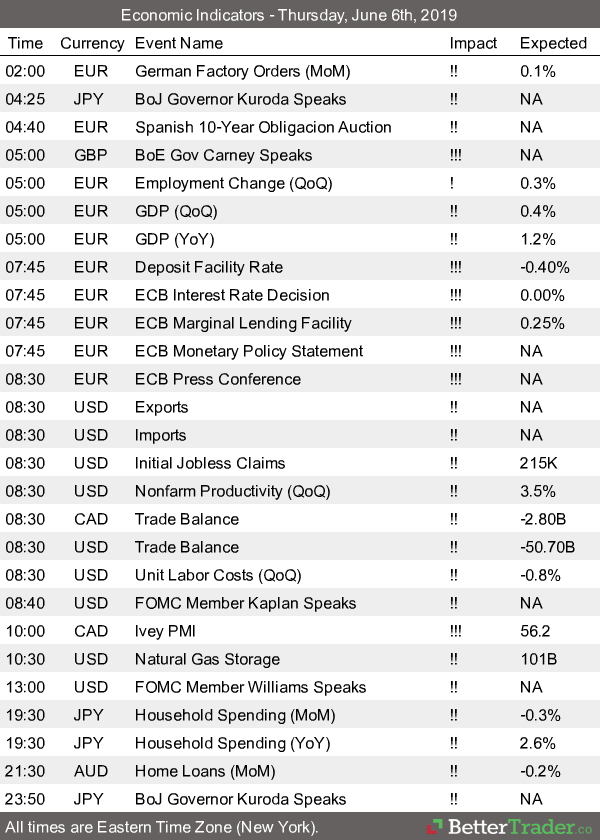
 

Futures Trading Levels

06-03-2019

c0cd9d79 f227 438b 9abe 909d01d157d5


Economic Reports, source: 

bettertrader.co

S
31ebd27e bd58 4a19 ba72 df1d71fa6fd0


This is not a solicitation of any order to buy or sell, but a current market view provided by Cannon Trading Inc. Any statement of facts here in contained are derived from sources believed to be reliable, but are not guaranteed as to accuracy, nor they purport to be complete. No responsibility is assumed with respect to any such statement or with respect to any expression of opinion herein contained. Readers are urged to exercise their own judgement in trading.

Futures Levels & Economic Reports 11.04.2015

Connect with Us! Use Our Futures Trading Levels and Economic Reports RSS Feed.

Like us on FacebookFollow us on TwitterView our profile on LinkedInFind us on Google+Cannon Trading Futures Trading Resistance & Support Levels and Economic ReportsFind us on Yelp

1. Market Commentary
2. Futures Support and Resistance Levels – S&P, Nasdaq, Dow Jones, Russell 2000, Dollar Index
3. Commodities Support and Resistance Levels – Gold, Euro, Crude Oil, T-Bonds
4. Commodities Support and Resistance Levels – Corn, Wheat, Beans, Silver
5. Futures Economic Reports for Wednesday November 04, 2015

Hello Traders,

For 2015 I would like to wish all of you discipline and patience in your trading!

Did not have too much of added value to share with you today so decided to point you into a resource that is not on our site ( but will be soon)  that may be useful for you and includes a few videos:https://vimeo.com/cannontradingcompany/videos

Many ways to trade any market, many ways to lose money in any market and only very few ways to lock in gains. If you need help creating a trading plan, visit our broker assist services.

Many ways to trade any market, many ways to lose money in any market and only very few ways to lock in gains. If you need help creating a trading plan,visit our broker assist services.

GOOD TRADING

Trading Futures, Options on Futures, and retail off-exchange foreign currency transactions involves substantial risk of loss and is not suitable for all investors. You should carefully consider whether trading is suitable for you in light of your circumstances, knowledge, and financial resources. You may lose all or more of your initial investment. Opinions, market data, and recommendations are subject to change at any time.

If you like Our Futures Trading Daily Support and Resistance Levels, Please share!


Futures Trading Levels

Contract Dec. 2015 SP500 Nasdaq100 Dow Jones Mini Russell Dollar Index
Resistance 3 2133.42 4783.00 18133 1212.83 98.32
Resistance 2 2121.83 4755.25 18015 1203.77 97.95
Resistance 1 2112.17 4732.50 17925 1195.83 97.60
Pivot 2100.58 4704.75 17807 1186.77 97.22
Support 1 2090.92 4682.00 17717 1178.83 96.87
Support 2 2079.33 4654.25 17599 1169.77 96.50
Support 3 2069.67 4631.50 17509 1161.83 96.15
Contract Dec. Gold Dec. Silver Dec. Crude Oil Dec. Bonds Dec.   Euro
Resistance 3 1156.6 15.66 51.25 157 22/32 1.1117
Resistance 2 1147.3 15.56 49.80 156 31/32 1.1077
Resistance 1 1132.2 15.41 48.85 155 28/32 1.1023
Pivot 1122.9 15.31 47.40 155 5/32 1.0983
Support 1 1107.8 15.16 46.45 154 2/32 1.0929
Support 2 1098.5 15.06 45.00 153 11/32 1.0889
Support 3 1083.4 14.91 44.05 152 8/32 1.0835
Contract Dec. Corn Dec. Wheat Jan Beans Dec. SoyMeal Dec. Nat Gas
Resistance 3 389.8 530.8 896.58 308.20 2.36
Resistance 2 386.0 523.7 891.67 306.70 2.32
Resistance 1 383.3 520.1 885.33 304.00 2.30
Pivot 379.5 512.9 880.42 302.50 2.27
Support 1 376.8 509.3 874.1 299.8 2.2
Support 2 373.0 502.2 869.17 298.30 2.21
Support 3 370.3 498.6 862.83 295.60 2.18
Economic Reports

source:http://www.forexfactory.com/calendar.php

All times are Eastern time Zone (EST)


Date 4:00pm Currency Impact Detail Actual Forecast Previous Graph
WedNov 4  3:15am EUR Spanish Services PMI 55.5 55.1
3:45am EUR Italian Services PMI 53.7 53.3
3:50am EUR French Final Services PMI 52.3 52.3
3:55am EUR German Final Services PMI 55.2 55.2
4:00am EUR ECB President Draghi Speaks
EUR Final Services PMI 54.2 54.2
5:00am EUR PPI m/m -0.4% -0.8%
5:30am USD FOMC Member Brainard Speaks
8:15am USD ADP Non-Farm Employment Change 183K 200K
8:30am USD Trade Balance -42.7B -48.3B
9:45am USD Final Services PMI 54.6 54.4
10:00am USD Fed Chair Yellen Testifies
USD ISM Non-Manufacturing PMI 56.6 56.9
10:30am USD Crude Oil Inventories 2.5M 3.4M
2:30pm USD FOMC Member Dudley Speaks
7:30pm USD FOMC Member Fischer Speaks


This is not a solicitation of any order to buy or sell, but a current market view provided by Cannon Trading Inc. Any statement of facts here in contained are derived from sources believed to be reliable, but are not guaranteed as to accuracy, nor they purport to be complete. No responsibility is assumed with respect to any such statement or with respect to any expression of opinion herein contained. Readers are urged to exercise their own judgment in trading


Economic Reports & Futures Levels 8.11.2015

Connect with Us! Use Our Futures Trading Levels and Economic Reports RSS Feed.

Like us on FacebookFollow us on TwitterView our profile on LinkedInFind us on Google+Cannon Trading Futures Trading Resistance & Support Levels and Economic ReportsFind us on Yelp

1. Market Commentary
2. Futures Support and Resistance Levels – S&P, Nasdaq, Dow Jones, Russell 2000, Dollar Index
3. Commodities Support and Resistance Levels – Gold, Euro, Crude Oil, T-Bonds
4. Commodities Support and Resistance Levels – Corn, Wheat, Beans, Silver
5. Futures Economic Reports for Tuesday August 11, 2015

Hello Traders,

For 2015 I would like to wish all of you discipline and patience in your trading!

Hello Traders,

TradeTheNews.com Weekly Market Update: See You in September
Fri, 07 Aug 2015 16:27 PM EST

US equity indices saw modest losses this week and the 10-year yield pulled back to levels last seen in late May as investors continued to brood over the timing of Fed rate liftoff. The consensus heading into Friday’s July jobs report was that any non-farm payrolls figure above +200K would support expectations for the Fed to tighten policy in September, and the +215K figure on Friday did the job. In China, the government extended its campaign of heavy-handed interventions to keep the Shanghai Composite steady. Economic data continued to suggest the economy is slowing: the official China manufacturing PMI index stalled out in July, hitting 50.0 after four months of very slight expansion. Europe is finally seeing solid improvements in economic data, with most of the continent’s July manufacturing PMI data beating expectations and firmly in expansion territory (although France did slip back into contraction in the month). For the week, the DJIA lost -1.8%, the S&P dropped -1.2%, and the Nasdaq gave up -1.7%.

The non-farm payrolls total came in slightly below expectations, but overall the July jobs report still indicates some improvement in the US labor market. Employers added 215,000 jobs in July, 10 thousand less than expected, but this marked the 58th consecutive month of job gains, the longest stretch on record. Both the June and May figures were revised slightly higher. Unemployment didn’t budge from its post-crisis low of 5.3%, while average hourly earnings rose 0.2% sequentially and 2.1% on an annualized basis, on par with the pace of much of the expansion. The labor-force participation rate remained at a multi-decade low, suggesting there remains quite a bit of slack in the labor market. The consensus heading into the data was that any figure above +200K would keep the Fed on track for tightening policy in September, and based on Fed-funds futures, the odds of a September hike rose to 56% from 46% before the jobs report.

In other US economic data, personal spending and core PCE growth held steady at low levels in July, although the y/y figure was a hair higher. The July ISM manufacturing index fell to 52.7 from 53.5 the month before, however the new orders component rose slightly to 56.5 from 56.0 in June, marking the highest reading since December. The July ISM non-manufacturing index saw very strong growth, rising to 60.3 from 56 m/m, with a new orders component up at 63.8. Construction spending barely rose in June as private outlays posted their biggest drop in a year, but the May figures were revised up to +1.8% from +0.8% prior.

Continue reading “Economic Reports & Futures Levels 8.11.2015”

Market Recap & Economic Reports 8.04.2015

Connect with Us! Use Our Futures Trading Levels and Economic Reports RSS Feed.

Like us on FacebookFollow us on TwitterView our profile on LinkedInFind us on Google+Cannon Trading Futures Trading Resistance & Support Levels and Economic ReportsFind us on Yelp

1. Market Commentary
2. Futures Support and Resistance Levels – S&P, Nasdaq, Dow Jones, Russell 2000, Dollar Index
3. Commodities Support and Resistance Levels – Gold, Euro, Crude Oil, T-Bonds
4. Commodities Support and Resistance Levels – Corn, Wheat, Beans, Silver
5. Futures Economic Reports for Tuesday August 4, 2015

Hello Traders,

For 2015 I would like to wish all of you discipline and patience in your trading!

Hello Traders,

TradeTheNews.com Weekly Market Update: Global Growth Concerns Linger, Fed Still Open to September Liftoff

US equity markets recovered some ground this week and the Shanghai Composite appeared to stabilize after another round of government pledges. The DJIA is looking a little shaky, weighed on by pain in the commodities related industrials, but the S&P500 is within sight of the recent all-time highs, notching a 1.2% gain on the week. Despite pledging hundreds of billions to prop up its market, China’s stocks sunk another 8.5% on Monday – the biggest one-day drop since 2007 – drawing another promise from the China Securities Finance Corporation(CSFC) to boost its stock purchases. The FOMC statement kept expectations of a September rate hike alive without pre-committing, while Thursday’s upward revisions to past core PCE readings and a hotter than expect initial Q2 core PCE print only supported that notion. Short term US Treasury yields backed up to levels not seen since early June as traders rotated into the US long bond, likely on the belief that rates can only rise very gradually under the current subdued growth outlook. The US Q2 employment cost index threw markets a bit of a curve ball on Friday, unwinding some of the week’s earlier bets the Fed was on the precipice of raising rates for the first time since 2006. The prospect of a Puerto Rico bond default over the weekend also dampened sentiment.

The semantic tweaks made to the FOMC statement released on Wednesday did not include any overt signals that rate hikes were imminent. However, Fed watchers characterized several minor changes as a hint that Fed officials see the economy closer than ever to full employment. For several meetings, the language talked about the need to see “additional” improvement in the labor market, but this was changed to “some” additional improvement. A related section stated that slack in the labor market had diminished, striking an earlier qualification that slack had diminished “somewhat.” On the inflation front, the statement dropped reference to “stabilized” energy prices, given that oil prices are retesting their spring lows, and it retained language that said inflation is running below the Fed’s 2% objective. The next FOMC meeting is scheduled for September 16-17.

The slowdown seen in the US Q2 employment cost index (ECI) had a broad impact on markets on Friday and made some question the viability of a September Fed rate hike. The report indicated that labor costs decelerated sharply in the quarter (+0.2% v +0.6%e), reversing Q1’s +0.7% figure and delivering the lowest rate of growth in 30 years. The Q1 reading suggested wage growth had picked up perceptibly from the stagnant trend of earlier years, holding out the hope for accelerating inflation and spending, with obvious implications for monetary policy. Analysts noted that some of the slowdown could be a reversal of a seasonal effect: the uptick in the first Q1 was concentrated in incentive-pay occupations, where bonuses and commissions can be volatile, and this pop reversed itself in the second quarter. Analysts caution that the adjusted data also rose in Q1 and decelerated in Q2. Commenting after the ECI release, Fed hawk Bullard said he was not concerned by the data, and that a September rate hike can’t be ruled out.

The first reading of Q2 US GDP was just fine, with the headline figure of +2.3% a hair below expectations but much better than the revised final Q1 figure of +0.6% (which itself was revised up from the -0.2% final report in June). Personal consumption beat expectations at +2.9%, while the export figure grew to +5.3% from -5.9% in the final Q1 report. Friday’s GDP report was the first to include new methodology meant to correct the tendency to slightly underestimate growth in Q1 and overestimate growth in Q3, due to issues in measuring military spending and consumer services. Under the new approach, the government has found that the US economy grew somewhat slower in 2012-14, at an average of +2.0% a year instead of +2.3%. The slowest recovery since the end of World War II is now even weaker than previously believed.

Continue reading “Market Recap & Economic Reports 8.04.2015”

FOMC Reaction & Economic Reports 7.30.2015

Connect with Us! Use Our Futures Trading Levels and Economic Reports RSS Feed.

Like us on FacebookFollow us on TwitterView our profile on LinkedInFind us on Google+Cannon Trading Futures Trading Resistance & Support Levels and Economic ReportsFind us on Yelp

1. Market Commentary
2. Futures Support and Resistance Levels – S&P, Nasdaq, Dow Jones, Russell 2000, Dollar Index
3. Commodities Support and Resistance Levels – Gold, Euro, Crude Oil, T-Bonds
4. Commodities Support and Resistance Levels – Corn, Wheat, Beans, Silver
5. Futures Economic Reports for Thursday July 30, 2015

Hello Traders,

For 2015 I would like to wish all of you discipline and patience in your trading!

Hello Traders,

FOMC came out today without much change from previous language.

Many times the true reaction to FOMC is the next day. I have seen that more than a few times in the past.

If pattern of last few meetings hold, we may see a bit more of a rally before turning around late Thursday or Friday….but then again, past performance is not indicative of future results….

Plan your trade, trade your plan. Don’t forget money management can be more important than the actual buy or sell signals etc…

Market Recap & Economic Reports 6.09.2015

Connect with Us! Use Our Futures Trading Levels and Economic Reports RSS Feed.

Like us on FacebookFollow us on TwitterView our profile on LinkedInFind us on Google+Cannon Trading Futures Trading Resistance & Support Levels and Economic ReportsFind us on Yelp

1. Market Commentary
2. Futures Support and Resistance Levels – S&P, Nasdaq, Dow Jones, Russell 2000, Dollar Index
3. Commodities Support and Resistance Levels – Gold, Euro, Crude Oil, T-Bonds
4. Commodities Support and Resistance Levels – Corn, Wheat, Beans, Silver
5. Futures Economic Reports for Tuesday June 9, 2015

Hello Traders,

For 2015 I would like to wish all of you discipline and patience in your trading!

Hello Traders,

From our friends at www.TradeTheNews.com , a look at what moved the market last week and what we should be aware of for this week on the news side.

TradeTheNews.com Weekly Market Update: Greece and Looming Fed Action Spur More Volatility

Choppy trading in stocks, bonds, and currency whipped the markets around last week. At his post rate-decision press conference, ECB President Draghi warned that people need to get used to heightened volatility, adding more instability to an already unpredictable market. Greece crept closer to the edge, as leaders in Athens held out from agreeing to their creditors’ “final offer” and pushed back repayments of IMF debt until the end of June. The US May jobs data was very strong, keeping alive the prospect of a September Fed hike, rekindling jitters that higher rates are in sight. The Atlanta Fed raised its tracking estimate for Q2 GDP by three-tenths to 1.1% after the trade deficit narrowed to $40.9 billion in April from March’s six-year high of $51.4 billion, a steeper decline than expected. More breathtaking volatility on the Shanghai Composite ended in a nearly 9% rally on the week after official PMI numbers missed expectations and sustained hopes for more PBoC easing. In the same timeframe, US stocks mostly lost ground: the DJIA slipped 0.9%, the S&P500 fell 0.7%, while the Nasdaq was flat on the week.

Bond volatility was extremely pronounced this week as traders juggled monetary policy divergence between the US and the rest of the world against the threat of a Greek default. The yield on the German 10-year bond soared from 0.50% last Friday to an eight-month high of 0.99% on Thursday before easing slightly on Friday. The 10-year US yield hit a fresh 2015 high of 2.44% on Thursday and matched that level again after the jobs report, up from 2.12% last Friday. EUR/USD was similarly volatile, rising more than four and a half big figures from 1.0900 as high as 1.1380 on Thursday before the strong jobs report sent the pair back as low as 1.1050. USD/JPY was less choppy as the pair tested the key level of 124.50 all week before breaking higher on Friday, to 125.80, after the jobs report.

Continue reading “Market Recap & Economic Reports 6.09.2015”

Crude Oil Futures & Economic Reports 5.07.2015

Connect with Us! Use Our Futures Trading Levels and Economic Reports RSS Feed.

Like us on FacebookFollow us on TwitterView our profile on LinkedInFind us on Google+Cannon Trading Futures Trading Resistance & Support Levels and Economic ReportsFind us on Yelp

1. Market Commentary
2. Futures Support and Resistance Levels – S&P, Nasdaq, Dow Jones, Russell 2000, Dollar Index
3. Commodities Support and Resistance Levels – Gold, Euro, Crude Oil, T-Bonds
4. Commodities Support and Resistance Levels – Corn, Wheat, Beans, Silver
5. Futures Economic Reports for Thursday May 7, 2015

Hello Traders,

For 2015 I would like to wish all of you discipline and patience in your trading!

Hello Traders, 

Why I Like to Use Tick and Volume Charts for Scalping

Today, I decided to touch more on an educational feature rather than provide a certain market outlook.

Many of my clients and blog readers know that when it comes to short-term trading I am a fan of using volume charts, tick charts, range bar charts and Renko charts rather than the traditional time charts like the 1 minutes, 5 minutes etc.

My rule of thumb is that if you as a trader who makes decisions based on charts that are less than 15 minutes time frame, it may be worth your time to research, back test and do some homework as to potentially using other type of charts like volume charts, Range charts etc.

Volume charts will draw a new bar once a user defined number of contracts traded. An example is the mini SP 10,000 volume chart which will draw a new bar once 10,000 contracts are traded.

Range bar charts will draw new charts once price action has exceeded a user’s pre-defined price or ticks range. An example might be an 18 ticks range bar chart on crude oil.

While volume charts rely ONLY on volume, the range bar charts rely ONLY on price action.

Their main advantage over traditional time charts is twofold in my opinion:

If the market is moving fast, reports have come out or there is heavy volume in the market, the traditional 5 minute chart will need 5 minutes to complete the next bar before it provides you with a signal…if you have day traded futures before you know what 5 minutes can do to these markets….The volume charts or range bar charts in this case will complete the bars MUCH faster because there is strong price action and strong volume and will be able to provide a signal faster than the time charts.

Continue reading “Crude Oil Futures & Economic Reports 5.07.2015”