March 22nd, 2019 - Issue #958

In This Issue
1. Trading 101: Trading videos on bollinger bands, Parabolics, Trading levels
2. Hot Market Report: US Treasury Bonds
3. Economic Calendar
Get Real Time Updates via Twitter!
1. Trading 101: Trading videos on bollinger bands, Parabolics, Trading levels
Watch the latest trading videos we have posted and shared with our clients!
In this week's newsletter we are sharing two videos, each a few minutes long. The videos discuss practical tips for trading and sharing our experience with you
1. Using bolinger Bands as a possible tool for exiting trades
2. One way you can use the Parabolics study ( also known as PSAR) to manage current positions, possibly as a trailing stop
3. Different ways traders can utilize support and resistance levels in their trading.
4. Entering trades on a stop, using "price confirmation".
5. Utilizing Range Bar charts for shorter term trading as a way to try and filter out some noise.
Watch the videos instantly by filling out the short form below
Trading Videos: bollinger, Parabolics, SR levels & More!
Cannon Trading respects your privacy and will never give this information to a 3rd party.
2. Hot Market Report: US Bond futures and the inverted yield curve
By John Thorpe, Senior BrokerClick on image below to enlarge
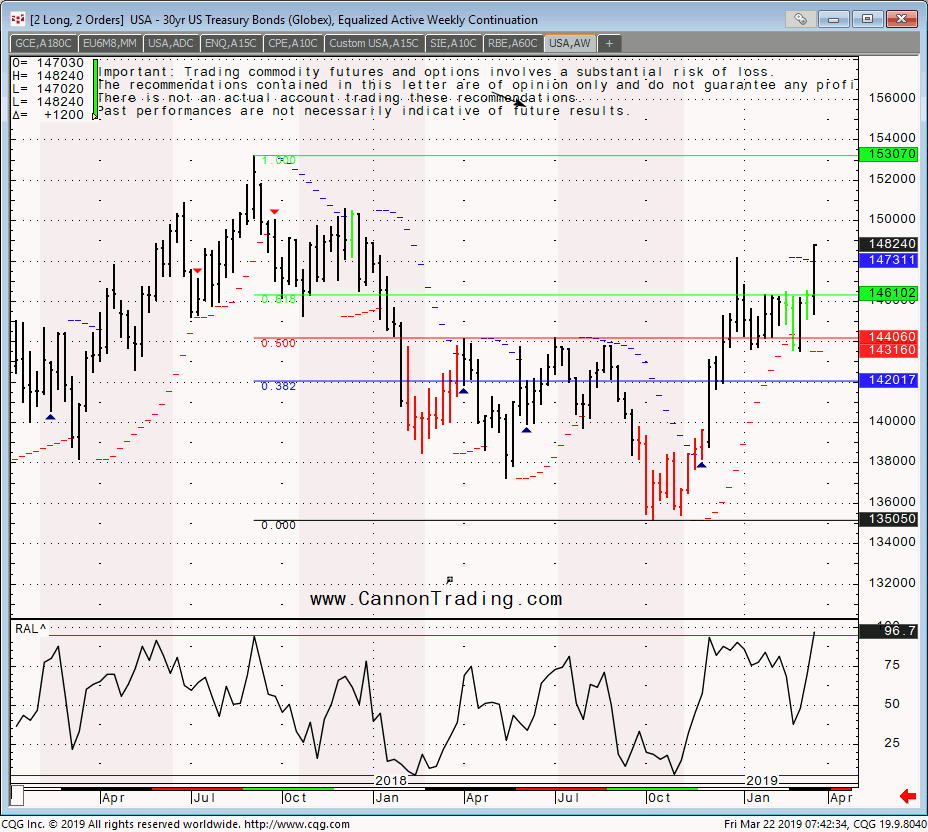 The US 30 year treasury bond market belongs to the "interest rate family" 10 year, 5 year, 2 year notes, the "Ultra bond" and others. All traded on the CBOT exchange.
Weekly chart of T-Bond Futures for your review from this morning ( March 22nd 2019). From the technical perspective, the market is still on an uptrend as long as we stay above the 146.10 area.
More important than the technical picture, is the fundamental outlook and yield curve picture.
It should be no secret by now that the Fed has no desire to raise the fed fund rate for the remainder of 2019.
The Bond market reacted like it’s fuel tank had been drained of ethanol and replaced with Jet Fuel.
Yields on the 30 yr. Plummeted after the announcement as prices skyrocketed.
The yield on the 1 month T-bill is 2.51 % which is higher than the yield on the 2 mo., 3 mo., 6 mo., 1 yr., 2 yr., 3yr., 5yr., 7 yr.
Yes, the yield curve is inverted at the short end.
For the long end we now have yields for the 10 yr @ 2.54, 20 yr @ 2.78 and 30 yr @ 2.96. ( all yields presented published by U.S. Department of Treasury daily)
The Inverted curve the analysts speak of that warms of an economic recession is the relationship between the 2yr and the 10 year note.
Curious the fed, through its monetary policy statements would want to tip the US economy into a recession?
The Bond rally may be overdone in the short-term to the upside, Jet fuel, is the least efficient energy source of all the carbon based fuels.
Bonds are a very liquid market with a relatively LARGE tick size of $31.25. This market offers different type of day-trading vehicle. Different behavior and
personality. I like to look for set ups in this market and the 10 year notes in different ways. One is trying to "SCALP" the large tick size and the other, which I prefer is to look for "longer day trades " using the 15, 30 and 60 minutes charts.
If you are a day-trader, you may want to watch this market, get a feel for the different type of trading it offers versus Indices or crude oil for example and see if it is a "worthy" market to add to your day-trading markets list.
It goes without saying that bonds are an excellent market for options, swing trading and long term trading as well with 23 hours trading, strong volume and excellent liquidity.
To access a free trial to the ALGOS shown in the chart visit and sign up for a free trial for 21 days with real-time data.
30 yr Treasury Bond Futures Specs
Hours: 05:00 PM previous day to 4:00 PM Central Time
Margins: $2880 initial, $2400 Maint. ( as of the date of this newsletter)
Point Value: full point = $1000 ( Example: 144.16 to 145.16 ). Min fluctuation is 0.01 = $31.25 ( Example: 144.16-144.17)
Settlement: Physical Delivery
Months: Quarterly (March,June,Sep,Dec)
Some of the basic fundamentals to keep in mind when you are considering trading the U.S.30yr Treasury Bonds for this matter:
1. Interest Rates.
2. FOMC Rate decisions and Language
3. Focus in macroeconomics
4. Bond Prices have an inverse relationship to Interest rates
5. Correlation to US Dollar prices
6. Inflationary prospects
7. Geopolitical Stability
8. U.S. Fiscal and Monetary Stability
Our brokers here at Cannon will be happy to chat about the Bond market, other interest rate products, other futures, options, futures spreads and much more!
Feel free to contact us at any time.
3. Economic Calendar
Source: Moore Research Center, Inc.
| Date | Reports | Expiration & Notice Dates |
|---|---|---|
| 03/22 Fri |
9:00 AM CDT - Existing Home Sales(Feb)
9:00 AM CDT - Wholesale Inventories(Jan) 1:00 PM CDT - Treasury Budget(Feb) 2:00 PM CDT - Cattle On Feed 2:00 PM CDT - Cold Storage |
FN: Apr Crude Lt(NYM)
LT: Apr 2,5,10 Year Notes Options(CBT) Apr Bonds Options(CBT) Apr Canola Options(CBT) Apr Wheat Options(CBT) Apr Corn Options(CBT) Apr Oats Options(CBT) Apr Rough Rice Options(CBT) Apr Soybeans,Soymeal,Soyoil Options(CBT) |
| 03/25 Mon |
9:00 AM CDT - New Home Sales(Feb)
|
|
| 03/26 Tue |
7:00 AM CDT - S&P Case-Shiller Home Price Index(Jan)
7:30 AM CDT - Housing Starts & Building Permits(Feb) 8:00 AM CDT - FHFA Housing Price Index(Jan) 9:00 AM CDT - Consumer Confidence(Mar) 3:30 PM CDT - API Energy Stocks |
LT: Apr Copper Options(CMX)
Apr Gold & Silver Options(CMX) Apr Natural Gas Options(NYM) Apr RBOB & ULSD Options(NYM) |
| 03/27 Wed |
6:00 AM CDT - MBA Mortgage Index
9:30 AM CDT - EIA Petroleum Status Report 2:00 PM CDT - Dairy Product Sales |
LT: Mar Copper(CMX)
Mar Gold & Silver(CMX) Mar Platinum & Palladium(NYM) Apr Natural Gas(NYM) |
| 03/28 Thu |
7:30 AM CDT - USDA Weekly Export Sales
7:30 AM CDT - Initial Claims-Weekly 7:30 AM CDT - GDP-Third Estimate(Q4) 7:30 AM CDT - GDP Deflator-Third Estimate(Q4) 9:00 AM CDT - Pending Home Sales(Feb) 9:30 AM CDT - EIA Natural Gas Report 3:30 PM CDT - Money Supply |
FN: Apr Natural Gas(NYM)
LT: Mar Feeder Cattle(CME) Mar Feeder Cattle Options(CME) |
| 03/29 Fri |
7:30 AM CDT - Personal Income & Spending(Feb)
7:30 AM CDT - PCE Price Index(Feb) 9:00 AM CDT - Univ Of Mich Consumer Sent-Final(Mar) 11:00 AM CDT - Grain Stocks 11:00 AM CDT - Prospective Plantings |
FN: Apr Copper(CMX)
Apr Gold & Silver(CMX) Apr Platinum & Palladium(NYM) LT: Mar 2,5 Year Notes(CBT) Mar Bitcoin(CME) Mar Fed Funds(CME) Apr RBOB & ULSD(NYM) Mar Fed Funds Options(CME) Apr Lumber Options(CME) |
| 04/01 Mon |
9:00 AM CDT - Construction Spending(Feb)
9:00 AM CDT - ISM Manufacturing Index(Mar) 1:00 PM CDT - Auto & Truck Sales(Mar) 2:00 PM CDT - Cotton System 2:00 PM CDT - Fats & Oils 2:00 PM CDT - Grain Crushings |
|
| 04/02 Tue |
3:30 PM CDT - API Energy Stocks
|
FN: Apr RBOB & ULSD(NYM)
LT: Mar Butter(CME) Mar Milk(CME) Mar Butter Options(CME) Mar Milk Options(CME) |
| 04/03 Wed |
6:00 AM CDT - MBA Mortgage Index
7:15 AM CDT - ADP Employment Change(Mar) 7:30 AM CDT - Trade Balance(Feb) 9:00 AM CDT - Factory Orders(Feb) 9:00 AM CDT - ISM Non-Manufacturing Index(Mar) 9:30 AM CDT - EIA Petroleum Status Report 2:00 PM CDT - Dairy Products Sales |
|
| 04/04 Thu |
7:30 AM CDT - USDA Weekly Export Sales
7:30 AM CDT - Initial Claims-Weekly 9:30 AM CDT - EIA Natural Gas Report 3:30 PM CDT - Money Supply |
|
| FN=First Notice, OE=Option Expiration, LT=Last Trade | ||
* Please note that the information contained in this letter is intended for clients, prospective clients, and audiences who have a basic understanding, familiarity, and interest in the futures markets.
** The material contained in this letter is of opinion only and does not guarantee any profits. These are risky markets and only risk capital should be used. Past performances are not necessarily indicative of future results.
*** This is not a solicitation of any order to buy or sell, but a current market view provided by Cannon Trading Inc. Any statement of facts herein contained are derived from sources believed to be reliable, but are not guaranteed as to accuracy, nor they purport to be complete. No responsibility is assumed with respect to any such statement or with respect to any expression of opinion herein contained. Readers are urged to exercise their own judgment in trading!