August 9th, 2019 - Issue #977

In This Issue
1. Trading 201: Guide to Trading the Mini Dow Jones Futures
2. Hot Market Report: Gold Breaking above $1500
3. Economic Calendar
Get Real Time Updates via Twitter!
1. Trading 201: Guide to Trading the Mini Dow Jones Futures
Mini Dow Jones Futures - The YM
What are the Dow futures?
The E-mini Dow Jones $5 futures contract
( https://www.cannontrading.com/tools/futures-market/indices/E-mini-Dow-Jones-Futures ) is a derivative of the Dow Jones Industrial Average (DJIA), which is a stock index that conveys the value of thirty U.S. based, publicly owned companies. Since the Index’s value was first calculated in 1896 (then, only 12 companies comprised the index), its 30 components have changed 52 times and now include many companies of a non-industrial nature, including Apple, Goldman Sachs, IBM, Intel, and Microsoft. Today, “The Dow” is still one of the most commonly cited and recognized stock indexes in the world. As of Dec. 2018, its market capitalization was valued at $6.56 trillion.
The E-mini Dow Jones $5 futures contract represents a way to take advantage of market exposure to all 30 companies that make up the DJIA by trading a single futures contract. The “Mini Dow” trades electronically 23 hours a day, six days a week on the Chicago Mercantile Exchange ( via the CBOT Chicago Board of trade) division – the world’s largest derivatives exchange – with a ticker symbol YM. It allows the investor to take a position – long or short – in the market on an anticipated move in the DJIA. It also can be used as a hedge against a larger-scale exposure in the market.
Why Trade Dow Futures?
Dow futures (YM) is short for The Dow Jones Industrial Average. This stock market index is one of the three most popular along with ES- S&P 500 and NQ – Nasdaq. The Dow was launched in 1896 and is a group of 30 popular companies based in the United States. The Dow Jones futures are traded on CBOT- Chicago Board of Trade and currently has the lowest overnight margin ($6,050) and a tick size of $5. Recently the CBOT began offering a micro Dow contract symbol MYM, this is 1/10 the size of YM. Dow futures can be used to hedge your positions in the individual stocks you own within the basket.
A few reasons to trade the Dow Futures:
- For hedging purposes of your stock portfolio
- For speculation on the overall index rather than individual stocks.
Most retail clients will trade for speculation, and the rest of this article will detail more than a few ways to speculate on the Dow Futures also known in our commodity world and futures markets as the YM
Day Trading Dow Futures
One way to speculate with the Dow Futures is day-trading, or short-term trading. If a trader opens and closes the position in the same day, it is called day-trading. Day-trading futures allows for even lower margins than the already leveraged contract, and creates a situation where both profits and losses are magnified. For example, on a day where the Dow Jones moves 200 points, a trader can be up or down $1,000 per one mini-dow futures (200*$5 per point). A client with $5,000 account could, in theory, control 10 (yes 10!) mini-dow futures contracts if he or she wanted to be extremely aggressive, in that case a simple 10 point move against you or in your favor would translate to $500, some thing that can happen in seconds….( 10 contracts*$5*10 points).
Unlike day trading individual stocks, day trading the dow futures does not require a $25,000 deposit to one’s stock account. In fact, you can have a futures account as low as $1,000 and still trade the entire Dow futures index.
So now that you understand the attraction of day trading the mini Dow Jones futures contract, let’s take a look at a few ways one can day-trade the Dow futures:
Read Full Article along with Chart Examples
Read Full Article
Cannon Trading respects your privacy and will never give this information to a 3rd party.
2. Hot Market Report: Hot Market Report: Gold Breaking above $1500
By Mark O'Brien, Senior BrokerClick on image below to enlarge
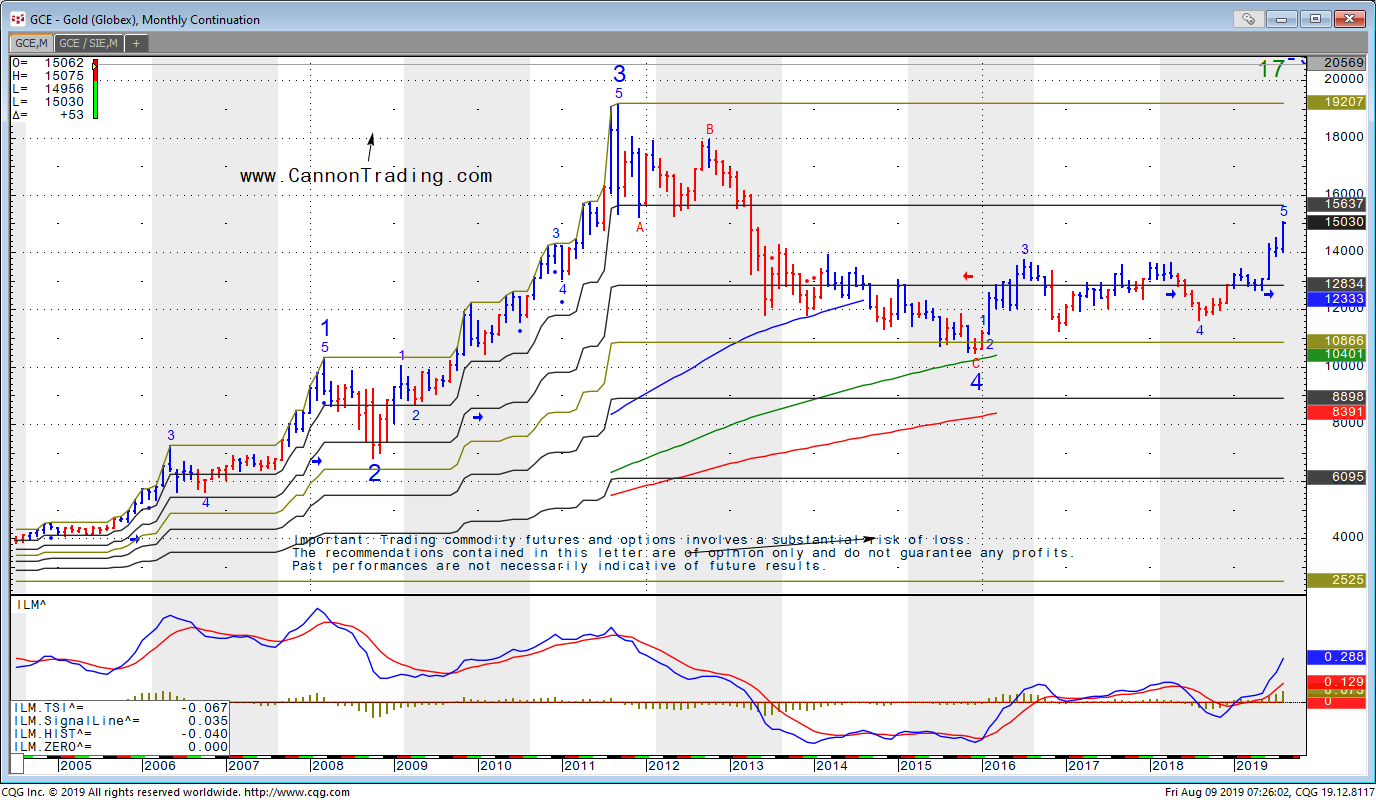
This week’s highlighted Market is Gold. Gold is part of the Precious Metals sector along with its brothers Platinum, Palladium, Silver and Copper.. All traded on the COMEX and NYMEX exchanges.
This week (Wednesday) gold traded up to its highest levels in more than six years – above $1,500 per ounce (December futures contract on the COMEX exchange). Not since April 2013 has it breached that price. That also pushed its 2019 gains above 18%, surpassing the S&P 500’s ±14% year-to-date gains. Reasons abound for gold’s ascent – traditionally considered a safe haven asset in times of uncertainty: The U.S.-China trade hostilities have intensified: the Chinese yuan tumbled past the psychologically important level of 7 to the dollar for the first time since the financial crisis. When the People's Bank of China took steps to stabilize the yuan – a move seen as likely part of the PBOC's defense of Pres. Trump's threat to extend tariffs to essentially all Chinese imports – the U.S. Treasury Department labeled China a currency manipulator for the first time since 1994. That led to the biggest sell-off in U.S. stocks for the year. Trade tensions’ effects have flowed to other shores: New Zealand’s central bank cut interest rates as it faces sluggish growth. The Reserve Bank of India cut interest rates on Tuesday for the fourth straight time. Thailand cited weaker economic growth and also cut rates. Growth, inflation and GDP in the Eurozone have returned to the anemic levels of late last year. Last week the International Monetary Fund cut its global growth outlook for 2019 and 2020 from its April projections. The rising tide of sovereign debt trading at negative yields – estimated currently at $15 trillion – has also pushed investors toward assets better able to retain their value, like gold.
Monthly chart from this morning, (August 9th 2019 2019). While the status of the trade conflict can take sudden turns with each side’s next statement on the subject – via Twitter, press release, or otherwise - none of these bigger trends look to be reversing any time soon. Any further easing of monetary policy by the world’s central banks – with all eyes on the Fed. – will render yields on debt even less attractive as a safe haven and make a stronger case for higher gold prices. Will investors trade into that scenario and push gold toward its 8-year highs above $1,900 oz.?
This chart was prepared using CQG Q Trader software, which you can demo for 14 days with real time data.To access a free trial to the ALGOS shown in the chart ( "early trend identifier" included) along with other tools, visit and sign up for a free trial for 21 days with real time data.
GOLD Futures Specs
Hours: 05:00 PM previous day to 4:00 PM Central Time
Margins: $4440 initial, $4000 Maint. ( as of the date of this newsletter)
Point Value: full point = $100 ( Example: 1285.0 to 1286.0 ). Min fluctuation is 0.1 = $10 ( Example: 1285.5 to 1285.6) Settlement: Physical Delivery
Months: February, April, June, August, October,December. G,J,M,Q,V,Z
Weekly Options:YES
Some of the basic fundamentals to keep in mind when you are considering trading gold futures for this matter:
1. Research supply side in major producing countries.
2. Follow both the jewelry demand and investment demand for silver
3. Focus in macroeconomics not microeconomics
4. Correlation to silver and platinum
5. Correlation to US Dollar prices
6. Inflationary prospects
7. Geopolitical Stability
8. U.S. Fiscal and Monetary Stability
Our brokers here at Cannon will be happy to chat about the gold market, other metals, other futures, options, futures spreads and much more! Feel free to contact us at any time.
3. Economic Calendar
Source: Moore Research Center, Inc.
| Date | Reports | Expiration & Notice Dates |
|---|---|---|
| 08/09 Fri |
7:30 AM CDT - Core PPI & PPI(Jul)
|
FN: Sep Sugar-16(ICE)
LT: Aug Canadian Dollar Options(CME) Aug Currencies Options(CME) Aug Mx Peso Options(CME) Aug US Dollar Index Options(ICE) Sep Coffee Options(ICE) |
| 08/12 Mon |
11:00 AM CDT - WADSE Report & Crop Production
1:00 PM CDT - Treasury Budget(Jul) 3:00 PM CDT - Crop Progress |
|
| 08/13 Tue |
7:30 AM CDT - Core CPI & CPI(Jul)
3:30 PM CDT - API Energy Stocks |
|
| 08/14 Wed |
6:00 AM CDT - MBA Mortgage Index
7:30 AM CDT - Export(ex-ag) & Import(ex-oil) Prices(Jul) 9:30 AM CDT - EIA Petroleum Status Report 2:00 PM CDT - Dairy Product Sales |
LT: Aug Lean Hogs(CME)
Aug Soybeans,Soymeal,Soyoil(CBT) Aug Lean Hogs Options(CME) |
| 08/15 Thu |
7:30 AM CDT - USDA Weekly Export Sales
7:30 AM CDT - Initial Claims-Weekly 7:30 AM CDT - Empire State Manufacturing(Aug) 7:30 AM CDT - Philadelphia Fed Index(Aug) 7:30 AM CDT - Unit Labor Costs-Prel(Q2) 7:30 AM CDT - Productivity-Prel(Q2) 7:30 AM CDT - Retail Sales(Jul) 7:30 AM CDT - Retail Sales Ex-Auto(Jul) 8:15 AM CDT - Capacity Util & Industrial Prod(Jul) 9:00 AM CDT - Business Inventories(Jun) 9:30 AM CDT - EIA Natural Gas Report 11:00 AM CDT - NOPA Crush 3:00 PM CDT - Net Long Term TIC Flows 3:30 PM CDT - Money Supply |
LT: Sep Crude Lt Options(NYM)
Sep Sugar-11 Options(ICE) |
| 08/16 Fri |
7:30 AM CDT - Building Permits & Housing Starts(Jul)
9:00 AM CDT - Univ of Mich Consumer Sent-Prelim(Aug) |
LT: Aug Nikkei Options(CME)
Aug Eurodollar Options(CME) Sep Cotton Options(NYM) Sep Orange Juice Options(ICE) |
| 08/19 Mon |
3:00 PM CDT - Crop Progress
|
FN: Sep Cocoa(ICE)
LT: Aug Eurodollar(CME) Aug Mx Peso(CME) |
| 08/20 Tue |
3:30 PM CDT - API Energy Stocks
|
LT: Sep Crude Lt(NYM)
|
| 08/21 Wed |
9:00 AM CDT - Existing Home Sales(Jul)
9:30 AM CDT - EIA Petroleum Status Report 2:00 PM CDT - Dairy Products Sales |
LT: Sep Platinum Options(NYM)
Sep Palladium Options(NYM) |
| 08/22 Thu |
7:30 AM CDT - USDA Weekly Export Sales
7:30 AM CDT - Initial Claims Weekly 9:00 AM CDT - Leading Indicators(Jul) 9:30 AM CDT - EIA Natural Gas Report 2:00 PM CDT - Cold Storage |
FN: Sep Coffee(ICE)
Sep Crude Lt(NYM) |
| FN=First Notice, OE=Option Expiration, LT=Last Trade | ||
* Please note that the information contained in this letter is intended for clients, prospective clients, and audiences who have a basic understanding, familiarity, and interest in the futures markets.
** The material contained in this letter is of opinion only and does not guarantee any profits. These are risky markets and only risk capital should be used. Past performances are not necessarily indicative of future results.
*** This is not a solicitation of any order to buy or sell, but a current market view provided by Cannon Trading Inc. Any statement of facts herein contained are derived from sources believed to be reliable, but are not guaranteed as to accuracy, nor they purport to be complete. No responsibility is assumed with respect to any such statement or with respect to any expression of opinion herein contained. Readers are urged to exercise their own judgment in trading!