June 12th, 2020 - Issue #1010

In This Issue
1. Trading 201: Recognizing Chart Patterns
2. Hot Market Report: Position Traders Watch Keys in the Crude Oil Market
3. Economic Calendar
Get Real Time Updates via Twitter!
1. Recognizing Chart Patterns
Before Your next Trade, learn to recognize charts and patterns!
Learning the different types of charts and patterns will be another arsenal in your Trading Tools!
Ascending Triangle Futures Trading Chart Pattern
What is an Ascending Triangle Futures Chart Pattern?
 An ascending triangle is a bullish futures pattern that can indicate a breakout in the upwards direction.
How do I Recognize an Ascending Triangle Futures Chart Pattern?
An ascending triangle is formed when resistance remains flat and support rises.
See the example below:

What Does a Ascending Triangle Chart Pattern Mean?
The price will rise and fall within[-] the triangle until support and resistance converge. At that point, the apex, breakout occurs, usually upwards.
Broadening Top Futures Trading Chart Pattern
What is a Broadening Top Futures Chart Pattern?
 A broadening top is a futures chart pattern that can occur on an upwards trend. It is generally classified as a reversal pattern but some traders argue that there is approximately a 50/50 split between whether it tends to move upwards or downwards upon completion of the pattern. For this reason, it can often be avoided by traders. It can be viewed as the opposite of a symmetrical triangle.
How Do I Recognize a Broadening Top Futures Chart Pattern?
A broadening top is comprised of diverging support and resistance lines and resembles a megaphone. The rising resistance line and falling support line continue until the trend reverses.
Sign up below and make sure to provide valid mobile number and email
Chart Patterns 1 & 2
Cannon Trading respects your privacy and will never give this information to a 3rd party.2. >Hot Market Report: Position Traders Watch Keys in the Crude Oil Market
By John Thorpe Senior BrokerClick on image below to enlarge
This week’s highlighted Market is Crude Oil. Crude Oil is part of the energy sector along with "it's" brothers "RBOB - Unleaded gas" and heating oil and cousin, natural gas. All traded on the NYMEX/GLOBEX exchange.
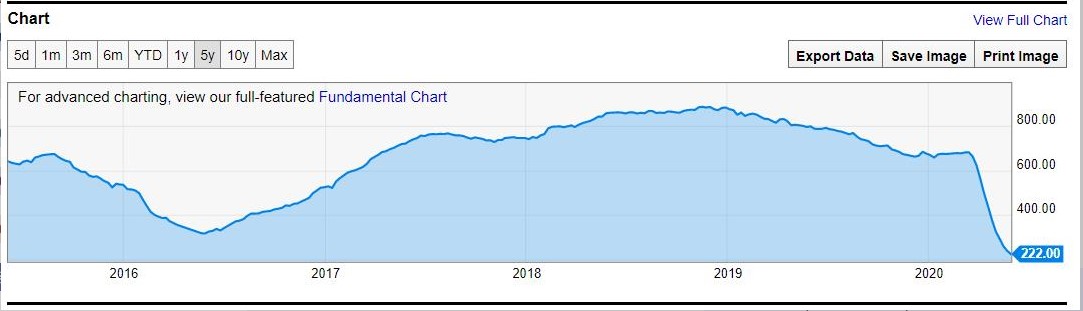
The Baker Hughes Rig Count is the graph you are seeing to your right
This time a bit of a different look at the crude oil market:
We are trading in the GAP left from the first weekend in March. Now that we are here, are we going to fail to close the gap this time? or will we continue forward , filling the gap.
Fundamentally, in order to fill the gap, demand in the short run will need to outstrip supply, not withstanding, a potential short squeeze.
The Market structure is currently normal, in Contango ( deferred months prices are higher than spot month) remember we are now in driving season and driving, is now, once again allowed.
This will help "burn off" the excess fuel left from oversupply. Keep an eye on the weekly Baker Hughes Rig counts to assist in your analysis of the supply side of the equation, higher week over week changes, pull this depressed sector of our economy up little by little.
Oh and by the way pay attention to the open interest changes , December 2021 already has 136194 in open interest as of yesterdays close.
That is more than October 2020.
Crude Oil Futures Specs
Hours: 5:00 PM to 4:00 PM next day PM Central Time
Margins: $8965 initial, $8100 Maint. FRONT MONTH margins are: $9,900 and 9,000 Maint.( as of the date of this newsletter)
Point Value: full point = $1000 ( Example: 71.80 to 72.80 ). Min fluctuation is 0.1 = $10 ( Example: 71.80 to 71.81)
Settlement: Physical, deliverable commodity
Months: Monthly cycle, All Months
Weekly Options:YES
Crude Oil is one of my favorite markets for Day Trading because of the intraday voilatility and movements. Be careful, these factors can work against you or in your favor.
Some of the basic fundamentals to keep in mind when you are considering a trade in the crude oil as well as other energies:
1. Longer term view of current market prices
2. Dates and times of important reports. Namely, Tuesday afternoon report (API) and the DOE report on Wednesday mornings at 10:30 Am EST
3. Weather and Seasonality
4. Correlation to US Dollar prices
5. Inflationary prospects
6. Geopolitical Stability
7. U.S. Fiscal and Monetary Stability
Keep in mind that the GLOBEX/NYMEX also offers the mini Crude oil contract which is half the size and may be a good alternative for smaller/ begginer traders.
MINI Crude Oil Futures Specs
Hours: 5:00 PM to 4:00 PM next day PM Central Time
Margins: $4950 initial, $4500 Maint. ( as of the date of this newsletter)
Point Value: full point = $500 ( Example: 62.80 to 63.80 ). Min fluctuation is 0.25 = $12.5 ( Example: 61.80 to 61.825)
Settlement: Cash Settled commodity one day prior to the Big Contract
Months: Monthly cycle, All Months
Our brokers here at Cannon will be happy to chat about the crude olil market, other energies, other futures, options, futures spreads and much more!
Try a free consultation at any time.
3. Economic Calendar
Source: Moore Research Center, Inc.
| Date | Reports | Expiration & Notice Dates |
|---|---|---|
| 06/12 Fri |
7:30 AM CDT - Export(ex-ag) & Import(ex-oil) Prices(May)
7:30 AM CDT - Export & Import Prices(May) 9:00 AM CDT - Univ of Mich Consumer Sent-Prelim(Jun) |
LT: Jun Lean Hogs(CME)
Jun Lean Hogs Options(CME) Jul Cotton Options(NYM) Jul Coffee Options(ICE) |
| 06/15 Mon |
7:30 AM CDT - Empire State Manufacturing(Jun)
11:00 AM CDT - NOPA Crush 3:00 PM CDT - Net Long-Term TIC Flows(Apr) 3:00 PM CDT - Crop Progress |
LT: Jun Eurodollar(CME)
Jun Currencies(CME) Jun Mx Peso(CME) Jun US Dollar Index(ICE) Jun Eurodollar Options(CME) Jul Sugar-11 Options(ICE) |
| 06/16 Tue |
7:30 AM CDT - Retail Sales(May)
7:30 AM CDT - Retail Sales-Ex Auto(May) 8:15 AM CDT - Capacity Util & Industrial Prod(May) 9:00 AM CDT - Business Inventories(Apr) 9:00 AM CDT - NAHB Housing Market Index(Jun) 3:30 PM CDT - API Energy Stocks |
LT: Jun Canadian Dollar(CME)
|
| 06/17 Wed |
6:00 AM CDT - MBA Mortgage Index
7:30 AM CDT - Building Permits & Housing Starts(May) 9:30 AM CDT - EIA Petroleum Status Report 2:00 PM CDT - Dairy Products Sales |
FN: Jul Cocoa(ICE)
LT: Jul Crude Lt Options(NYM) Jul Platinum & Palladium Options(NYM) |
| 06/18 Thu |
7:30 AM CDT - USDA Weekly Export Sales
7:30 AM CDT - Initial Claims-Weekly 7:30 AM CDT - Philadelphia Fed Index(Jun) 9:30 AM CDT - EIA Natural Gas Report 2:00 PM CDT - Milk Production 3:30 PM CDT - Money Supply |
LT: Jun S&P 500(CME)
Jun S&P 500 Options(CME) |
| 06/19 Fri |
7:30 AM CDT - Current Account Balance(Q1)
2:00 PM CDT - Cattle On Feed |
LT: Jun 10 Year Notes(CBT)
Jun Bonds(CBT) Jun E-Mini Dow(CME) Jun E-Mini S&P 500(CME) Jun E-Mini NASDAQ(CME) Jun Russell(CME) Jun E-Mini Dow Options(CME) Jun E-Mini S&P 500 Options(CME) Jun E-Mini NASDAQ Options(CME) Jun Russell Options(CME) Jul Orange Juice Options(ICE) |
| 06/22 Mon |
9:00 AM CDT - Existing Home Sales(May)
2:00 PM CDT - Cold Storage 3:00 PM CDT - Crop Progress |
FN: Jul Coffee(ICE)
LT: Jul Crude Lt(NYM) |
| 06/23 Tue |
9:00 AM CDT - New Home Sales(May)
3:30 PM CDT - API Energy Stocks |
|
| 06/24 Wed |
6:00 AM CDT - MBA Mortgage Index
8:00 AM CDT - FHFA Housing Price Index(Jun) 9:30 AM CDT - EIA Petroleum Status Report 2:00 PM CDT - Dairy Products Sales |
FN: Jul Cotton(NYM)
Jul Crude Lt(NYM) |
| 06/25 Thu |
7:30 AM CDT - USDA Weekly Export Sales
7:30 AM CDT - Initial Claims-Weekly 7:30 AM CDT - Durable Goods-Ex Transportation(May) 7:30 AM CDT - Durable Orders(May) 7:30 AM CDT - GDP-Third Estimate(Q1) 7:30 AM CDT - GDP Deflator-Third Estimate(Q1) 9:30 AM CDT - EIA Natural Gas Report 2:00 PM CDT - Hogs & Pigs 3:30 PM CDT - Money Supply |
LT: Jul Copper Options(CMX)
Jul Gold & Silver Options(CMX) Jul Natural Gas Options(NYM) Jul RBOB & ULSD Options(NYM) |
| FN=First Notice, OE=Option Expiration, LT=Last Trade | ||
* Please note that the information contained in this letter is intended for clients, prospective clients, and audiences who have a basic understanding, familiarity, and interest in the futures markets.
** The material contained in this letter is of opinion only and does not guarantee any profits. These are risky markets and only risk capital should be used. Past performances are not necessarily indicative of future results.
*** This is not a solicitation of any order to buy or sell, but a current market view provided by Cannon Trading Inc. Any statement of facts herein contained are derived from sources believed to be reliable, but are not guaranteed as to accuracy, nor they purport to be complete. No responsibility is assumed with respect to any such statement or with respect to any expression of opinion herein contained. Readers are urged to exercise their own judgment in trading!