September 6th, 2019 - Issue #980

In This Issue
1. Trading 201: Know Your Chart -- "Gap-to-Gap Influence"
2. Hot Market Report: TRADING RANGE IN CL SOON TO END?
3. Economic Calendar
Get Real Time Updates via Twitter!
1. Trading 201: Know Your Chart -- "Gap-to-Gap Influence"
By Rod David of IF, THEN... MARKET TIMING
Funny things happen while trending to a target. Suddenly, invisible support or resistance seems to appear from nowhere and interfere with the trend. That interference can also launch a price reversal. It can feel like being ambushed, being confidently short as the trend breaks under obvious support, only to see it bottom before reaching its target... and then reversing up more sharply. A lot of these mysterious influences can be identified in advance. Some can be simply eyeballed, so long as you're bothering to look at the chart's prior price action. For example, a late-session return to the opening range tends to react, whatever the ultimate resolution. Also, "filling the gap" back to yesterday's close can be both an attraction, and then a repellent. Rather than notice these influences in retrospect, we should train ourselves to note where they lie before price gets there.
Many influences cannot be eyeballed simply, like Fibonacci projections and retracements. Perhaps their general areas can be guessed at closely, but we want precision where precision is possible, and where it is meaningful to price action.EUREKA! In my studies of gaps, I have discovered a relevant Fibonacci retracement that is highly reliable for influencing price action. The setup's influence might be no more than to cause trending to hesitate before resuming. But often enough to be aware of it, this retracement can stop a trend and launch its reversal.
Finish Article along with chart samples
Finish Article
Cannon Trading respects your privacy and will never give this information to a 3rd party.
2. Hot Market Report: TRADING RANGE IN CL SOON TO END?
By Joe Easton, Senior BrokerClick on image below to enlarge
Crude Oil is part of the energy sector along with "it's" brothers "RBOB - Unleaded gas" and heating oil and cousin, natural gas. All traded on the NYMEX/GLOBEX exchange.
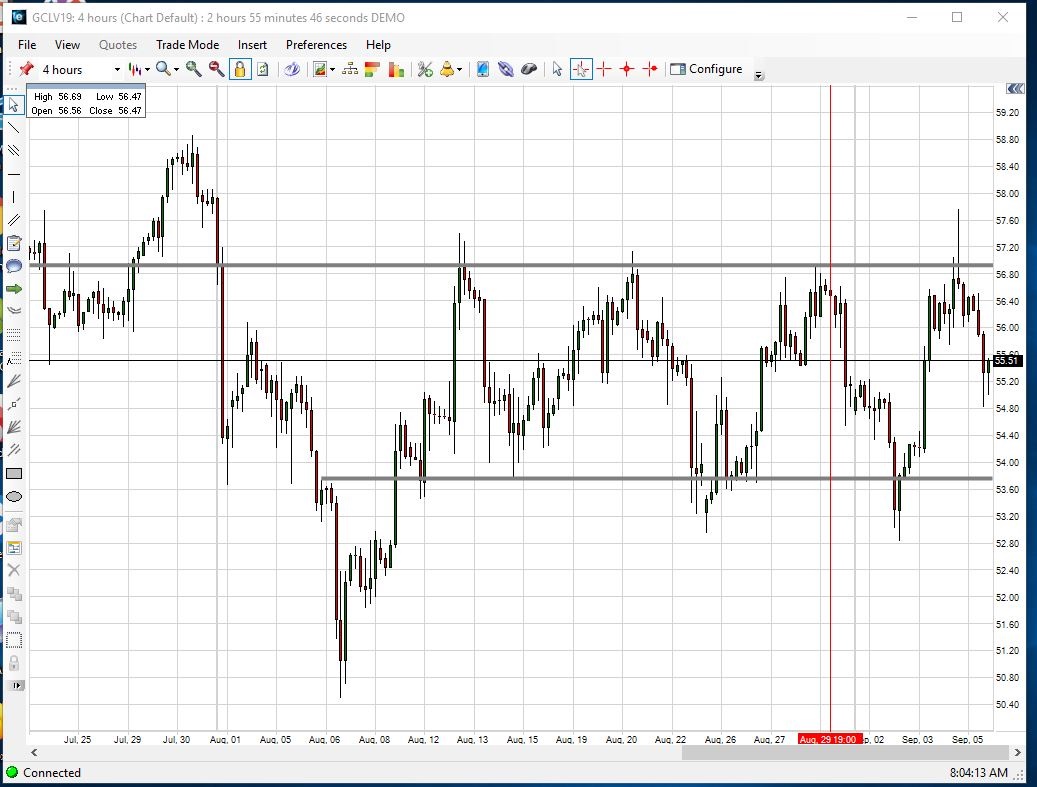
Crude Oil Futures – WTI-- has been in a range between $53 and $57 since the beginning of August. CL Traders know trading ranges like this do not last long for Crude Oil. Crude Oil is one of; if not the most volatile commodity markets. Markets alternate between Range Bound and Trending. Markets that are range bound for long periods are due to break out hard and fast. It is up to the trader to determine the direction of the breakout and typically you can measure out the pattern. For this trade we are looking for a move of $4 (range) to either $61 or $49. As you can see, there have been four solid rejections of the upper limit. The most recent move up cleared the range however, prices closed inside the range. This lack of follow through could be read as a bearish sign. The weekly close from July 19 at $55.96 is a good level to watch.
Four Hour chart from this morning, (Sept. 6th 2019).
This chart was prepared using our FREE E-Futures Int'l software, which you can demo for 28 days with real time data.To access a free trial to the ALGOS shown in the chart ( "early trend identifier" included) along with other tools, visit and sign up for a free trial for 21 days with real time data.
On a different note, Crude Oil futures are fastly becoming one of the more popular contracts for day-trading as volatility, speed, price fluctuations are all there for the double edge sword, day-traders love.
Keep in mind that the GLOBEX/NYMEX also offers the mini Crude oil contract which is half the size and may be a good alternative for smaller/ begginer traders.MINI Crude Oil Futures Specs
Hours: 5:00 PM to 4:00 PM next day PM Central Time
Margins: $1705 initial, $1550 Maint. ( as of the date of this newsletter)
Point Value: full point = $500 ( Example: 62.80 to 63.80 ). Min fluctuation is 0.25 = $12.5 ( Example: 61.80 to 61.825)
Settlement: Cash Settled commodity one day prior to the Big Contract
Months: Monthly cycle, All Months
Crude Oil Futures Specs
Hours: 5:00 PM to 4:00 PM next day PM Central Time
Margins: $3410 initial, $3100 Maint. ( as of the date of this newsletter)
Point Value: full point = $1000 ( Example: 71.80 to 72.80 ). Min fluctuation is 0.1 = $10 ( Example: 71.80 to 71.81)
Settlement: Physical, deliverable commodity
Months: Monthly cycle, All Months
Weekly Options:YES
Crude Oil is one of my favorite markets for Day Trading because of the intraday voilatility and movements. Be careful, these factors can work against you or in your favor.
Some of the basic fundamentals to keep in mind when you are considering a trade in the crude oil as well as other energies:
1. Longer term view of current market prices
2. Dates and times of important reports. Namely, Tuesday afternoon report (API) and the DOE report on Wednesday mornings at 10:30 Am EST
3. Weather and Seasonality
4. Correlation to US Dollar prices
5. Inflationary prospects
6. Geopolitical Stability
7. U.S. Fiscal and Monetary Stability
Our brokers here at Cannon will be happy to chat about the crude olil market, other energies, other futures, options, futures spreads and much more!
3. Economic Calendar
Source: Moore Research Center, Inc.
| Date | Reports | Expiration & Notice Dates |
|---|---|---|
| 09/06 Fri |
7:30 AM CDT - USDA Weekly Export Sales
7:30 AM CDT - Ave Workweek & Hourly Earnings(Aug) 7:30 AM CDT - Nonfarm Payrolls(Aug) 7:30 AM CDT - Unemployment Rate(Aug) |
LT: Sep Canadian Dollar Options(CME)
Sep Currencies Options(CME) Sep Mx Peso Options(CME) Sep US Dollar Index Options(ICE) Sep Live Cattle Options(CME) Oct Cocoa Options(ICE) |
| 09/09 Mon |
2:00 PM CDT - Consumer Credit(Jul)
3:00 PM CDT - Crop Progress |
|
| 09/10 Tue |
3:30 PM CDT - API Energy Stocks
|
LT: Sep Orange Juice(ICE)
|
| 09/11 Wed |
6:00 AM CDT - MBA Mortgage Index
7:30 AM CDT - Core PPI & PPI(Aug) 9:00 AM CDT - Wholesale Inventories(Jul) 9:30 AM CDT - EIA Petroleum Status Report 2:00 PM CDT - Dairy Products Sales |
|
| 09/12 Thu |
7:30 AM CDT - USDA Weekly Export Sales
7:30 AM CDT - Initial Claims-Weekly 7:30 AM CDT - Core CPI & CPI(Aug) 9:30 AM CDT - EIA Natural Gas Report 11:00 AM CDT - WADSE Report & Crop Production 1:00 PM CDT - Treasury Budget(Aug) 3:30 PM CDT - Money Supply |
LT: Sep Nikkei(CME)
Sep Nikkei Options(CME) |
| 09/13 Fri |
7:30 AM CDT - Import (ex-ag) & Import (ex-oil) Prices(Aug)
7:30 AM CDT - Retail Sales(Aug) 7:30 AM CDT - Retail Sales Ex-Auto(Aug) 9:00 AM CDT - Business Inventories(Jul) 9:00 AM CDT - Univ of Mich Consumer Sentiment-Prelim(Sep) |
LT: Sep Wheat(CBT)
Sep Corn(CBT) Sep Oats(CBT) Sep Corn(CBT) Sep Rough Rice(CBT) Sep Soybeans,Soymeal,Soyoil(CBT) Sep Lumber(CME) Sep Cocoa(ICE) Oct Cotton Options(NYM) Oct Coffee Options(ICE) |
| 09/16 Mon |
7:30 AM CDT - Empire State Manufacturing(Sep)
11:00 AM CDT - NOPA Crush 3:00 PM CDT - Crop Progress |
FN: Sep Lumber(CME)
LT: Sep Currencies(CME) Sep Eurodollar(CME) Sep Mx Peso(CME) Sep US Dollar Index(ICE) Sep Eurodollar Options(CME) Oct Sugar-11 Options(ICE) |
| 09/17 Tue |
8:15 AM CDT - Capacity Util & Industrial Prod(Aug)
3:00 PM CDT - Net Long-Term TIC Flows(Jul) 3:30 PM CDT - API Energy Stocks |
LT: Sep Canadian Dollar(CME)
Oct Crude Lt Options(NYM) |
| 09/18 Wed |
6:00 AM CDT - MBA Mortgage Index
7:30 AM CDT - Building Permits & Housing Starts(Aug) 9:30 AM CDT - EIA Petroleum Status Report 1:00 PM CDT - FOMC Rate Decision 2:00 PM CDT - Dairy Products Sales |
LT: Sep Coffee(ICE)
Oct Platinum Options(NYM) Oct Palladium Options(NYM) |
| 09/19 Thu |
7:30 AM CDT - USDA Weekly Export Sales
7:30 AM CDT - Initial Claims-Weekly 7:30 AM CDT - Current Account Balance(Q2) 7:30 AM CDT - Philadelphia Fed Index(Sep) 9:00 AM CDT - Existing Home Sales(Aug) 9:00 AM CDT - Leading Indicators(Aug) 9:30 AM CDT - EIA Natural Gas Report 3:30 PM CDT - Money Supply |
LT: Sep 10 Year Notes(CBT)
Sep Bonds(CBT) Sep S&P 500(CME) Sep S&P 500 Options(CME) |
| FN=First Notice, OE=Option Expiration, LT=Last Trade | ||
* Please note that the information contained in this letter is intended for clients, prospective clients, and audiences who have a basic understanding, familiarity, and interest in the futures markets.
** The material contained in this letter is of opinion only and does not guarantee any profits. These are risky markets and only risk capital should be used. Past performances are not necessarily indicative of future results.
*** This is not a solicitation of any order to buy or sell, but a current market view provided by Cannon Trading Inc. Any statement of facts herein contained are derived from sources believed to be reliable, but are not guaranteed as to accuracy, nor they purport to be complete. No responsibility is assumed with respect to any such statement or with respect to any expression of opinion herein contained. Readers are urged to exercise their own judgment in trading!