Volatility Tips, December Crude Oil, Bollinger Bands & Parabolics, Levels, Reports; Your 5 Important Must-Knows for Trading Futures on October 17th, 2025

9dc1e02e d5f7 4ff4 abf7 1df60775f196

Volatility Pointers

volatility

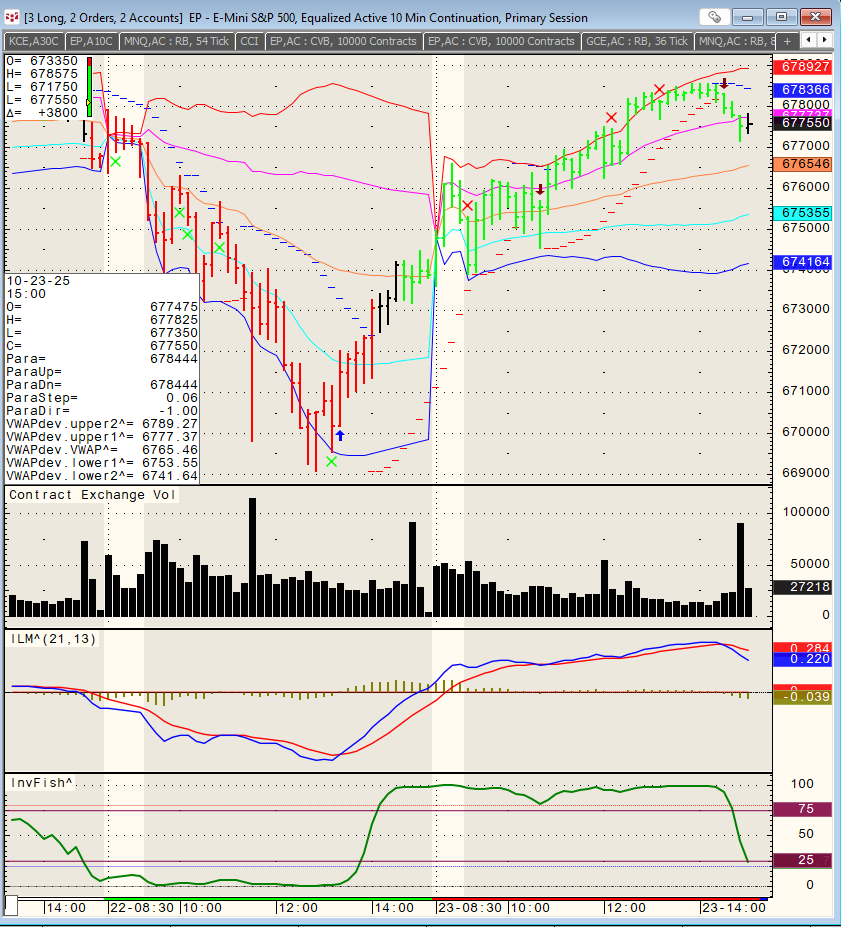
The last few trading sessions we saw tremendous volatility across many markets.

Here are some ideas to explore during times like these:

1.      You don’t have a crystal ball. To think you can buy an ES contract in this volatility and use a 2 point stop in hopes of making 20 points profit is a very low probability event…you would need to buy it at the PEREFECT time for this to happen. Point is, with higher volatility you need to use WIDER stops to give yourself a chance. That may mean using SMALLER trade size.

2.      If you are able to, share your read with another trader, it may provide you with a better perspective just by sharing.

3.      If you think there is room for a big move or what we call a “runner” – be prepared to for the pullbacks. Use multiple time frames to gain a better perspective and hang in there for the big move, if this is what you think can happen.

4.      If you have enough risk capital, try to use multiple contracts, example buying 2 rather than 1. Taking profit on the first part of the position will help you relax and look at what the market is really telling you rather than what you would like it to say. It helps reduce both the fear and the greed.

5.    “Plan your trade, trade your plan”

Again, these are just some short pointers, written quickly after today’s session in hopes of helping you when you face a similar situation.

S

How I like to Use Bollinger Bands and Parabolics for Trade Exits

thumbnail?url=https%3A%2F%2Fi.ytimg.com%2Fvi%2FGVAEEPfC5nQ%2Fhqdefault

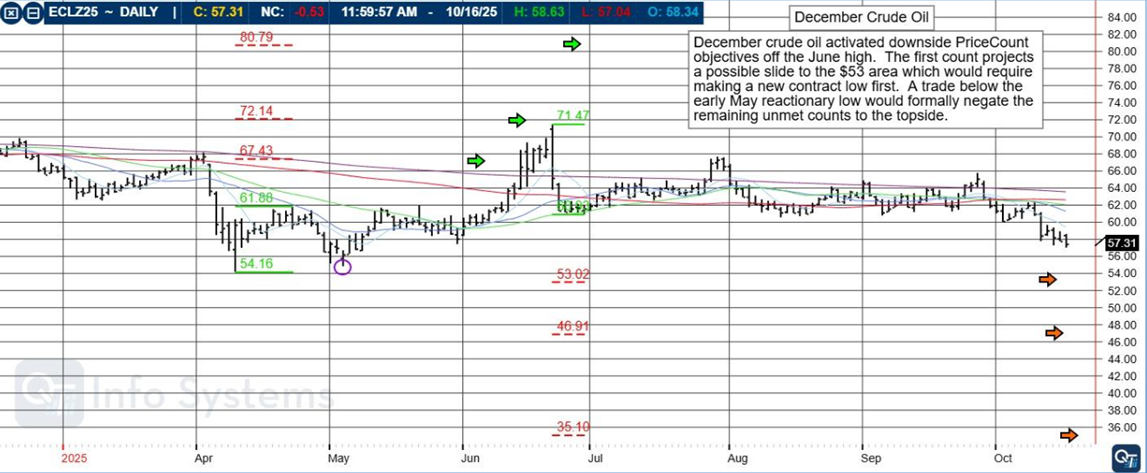
December Crude Oil

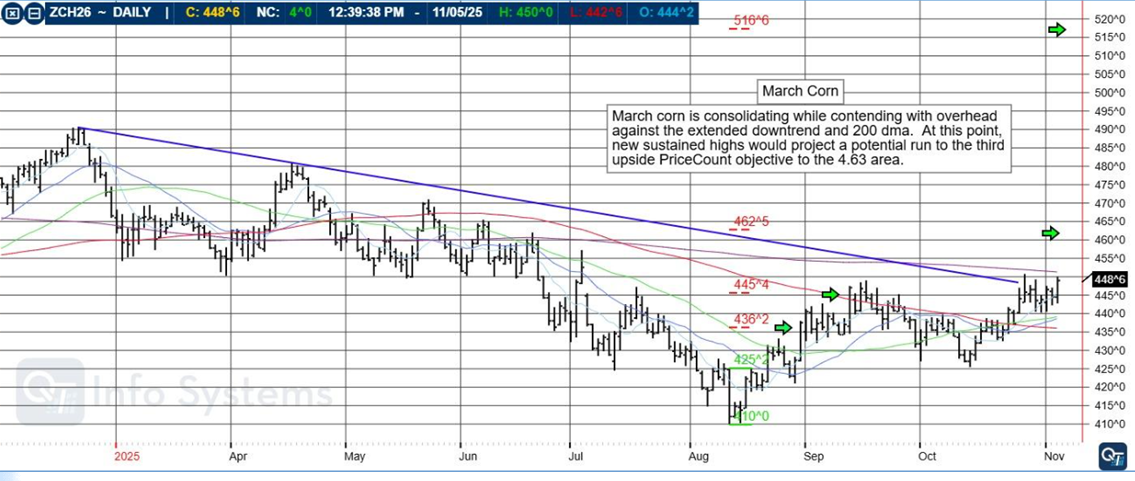
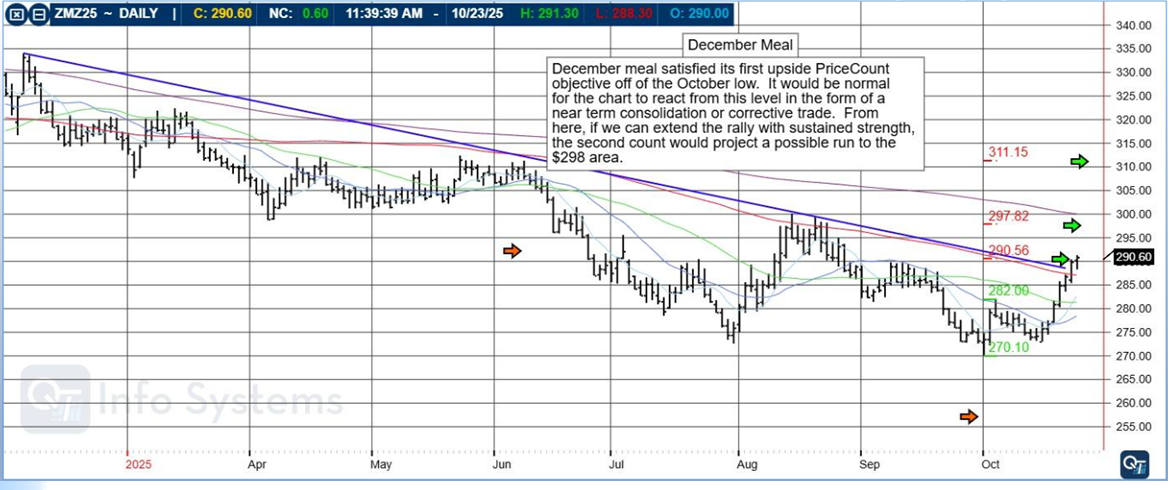
December crude oil activated downside PriceCount objectives off the June high. The first count projects a possible slide to the $53 area which would require making a new contract low first. A trade below the early May reactionary low would formally negate the remaining unmet counts to the topside.

6b78c197 9b97 49d0 99bf 9f645e885998

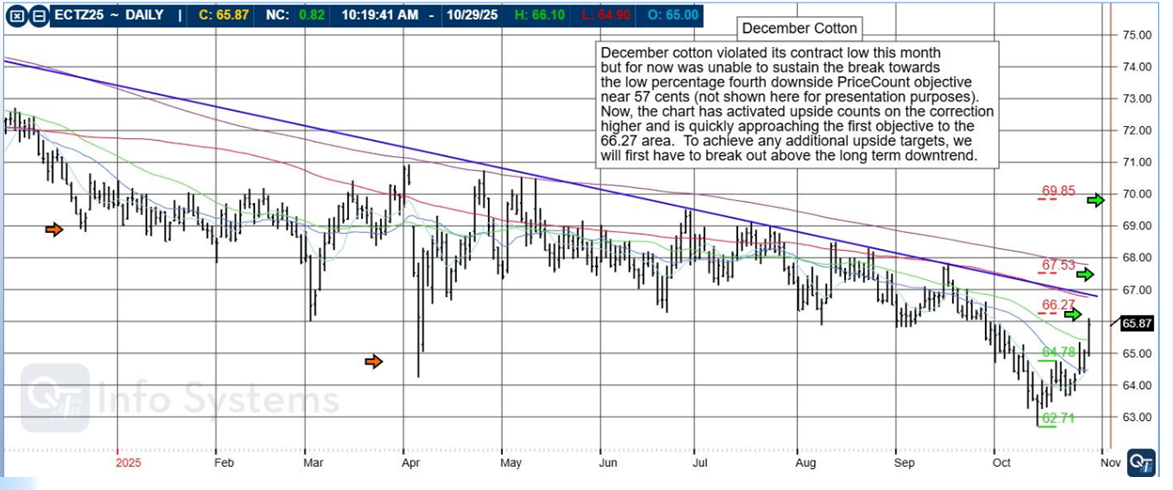
The PriceCount study is a tool that can help to project the distance of a move in price. The counts are not intended to be an ‘exact’ science but rather offer a target area for the four objectives which are based off the first leg of a move with each subsequent count having a smaller percentage of being achieved.

It is normal for the chart to react by correcting or consolidating at an objective and then either resuming its move or reversing trend. Best utilized in conjunction with other technical tools, PriceCounts offer one more way to analyze charts and help to manage your positions and risk. Learn more at www.qtchartoftheday.com

Trading in futures, options, securities, derivatives or OTC products entails significant risks which must be understood prior to trading and may not be appropriate for all investors. Past performance of actual trades or strategies is not necessarily indicative of future results.

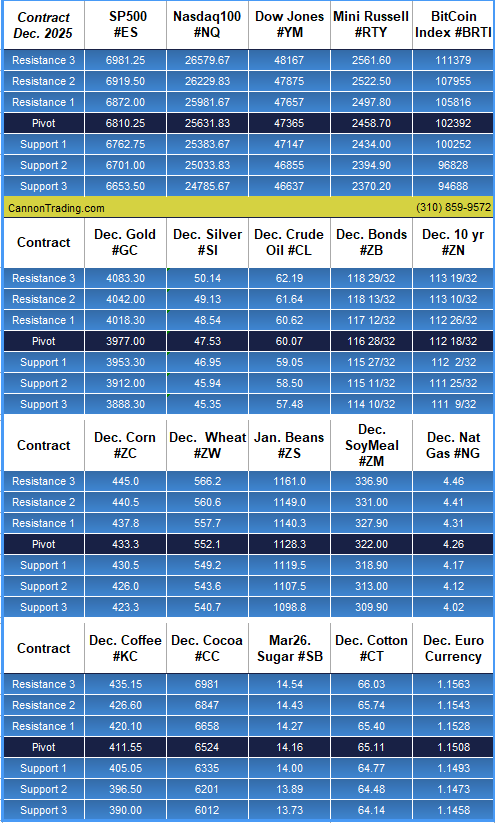
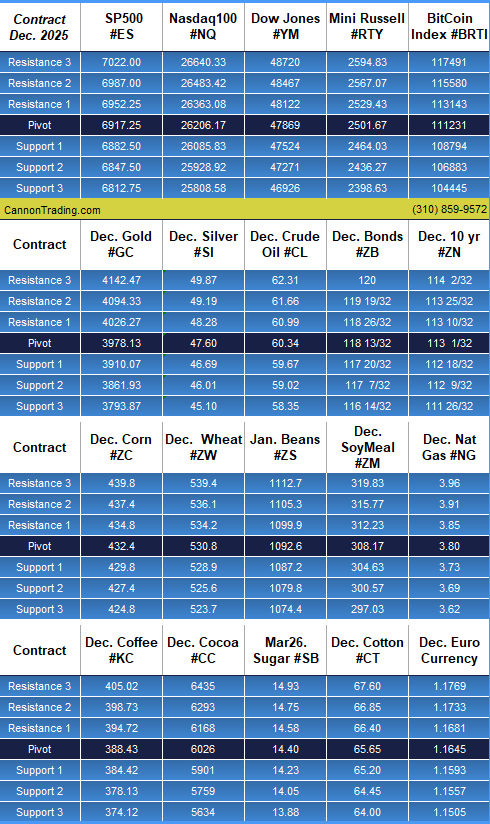
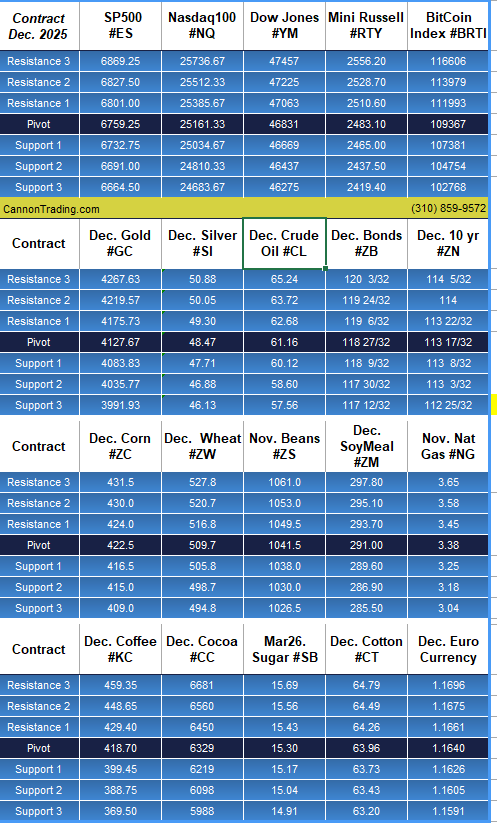
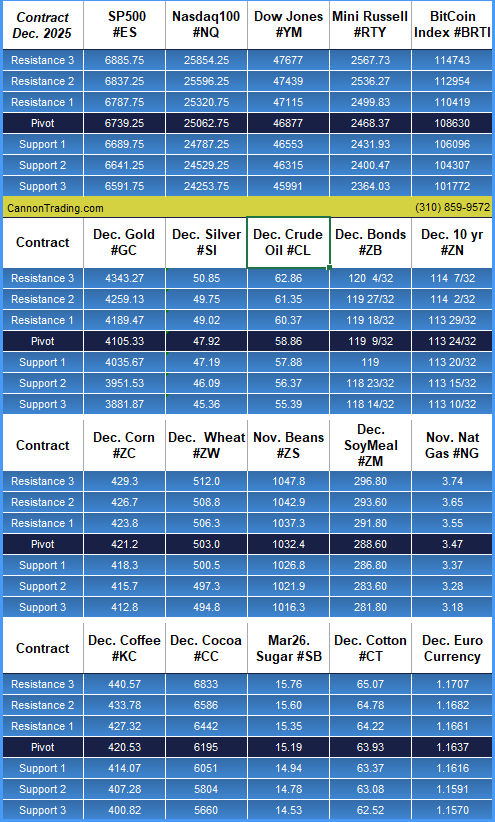
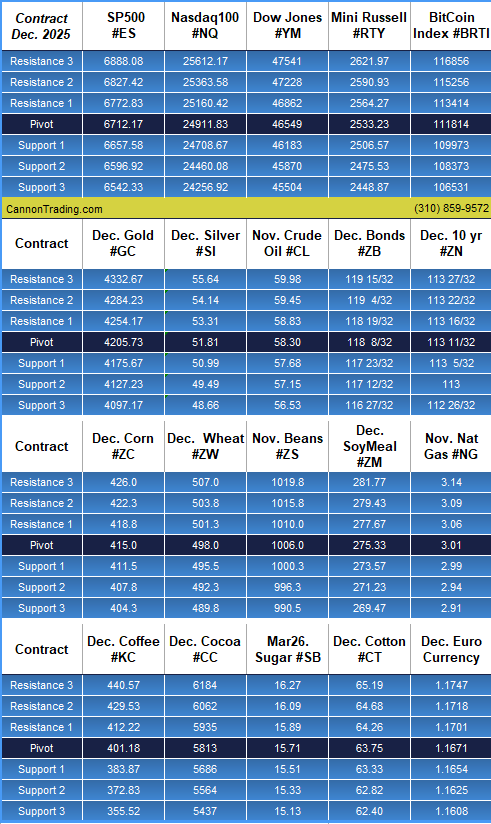
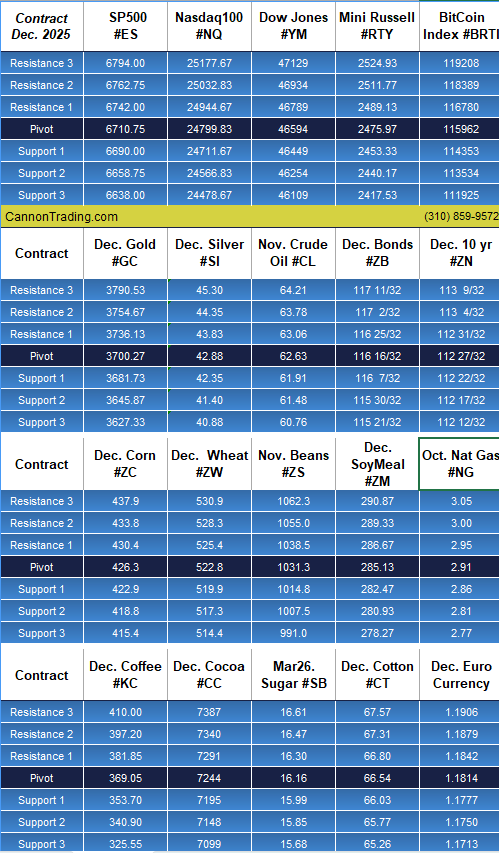
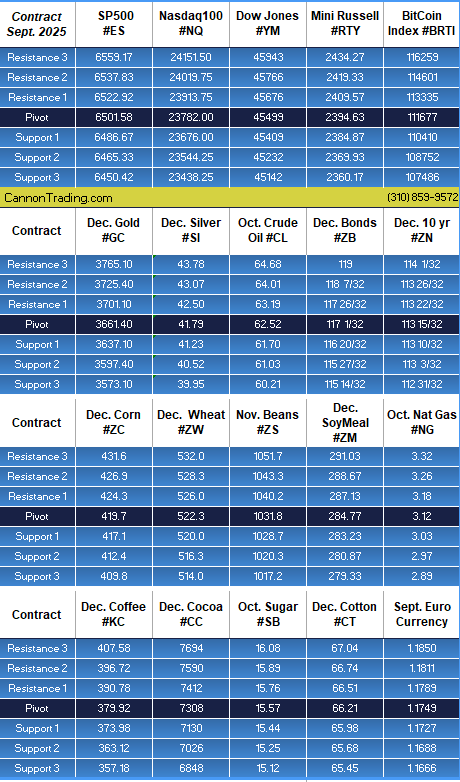
Daily Levels for Oct. 17th, 2025

1df27d3b 6c8a 496b abdd 939f400da5cc

Want to feature our updated trading levels on your website? Simply paste a small code, and they’ll update automatically every day!

Click here for quick and easy instructions.

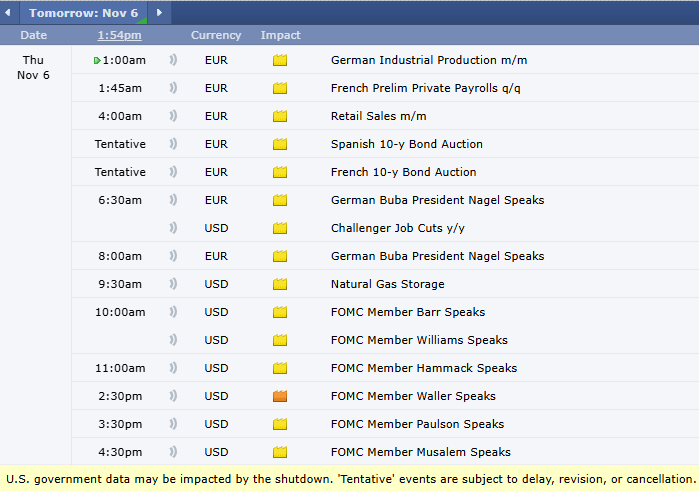
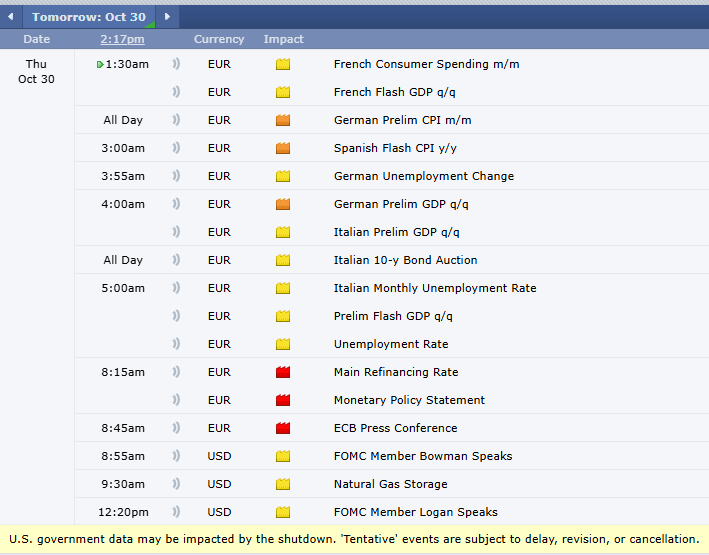
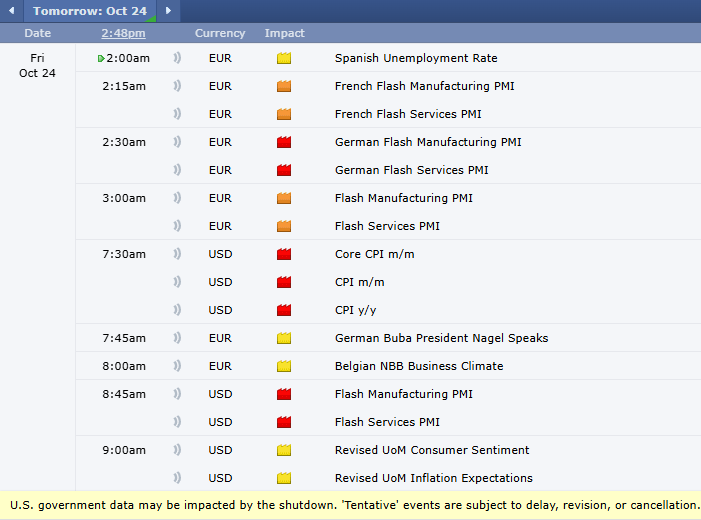
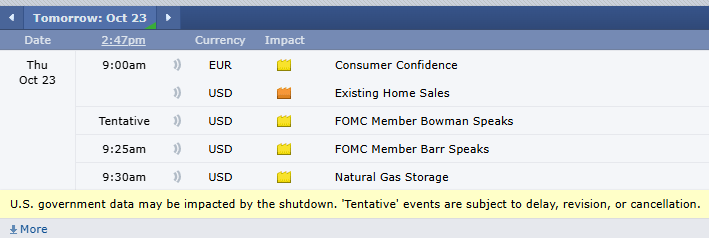
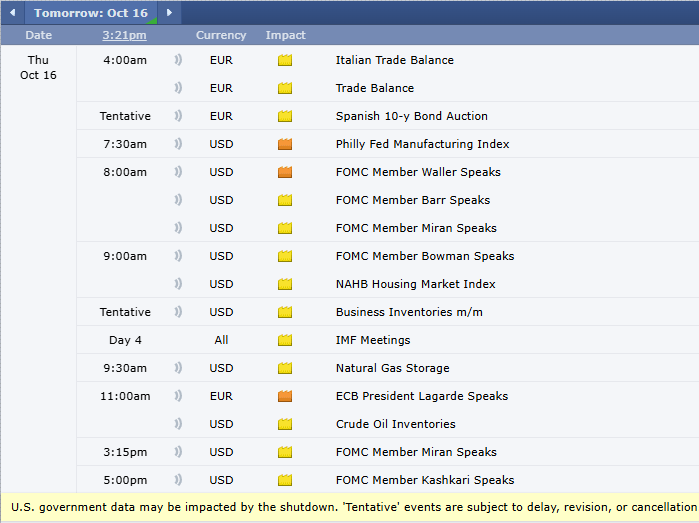
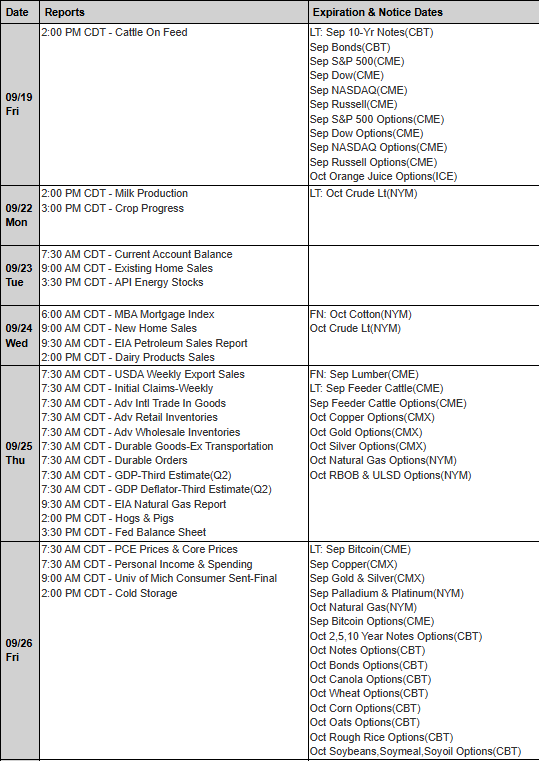
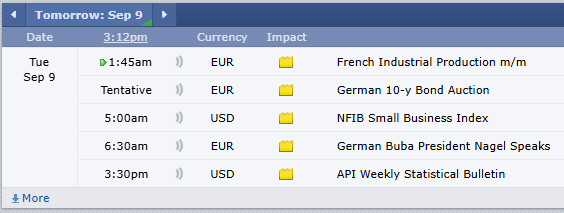
Economic Reports

 U.S. government data may be impacted by the shutdown. ‘Tentative’ events are subject to delay, revision, or cancellation

provided by: ForexFactory.com

All times are Central Time ( Chicago)

b5108d77 aa7b 41b0 88a3 7df07bc5057e

Find us on Trustpilot

stars

Trading Futures, Options on Futures, and retail off-exchange foreign currency transactions involves substantial risk of loss and is not suitable for all investors. You should carefully consider whether trading is suitable for you in light of your circumstances, knowledge, and financial resources. You may lose all or more of your initial investment. Opinions, market data, and recommendations are subject to change at any time.

Join our Private Facebook group

Subscribe to our YouTube Channel

Listen to our podcast: Subscribe on AppleSpotify, Amazon

or wherever you listen to podcasts!

S
Facebook  Instagram  LinkedIn
S
ef3ab1c9 8d6d 4e60 a3f1 af5d9d4ecbb3
Services
Software
Tools
Community
Contact

Price Extremes: Gold, Silver, Crude Oil; December KC Wheat, Levels, Reports; Your 4 Important Must-Knows for Trading Futures on October 16th, 2025

9dc1e02e d5f7 4ff4 abf7 1df60775f196

Price Extremes

By Mark O’Brien, Senior Broker

price

General:

Day 15 of the U.S Government shutdown.

Stock Index Futures:

Dec. stock index futures returned to solid gains late today as markets remained alert over US-China trade tensions and amid hopes for interest rate cuts and strong quarterly earnings results from Wall Street banks. Traders have cemented bets on a rate cut later this month, and odds of a rate cut in December have jumped in recent days to around 96% according to the CME Group FedWatch tool:

Prices Metals:

It’s the broken record metals report. Dec. gold futures rose to new all-time highs today – its 47th new record of the year – trading up to $4,235.80/ounce intraday.

Alongside gold, Dec. silver rocketed up nearly $2.00/oz. today to set its own all-time record high, trading intraday up to $52.55/ounce. This after yesterday when the contract took out a 45-year-old record closing price of $48.70/ounce, during the time when the Hunt brothers tried to corner the market.

Prices Energies:

November crude oil futures have remained on their lows this week – with a new multi-month intraday low of $58.20/barrel on continued concerns about oversupply and the possible impact on demand of rekindled U.S.-China trade tensions – its fourth day in a row closing below $60/barrel.

Livestock:

Dec. live cattle and Jan. feeder cattle both closed little changed today and within pennies of their own all-time record high closing prices at the close of trading yesterday. Tight supplies and strong feeder markets pushed cash cattle higher and the futures markets followed suit. The supply of cattle has lingered at a near 75-year low, with the closure of the US-Mexico border to Mexican cattle imports further constraining an already tight supply.

December KC Wheat

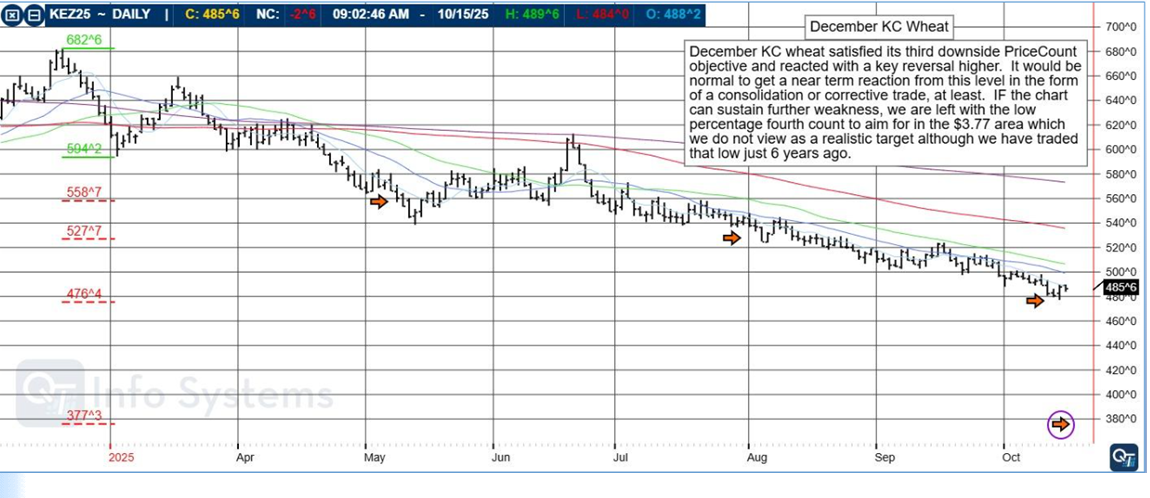
December KC wheat satisfied its third downside PriceCount objective and reacted with a key reversal higher. It would be normal to get a mean reversion from this level in the form of a consolidation or corrective phase, at least. If the chart can sustain further weakness, we are left with the low percentage fourth count to aim for in the $4.37 area. That we trade down to this level is a realistic target although we have traded that low just 5 years ago.
1c13b4e3 2017 45b8 95b1 d6fa33b970f3

The PriceCount study is a tool that can help to project the distance of a move in price. The counts are not intended to be an ‘exact’ science but rather offer a target area for the four objectives which are based off the first leg of a move with each subsequent count having a smaller percentage of being achieved.

It is normal for the chart to react by correcting or consolidating at an objective and then either resuming its move or reversing trend. Best utilized in conjunction with other technical tools, PriceCounts offer one more way to analyze charts and help to manage your positions and risk. Learn more at www.qtchartoftheday.com

Trading in futures, options, securities, derivatives or OTC products entails significant risks which must be understood prior to trading and may not be appropriate for all investors. Past performance of actual trades or strategies is not necessarily indicative of future results.

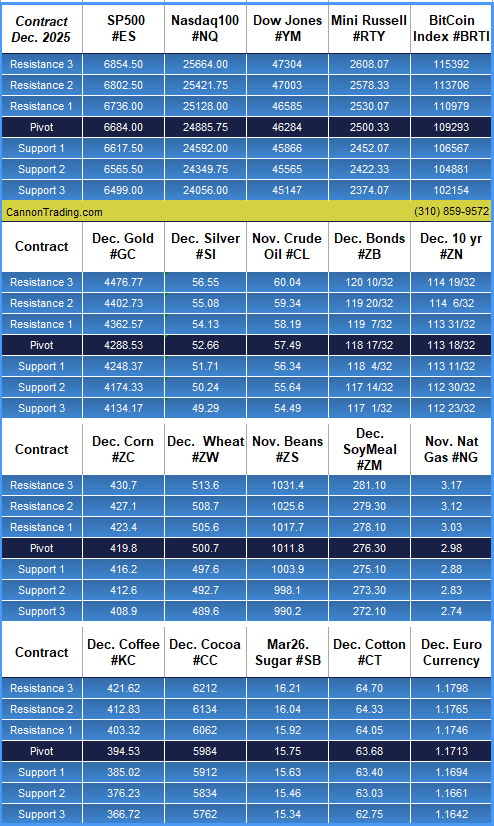
Daily Levels for Oct. 16th, 2025

e61dfc9c d657 475c a0a4 a04e2f557b54

Want to feature our updated trading levels on your website? Simply paste a small code, and they’ll update automatically every day! 

Click here for quick and easy instructions.

Economic Reports

 U.S. government data may be impacted by the shutdown. ‘Tentative’ events are subject to delay, revision, or cancellation

provided by: ForexFactory.com

All times are Central Time ( Chicago)

fa8ff153 1a04 4f4e af5c 453004f6ed84

Find us on Trustpilot

stars

Trading Futures, Options on Futures, and retail off-exchange foreign currency transactions involves substantial risk of loss and is not suitable for all investors. You should carefully consider whether trading is suitable for you in light of your circumstances, knowledge, and financial resources. You may lose all or more of your initial investment. Opinions, market data, and recommendations are subject to change at any time.

Join our Private Facebook group

Subscribe to our YouTube Channel

Listen to our podcast: Subscribe on AppleSpotify, Amazon

or wherever you listen to podcasts!

S
Facebook  Instagram  LinkedIn
S
ef3ab1c9 8d6d 4e60 a3f1 af5d9d4ecbb3
Services
Software
Tools
Community
Contact


Day Trading Week! Fed Speakers, December Hogs, Swing Trading, Levels, Reports; Your 6 Important Need-To-Knows for Trading Futures the Week of October 13th, 2025

7cfe5b36 db9f 4933 824a 7f264613e7fe

Cannon Futures Weekly Letter

In Today’s Issue #1262

  • The Week Ahead – Fed Speakers Galore…

  • Futures 101 – Podcast: Insight into Day Trading Futures

  • Hot Market of the Week – Dec. Hogs

  • Broker’s Trading System of the Week – Mini SP Swing Trading System 

  • Trading Levels for Next Week
  • Trading Reports for Next Week

Important Notices: The Week Ahead

By John Thorpe, Senior Broker

day trading

Traders, much like the Federal Reserve Board, are dependent on data that, during a government shutdown is barely existent. 17 Fed speakers!  The markets are sure to move then, but wait, that’s not all, Fed Chair Powell on Economic Outlook and Monetary Policy.

As for earnings reports? Q3 begins next week!  Major Banks report first. (see Below)

The on again off again nature of Tariff news has created golden opportunities for breakouts in some markets, rangebound trades in others.  The gold market exploded out of its range I have been writing about for months.  Watch Crude oil to see if it stays in its $60.00-$65.00 range and the Dollar index too! The longer the range trade the harder and faster the breakout typically is.

Continued volatility to come as next week all markets will be reacting to whatever comes out of U.S. Govt leadership relating to conflicts cessation and trade deals, China, India, Canada and Russia (looks like the EU is following Trump on this one) The Crude Oil market certainly believes so.. Also, remember that Mexico’s extension will end October 29.

We’ll see you next week! Please enjoy a safe and memorable weekend.

 Earnings Next Week:

  • Mon. Quiet
  • Tue. JPM , JNJ, WFG, GS, BLK, C
  • Wed.  BAC, MS, ABT,
  • Thu. SCHW, BK, USB
  • Fri.   AXP,

FED SPEECHES: (all times CDT)

  • Mon.  Paulson 11:55 am,
  • Tues.  Bowman 7:45, Fed Chair Powell 11:20am, Waller 2:25, Collins 2:30
  • Wed.   Bostic 11:10, Miran 11:30, Waller Noon,
  • Thu.     Barkin 7:00am, Barr, Miran, Waller all 8:00am, Bowman 9:00am , Barkin 10:45am, Miran 3:15pm, Kashkari, 5:00pm
  • Fri.      Musalem 11:15

Economic Data week: 

  • Mon.  with the government shutdown, data will be suspended.
Join us for an exclusive webinar on “Futures Spread Trading,” where you’ll discover the powerful strategies professional traders use to capitalize on market opportunities while managing risk. Whether you’re a seasoned investor or just starting out, this session will break down the essentials of spread trading, uncover actionable techniques, and show you how to navigate the futures market with confidence. Don’t miss this chance to learn from industry experts and take your trading skills to the next level—reserve your spot today!
0d2eda99 dc22 4a53 a1e3 b347a3c01bf5

Day Trading Futures

thumbnail?url=https%3A%2F%2Fi.ytimg.com%2Fvi%2FjEtPhWg91z4%2Fhqdefault

Hot Market of the Week

Hot market of the week is provided by QT Market Center, A Swiss army knife charting package that’s not just for Hedgers, Cooperatives and Farmers alike but also for Spread traders, Swing traders and shorter time frame application for intraday traders with a unique proprietary indicator that can be applied to your specific trading needs.

Free Trial Available

Dec. Hogs

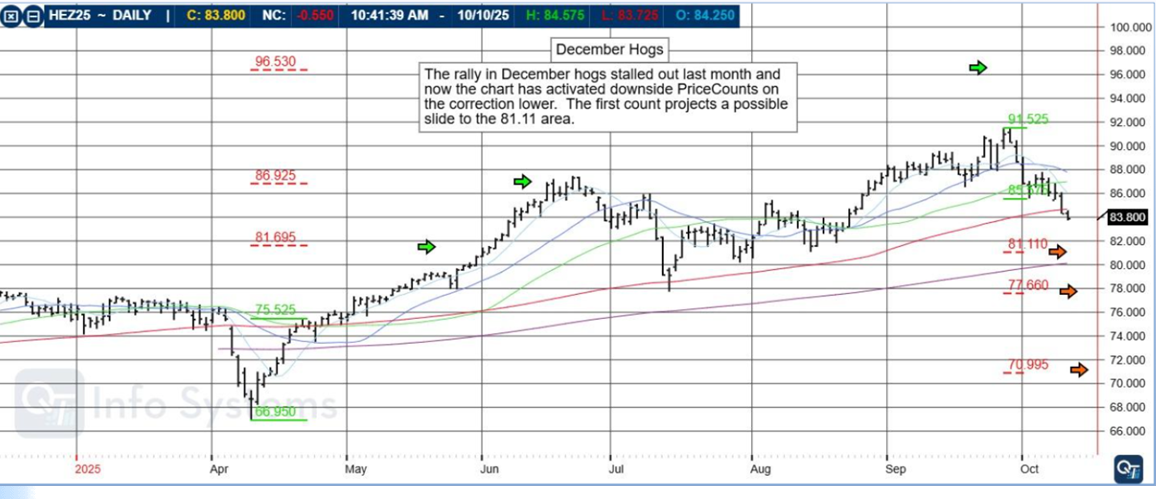
The rally in December hogs stalled out last month and now the chart has activated downside PriceCounts on the correction lower. The first count projects a possible slide to the 81.11 area.”

7a467b43 7646 4910 98e4 46fa4fb48f4b

The PriceCount study is a tool that can help to project the distance of a move in price. The counts are not intended to be an ‘exact’ science but rather offer a target area for the four objectives which are based off the first leg of a move with each subsequent count having a smaller percentage of being achieved.

It is normal for the chart to react by correcting or consolidating at an objective and then either resuming its move or reversing trend. Best utilized in conjunction with other technical tools, PriceCounts offer one more way to analyze charts and help to manage your positions and risk. Learn more at www.qtchartoftheday.com

Trading in futures, options, securities, derivatives or OTC products entails significant risks which must be understood prior to trading and may not be appropriate for all investors. Past performance of actual trades or strategies is not necessarily indicative of future results.

Brokers Trading System of the Week

ALGOsigmaX E-mini S&P ES

Markets Traded:   Mini SP500 ES/EP

System Type: Swing Trading

Risk per Trade: varies

Trading Rules: Partially Disclosed

Suggested Capital: $50,000

Developer Fee per contract: $205 Monthly Subscription

Get Started

Learn More

e1423cd9 525a 41d8 acae 1378fefb1cfa
Disclaimer The risk of trading can be substantial, and each investor and/or trader must consider whether this is a suitable investment. Past performance is not necessarily indicative of future results.

IMPORTANT RISK DISCLOSURE

Futures trading is complex and carries the risk of substantial losses. It is not suitable for all investors. The ability to withstand losses and to adhere to a particular trading program in spite of trading losses are material points which can adversely affect investor returns.

The returns for trading systems listed throughout this website are hypothetical in that they represent returns in a model account. The model account rises or falls by the average single contract profit and loss achieved by clients trading actual money pursuant to the listed system’s trading signals on the appropriate dates (client fills), or if no actual client profit or loss available – by the hypothetical single contract profit and loss of trades generated by the system’s trading signals on that day in real time (real-time) less slippage, or if no real time profit or loss available – by the hypothetical single contract profit and loss of trades generated by running the system logic backwards on backadjusted data (backadjusted).

Please read carefully the CFTC required disclaimer regarding hypothetical results below.

HYPOTHETICAL PERFORMANCE RESULTS HAVE MANY INHERENT LIMITATIONS, SOME OF WHICH ARE DESCRIBED BELOW. NO REPRESENTATION IS BEING MADE THAT ANY ACCOUNT WILL OR IS LIKELY TO ACHIEVE PROFITS OR LOSSES SIMILAR TO THOSE SHOWN; IN FACT, THERE ARE FREQUENTLY SHARP DIFFERENCES BETWEEN HYPOTHETICAL PERFORMANCE RESULTS AND THE ACTUAL RESULTS SUBSEQUENTLY ACHIEVED BY ANY PARTICULAR TRADING PROGRAM.

ONE OF THE LIMITATIONS OF HYPOTHETICAL PERFORMANCE RESULTS IS THAT THEY ARE GENERALLY PREPARED WITH THE BENEFIT OF HINDSIGHT.

IN ADDITION, HYPOTHETICAL TRADING DOES NOT INVOLVE FINANCIAL RISK, AND NO HYPOTHETICAL TRADING RECORD CAN COMPLETELY ACCOUNT FOR THE IMPACT OF FINANCIAL RISK OF ACTUAL TRADING. FOR EXAMPLE, THE ABILITY TO WITHSTAND LOSSES OR TO ADHERE TO A PARTICULAR TRADING PROGRAM IN SPITE OF TRADING LOSSES ARE MATERIAL POINTS WHICH CAN ALSO ADVERSELY AFFECT ACTUAL TRADING RESULTS.

THERE ARE NUMEROUS OTHER FACTORS RELATED TO THE MARKETS IN GENERAL OR TO THE IMPLEMENTATION OF ANY SPECIFIC TRADING PROGRAM WHICH CANNOT BE FULLY ACCOUNTED FOR IN THE PREPARATION OF HYPOTHETICAL PERFORMANCE RESULTS AND ALL WHICH CAN ADVERSELY AFFECT ACTUAL TRADING RESULTS.

Please read full disclaimer HERE.

Would you like to get weekly updates on real-time, results of systems mentioned above?

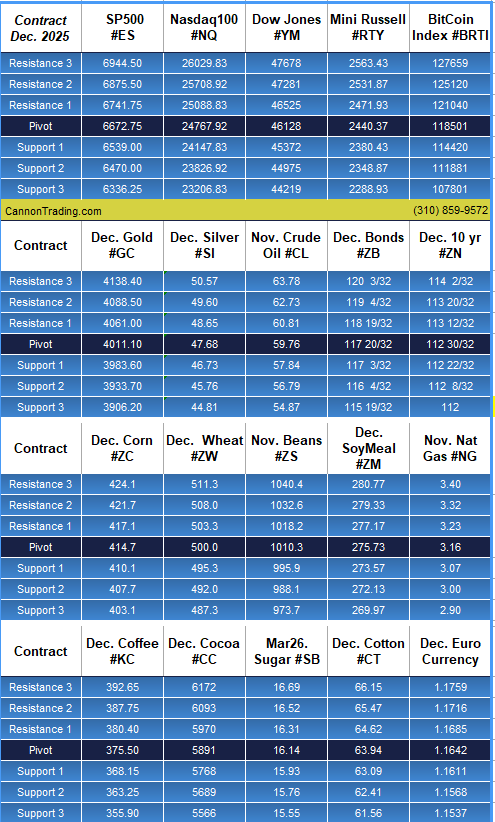
Daily Levels for Oct 13th, 2025

6ac8232f 6227 444d 909d cb5479bbc219

Would you like to receive daily support & resistance levels?

Trading Reports for Next Week

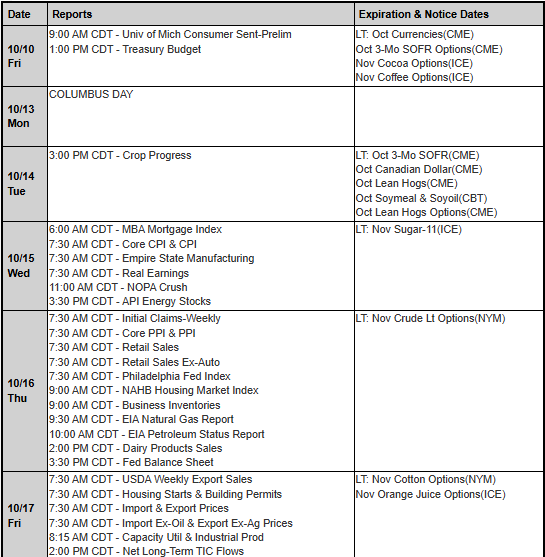
First Notice (FN), Last trading (LT) Days for the Week:

www.mrci.com

ac46bf10 f98c 4ba4 bc8e c917649e29c1

Find us on Trustpilot

stars

Trading Futures, Options on Futures, and retail off-exchange foreign currency transactions involves substantial risk of loss and is not suitable for all investors. You should carefully consider whether trading is suitable for you in light of your circumstances, knowledge, and financial resources. You may lose all or more of your initial investment. Opinions, market data, and recommendations are subject to change at any time.

Join our Private Facebook group

Subscribe to our YouTube Channel

Listen to our podcast: Subscribe on AppleSpotify, Amazon

or wherever you listen to podcasts!

S
Facebook  Instagram  LinkedIn
S
ef3ab1c9 8d6d 4e60 a3f1 af5d9d4ecbb3
Services
Software
Tools
Community
Contact

GDP: What It Is and What to Look for in the Upcoming Report; December Corn, Levels, Reports – The Important Facts to Keep in Mind When Trading Futures on September 25th, 2025

9dc1e02e d5f7 4ff4 abf7 1df60775f196

GDP Explained

By Mark O’Brien, Senior Broker

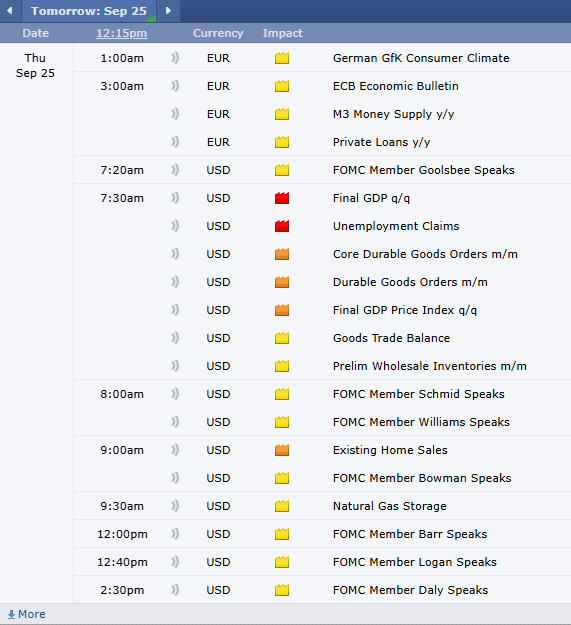
  • Upcoming GDP Report: The Commerce Department’s Bureau of Economic Analysis will release the final report on U.S. GDP for Q2 (April–June) at 7:30 A.M. Central Time.

  • Previous Estimates: The first estimate showed 3.0% growth; the revised figure was 3.3%. Tomorrow’s release will be the final revision.

  • Quarterly Comparison: In Q1, real GDP decreased by 0.5%, making Q2’s growth a significant rebound.

  • GDP Definition & Components: GDP measures total economic output, calculated from four main components: consumer spending, business investment, government spending, and net exports.

  • Uses of GDP: Serves as an economic barometer for policy decisions, guides business and investment strategies, and enables international economic comparisons.

gdp

Keep an eye out for the last look at U.S. GDP (Gross Domestic Product) for the second quarter of this year: April – June. At 7:30 A.M., Central Time the Commerce Department’s U.S. Bureau of Economic Analysis will release its final report. The first, advanced look at the second quarter showed real GDP increased at an annual rate of 3.0 percent.

The bureau then released a revised, coincident figure of 3.3%. Tomorrow’s report will be the final revision, based on data gathered lately. In the first quarter, real GDP decreased 0.5 percent.

GDP

is a comprehensive measure of a nation’s economic output, indicating the total value of goods and services produced. It’s calculated by adding up the value of four main components:

Consumer Spending (Personal Consumption): Purchases of goods and services by households.

Business Investment: Spending by businesses on capital goods, like machinery and buildings.

Government Spending: Purchases of goods and services by the government at all levels.

Net Exports: The total value of exports minus the value of imports.

How GDP is Used

Economic Barometer: Governments and policymakers use GDP data to track the economy’s performance and inform decisions on fiscal and monetary policies.

Business and Investment Decisions: Investors and businesses closely monitor GDP growth to identify opportunities for investment and growth.

International Comparisons: GDP allows for the comparison of the relative size and strength of different economies worldwide.

S

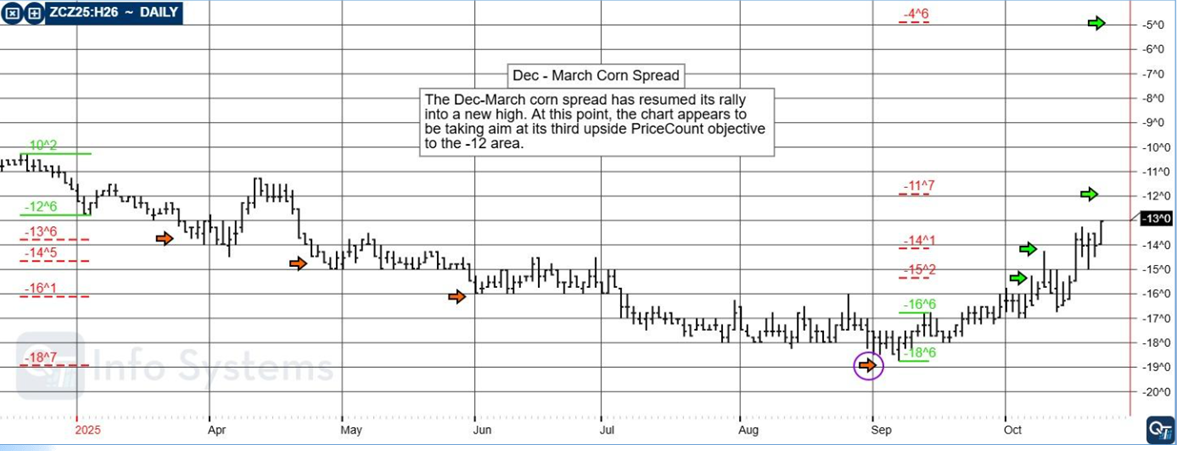
December 25/26 Corn Spread

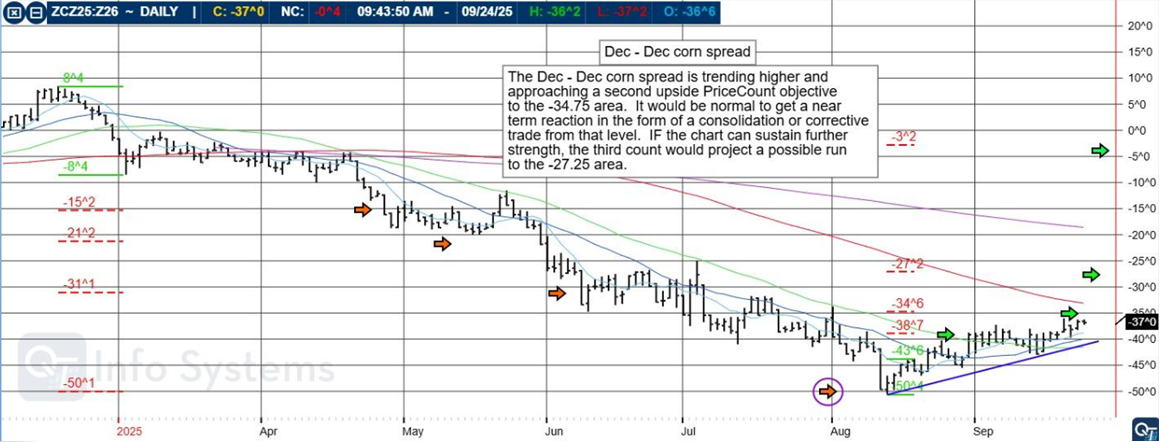
The Dec – Dec corn spread is trending higher and approaching a second upside PriceCount objective to the -34.75 area. It would be normal to get a near term reaction in the form of a consolidation or corrective trade from that level. IF the chart can sustain further strength, the third count would project a possible run to the -27.25 area.

7c06d7ab 0f6c 4b07 9e0a 4bb4866c520b
The PriceCount study is a tool that can help to project the distance of a move in price. The counts are not intended to be an ‘exact’ science but rather offer a target area for the four objectives which are based off the first leg of a move with each subsequent count having a smaller percentage of being achieved.

It is normal for the chart to react by correcting or consolidating at an objective and then either resuming its move or reversing trend. Best utilized in conjunction with other technical tools, PriceCounts offer one more way to analyze charts and help to manage your positions and risk. Learn more at www.qtchartoftheday.com

Trading in futures, options, securities, derivatives or OTC products entails significant risks which must be understood prior to trading and may not be appropriate for all investors.

Past performance of actual trades or strategies is not necessarily indicative of future results.

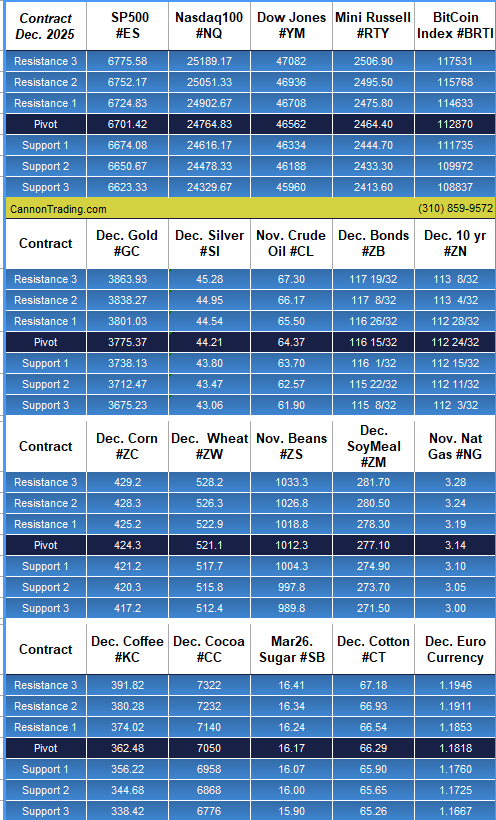
Daily Levels for Sept. 25th, 2025

6d974503 683d 45dd ac6e 0a07466a1a22

Want to feature our updated trading levels on your website? Simply paste a small code, and they’ll update automatically every day! 

Click here for quick and easy instructions.

Economic Reports

provided by: ForexFactory.com

All times are Eastern Time ( New York)

b86307f9 fe49 41b8 a305 a339440cad25

Find us on Trustpilot

stars

Trading Futures, Options on Futures, and retail off-exchange foreign currency transactions involves substantial risk of loss and is not suitable for all investors. You should carefully consider whether trading is suitable for you in light of your circumstances, knowledge, and financial resources. You may lose all or more of your initial investment. Opinions, market data, and recommendations are subject to change at any time.

Join our Private Facebook group

Subscribe to our YouTube Channel

Listen to our podcast: Subscribe on AppleSpotify, Amazon

or wherever you listen to podcasts!

S
Facebook  Instagram  LinkedIn
S
ef3ab1c9 8d6d 4e60 a3f1 af5d9d4ecbb3
Services
Software
Tools
Community
Contact

FED Speakers, PCE, Bitcoin and Ether Futures, Levels, Reports; What you Need to Know for Trading Futures the Week of September 22nd, 2025

7cfe5b36 db9f 4933 824a 7f264613e7fe

Cannon Futures Weekly Letter

In Today’s Issue #1259

  • The Week Ahead – Fed Speakers, PCE

  • Futures 101 – Trading Bitcoin and Ether Futures

  • Hot Market of the Week – Dec. Mini SP500

  • Broker’s Trading System of the Week – Natural Gas Swing Trading System

  • Trading Levels for Next Week
  • Trading Reports for Next Week

Important Notices: The Week Ahead

By John Thorpe, Senior Broker

Fed Speakers & PCE to Dominate the Week Ahead
fed speakers

Fed Chair Powell to speak in Warwick, RI Wednesday, Heavy week of Fed speakers as well.

The Spice you should be ordering now that Fall is right around the corner should be anything but the pumpkin variety!

The spice building into these markets is what traders look for, Volume is back and so is volatility on many fronts.

With the FOMC meeting behind us, listen for more nuanced language, outside of the 3 cuts prior to years end, Chair Powell shared during after his rate cut speech Wednesday. You will be hearing from a slew of Fed Speakers posting up this week (schedule is below). This unit by themselves, will, no doubt be responsible for bringing additional spice to the marketplace

Those trading markets other than the indices understand rates effect nearly all the markets we trade. To name a few: precious metals (inflation), Bonds (long term rates following short term to varying degrees), the energy complex (cheaper capital higher demand), Equities (cheaper capital), Currencies (capital flows out of US dollar denominated assets to higher interest rate debentures) Grains, Lumber, etc.

           As for earnings reports we are truly at the end of Q2 Reporting. We have but a few laggards reporting this week

The on again off again nature of Tariff news has created golden opportunities for breakouts in some markets, rangebound trades in others. The market is just bored with the talk about Russia/Ukraine war cessation, until there is major movement, looks like it’s all up to Putin to move the needle.

Continued volatility to come as next week all markets will be reacting to whatever comes out of U.S. Govt leadership relating to conflicts cessation and trade deals, especially with China great talks with XI and Trump tda, India, Canada and Russia. Also, remember that Mexico’s extension will end October 29.

We’ll see you next week! Please enjoy a safe and memorable weekend.

 Earnings Next Week: 

  • Mon. Quiet
  • Tue. Micron
  • Wed.  Quiet
  • Thu. Costco, Accenture
  • Fri.   Quiet

FED SPEECHES: (all times CDT) 

  • Mon.  Williams 8:45am, Musalem 9:00am, Barkin, Hammack and Miran, (new kid on the block) 11:00am
  • Tues.  Bowman 8:00am, Bostic 9:00am, Fed Chair Powell from Warwick, RI 11:35 am
  • Wed. Daly 3:10 pm
  • Thu.     Goolsbee 7:20 am, Williams 8:00am, Bowman 9:00am, Barr 12:00 pm, Daly 2:30 pm
  • Fri.      Hammack 7:00am, Barkin 8:00 am, Bowman 12:00pm, Musalem 12:30 pm, Bostic 5:00pm

Economic Data week: 

  • Mon.  Quiet
  • Tue.   Redbook, &P PMI, Richmond Fed
  • Wed.  Bldg Permits final, EIA Crude Stocks, 17-week Bill auction
  • Thur.  Initial Jobless claims, Core PCE, GDP Final, Existing home sales, EIA NAT GAS Storage, Fed Balance sheet,
  • Fri.     Core PCE index MoM, Michigan consumer sentiment, Baker Hughes
626ad4fb 6641 4499 8fee 1a2df95486b7

Micro Ether been averaging over 140,000 contracts per day last few weeks!

Micro Bitcoin trades close to 100,000 contracts per day as well!!

If you are a Crypto trader, it is time for you to explore trading Crypto Futures on a regulated centralized exchange!

Introduction to Cryptocurrency futures

Course overview

Cryptocurrency futures, available at CME Group, provide market participants with multiple products for cryptocurrency risk management or market expression. Expand your understanding of the cryptocurrency markets, products, and underlying reference rates. This course covers:

  • Bitcoin
  • Ether
  • Micro Bitcoin
  • Micro Ether
  • Options on Bitcoin futures
  • BTIC on Cryptocurrency futures

START FREE COURSE NOW

e47bab83 4e08 4948 b8ed 4ae51104377d

Hot Market of the Week

Hot market of the week is provided by QT Market Center, A Swiss army knife charting package that’s not just for Hedgers, Cooperatives and Farmers alike but also for Spread traders, Swing traders and shorter time frame application for intraday traders with a unique proprietary indicator that can be applied to your specific trading needs.

Free Trial Available

Dec. Mini SP 500

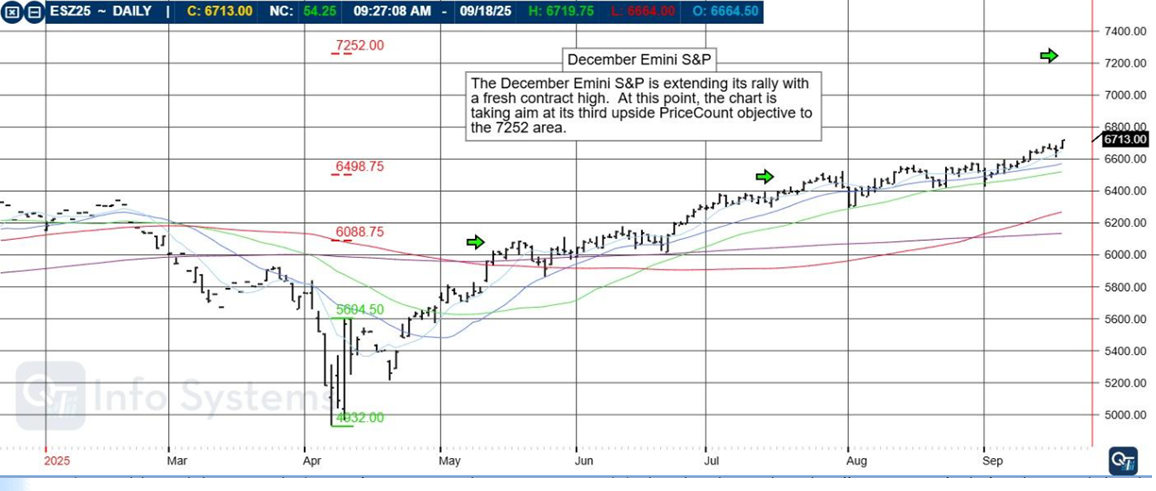
The December Emini S&P is extending its rally with a fresh contract high. At this point, the chart is taking aim at its third upside PriceCount objective to the 7252 area.

8e3a0bf7 c484 4a25 889d fd00cecf3c78

The PriceCount study is a tool that can help to project the distance of a move in price. The counts are not intended to be an ‘exact’ science but rather offer a target area for the four objectives which are based off the first leg of a move with each subsequent count having a smaller percentage of being achieved.

It is normal for the chart to react by correcting or consolidating at an objective and then either resuming its move or reversing trend. Best utilized in conjunction with other technical tools, PriceCounts offer one more way to analyze charts and help to manage your positions and risk. Learn more at www.qtchartoftheday.com

Trading in futures, options, securities, derivatives or OTC products entails significant risks which must be understood prior to trading and may not be appropriate for all investors.

Past performance of actual trades or strategies is not necessarily indicative of future results.

Brokers Trading System of the Week

NAT GAS

Markets Traded:   Natural Gas NG

System Type: Swing Trading

Risk per Trade: varies

Trading Rules: Partially Disclosed

Suggested Capital: $25,000

Developer Fee per contract: $60 Monthly Subscription

Get Started

Learn More

a698b308 5de4 4482 88c4 4e1133f57616
Disclaimer The risk of trading can be substantial and each investor and/or trader must consider whether this is a suitable investment. Past performance is not necessarily indicative of future results.

IMPORTANT RISK DISCLOSURE

Futures trading is complex and carries the risk of substantial losses. It is not suitable for all investors. The ability to withstand losses and to adhere to a particular trading program in spite of trading losses are material points which can adversely affect investor returns.

The returns for trading systems listed throughout this website are hypothetical in that they represent returns in a model account. The model account rises or falls by the average single contract profit and loss achieved by clients trading actual money pursuant to the listed system’s trading signals on the appropriate dates (client fills), or if no actual client profit or loss available – by the hypothetical single contract profit and loss of trades generated by the system’s trading signals on that day in real time (real-time) less slippage, or if no real time profit or loss available – by the hypothetical single contract profit and loss of trades generated by running the system logic backwards on backadjusted data (backadjusted).

Please read carefully the CFTC required disclaimer regarding hypothetical results below. HYPOTHETICAL PERFORMANCE RESULTS HAVE MANY INHERENT LIMITATIONS, SOME OF WHICH ARE DESCRIBED BELOW.

NO REPRESENTATION IS BEING MADE THAT ANY ACCOUNT WILL OR IS LIKELY TO ACHIEVE PROFITS OR LOSSES SIMILAR TO THOSE SHOWN; IN FACT, THERE ARE FREQUENTLY SHARP DIFFERENCES BETWEEN HYPOTHETICAL PERFORMANCE RESULTS AND THE ACTUAL RESULTS SUBSEQUENTLY ACHIEVED BY ANY PARTICULAR TRADING PROGRAM. ONE OF THE LIMITATIONS OF HYPOTHETICAL PERFORMANCE RESULTS IS THAT THEY ARE GENERALLY PREPARED WITH THE BENEFIT OF HINDSIGHT.

IN ADDITION, HYPOTHETICAL TRADING DOES NOT INVOLVE FINANCIAL RISK, AND NO HYPOTHETICAL TRADING RECORD CAN COMPLETELY ACCOUNT FOR THE IMPACT OF FINANCIAL RISK OF ACTUAL TRADING. FOR EXAMPLE, THE ABILITY TO WITHSTAND LOSSES OR TO ADHERE TO A PARTICULAR TRADING PROGRAM IN SPITE OF TRADING LOSSES ARE MATERIAL POINTS WHICH CAN ALSO ADVERSELY AFFECT ACTUAL TRADING RESULTS.

THERE ARE NUMEROUS OTHER FACTORS RELATED TO THE MARKETS IN GENERAL OR TO THE IMPLEMENTATION OF ANY SPECIFIC TRADING PROGRAM WHICH CANNOT BE FULLY ACCOUNTED FOR IN THE PREPARATION OF HYPOTHETICAL PERFORMANCE RESULTS AND ALL WHICH CAN ADVERSELY AFFECT ACTUAL TRADING RESULTS.

Please read full disclaimer HERE.

Would you like to get weekly updates on real-time, results of systems mentioned above?

Daily Levels for Sept 22nd, 2025

8b5f9516 2d48 4a8f 97ac 06e9afd17e2c
Would you like to receive daily support & resistance levels?

Trading Reports for Next Week

First Notice (FN), Last trading (LT) Days for the Week:

www.mrci.com

1cd8913d 6bce 46c6 8638 c904841fa4fc

Find us on Trustpilot

stars

Trading Futures, Options on Futures, and retail off-exchange foreign currency transactions involves substantial risk of loss and is not suitable for all investors. You should carefully consider whether trading is suitable for you in light of your circumstances, knowledge, and financial resources. You may lose all or more of your initial investment. Opinions, market data, and recommendations are subject to change at any time.

Join our Private Facebook group

Subscribe to our YouTube Channel

Listen to our podcast: Subscribe on AppleSpotify, Amazon

or wherever you listen to podcasts!

S
Facebook  Instagram  LinkedIn
S
ef3ab1c9 8d6d 4e60 a3f1 af5d9d4ecbb3
Services
Software
Tools
Community
Contact

Webinar Wednesday – Decoding the Markets, November Lumber, Levels, Reports: Your 4 Important Must-Knows for Trading Futures on September 9th, 2025

9dc1e02e d5f7 4ff4 abf7 1df60775f196
market

Webinar this Wednesday!!

Episode 1: Decoding the Markets: A Dual-Analysis Approach to Futures Trading

Date & Time

Sep 10, 2025 09:00 AM in Pacific Time (US and Canada)

Description

Join CME Group host Ryan Gorman for a comprehensive webinar that explores how to navigate the futures markets. This session will provide an in-depth look at how macroeconomic factors, supply and demand, and geopolitical events drive market fundamentals. We’ll then connect this knowledge with practical technical analysis techniques, including chart patterns, indicators, and more, to identify trends and potential trading opportunities.

 Register Now!

S
c063cc4f c499 48f5 a7d3 8b226e13a1c0
5e739032 804e 4c95 afcf a6a71aa90ea8

November Lumber

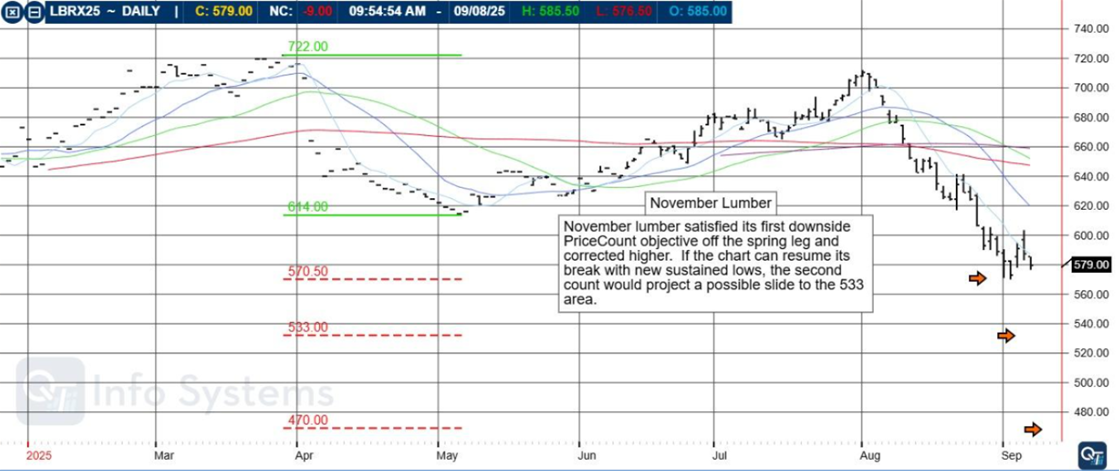
November lumber satisfied its first downside PriceCount objective off the spring leg and corrected higher. If the chart can resume its break with new sustained lows, the second count would project a possible slide to the $533 area.

c6508e69 bccf 46e5 8e62 a3f27d58cb99

The PriceCount study is a tool that can help to project the distance of a move in price. The counts are not intended to be an ‘exact’ science but rather offer a target area for the four objectives which are based off the first leg of a move with each subsequent count having a smaller percentage of being achieved.

It is normal for the chart to react by correcting or consolidating at an objective and then either resuming its move or reversing trend. Best utilized in conjunction with other technical tools, PriceCounts offer one more way to analyze charts and help to manage your positions and risk. Learn more at www.qtchartoftheday.com

Trading in futures, options, securities, derivatives or OTC products entails significant risks which must be understood prior to trading and may not be appropriate for all investors. Past performance of actual trades or strategies is not necessarily indicative of future results.

Daily Levels for Sept. 9th, 2025

22d68072 43ee 42c0 82b8 075c15bbf2e8

Want to feature our updated trading levels on your website? Simply paste a small code, and they’ll update automatically every day! 

Click here for quick and easy instructions.

Economic Reports

provided by: ForexFactory.com

All times are Eastern Time ( New York)

fcea9d19 bcc6 4e0e 9da2 25e285d4208c

Find us on Trustpilot

stars

Trading Futures, Options on Futures, and retail off-exchange foreign currency transactions involves substantial risk of loss and is not suitable for all investors. You should carefully consider whether trading is suitable for you in light of your circumstances, knowledge, and financial resources. You may lose all or more of your initial investment. Opinions, market data, and recommendations are subject to change at any time.

Join our Private Facebook group

Subscribe to our YouTube Channel

Listen to our podcast: Subscribe on AppleSpotify, Amazon

or wherever you listen to podcasts!

S
Facebook  Instagram  LinkedIn
S
ef3ab1c9 8d6d 4e60 a3f1 af5d9d4ecbb3
Services
Software
Tools
Community
Contact

Labor Department Reports, Non Farm Payroll, ADP, Levels, Reports; Your 5 Important Must-Knows for Trading Futures on September 4th, 2025

9dc1e02e d5f7 4ff4 abf7 1df60775f196

Bullet Points, Highlights, Announcements

by Senior Broker, Mark O’Brien

labor

Labor

General:

It’s that time of the month again: we’re a couple of days away from the Labor Dept.’s release of its monthly Non Farm Payrolls report – widely considered to be one of the most important and influential measures of the U.S. economy. The report is released at 7:30 A.M., Central Time on the first Friday of the month and measures the number of workers in the U.S. economy, excluding agricultural workers, and self-employed individuals.

More the usual, this month’s report looks to be a critical moment for traders and investors evaluating the Federal Reserve’s monetary policy in the coming months.

Again more than usual, attention will be on the revisions to the July non-farm payrolls data. Initial values for this year have been consistently downwardly revised, in part due to low response rates for the survey. The possibility of significant downward revisions could reveal more persistent labor market weakness than initially anticipated.

Ahead of that, tomorrow the ADP National Employment Report – jointly developed with the Stanford Digital Economy Lab – will show the latest snapshot of the private sector’s employment situation. While the ADP report has a poor record of predicting the Labor Dept.’s numbers – primarily because of each report’s differing means of collecting data – it.

Indexes:

Get ready for the availability of a brand-new S&P 500 stock index futures contract – and corresponding options. Starting Monday, September 22, CME Group will launch S&P 500 Month-End futures and options.

Each futures and options contract is sized at 100x the S&P 500 Index (each 1-point = $100) and expires at the index close every month, providing greater efficiency and flexibility to manage S&P 500 positions.

Now scale S&P 500 exposure with fewer contracts for greater operational efficiency and simplifying your hedging.

View the CME Group’s FAQs to learn more about trading hours, specifications and more.

Metals:

December gold set its latest all-time record high closing price yesterday: $3,592.20 per ounce, after a stout ±$76 rally. Today’s new all-time intraday high near $3,640.00 per ounce – another ±$45 rally – marks a whopping ±$280 per ounce rally in 10 trading days – going back to Aug. 20, a ±$28,000 per contract move!

Likewise, December silver closed yesterday at $42.06 per ounce, setting its own new all-time record high, a ±$4.25 per ounce move over the same 2-week span, a $21,250 per contract move.

S
eb23d89b a6ee 494c a74a 38b5f4e886e7

Weekly Chinese Renminbi

The Weekly Chinese Renminbi activated upside PriceCount objectives this summer and now, the chart is taking aim at the first count to the .14150 area.

a3447c42 8355 40df bc40 b251cbb8e631

The PriceCount study is a tool that can help to project the distance of a move in price. The counts are not intended to be an ‘exact’ science but rather offer a target area for the four objectives which are based off the first leg of a move with each subsequent count having a smaller percentage of being achieved.

It is normal for the chart to react by correcting or consolidating at an objective and then either resuming its move or reversing trend. Best utilized in conjunction with other technical tools, PriceCounts offer one more way to analyze charts and help to manage your positions and risk. Learn more at www.qtchartoftheday.com

Trading in futures, options, securities, derivatives or OTC products entails significant risks which must be understood prior to trading and may not be appropriate for all investors. Past performance of actual trades or strategies is not necessarily indicative of future results.

Daily Levels for Sept. 4th, 2025

bc2ca594 26a8 462b 9d57 95238e8177de

Want to feature our updated trading levels on your website? Simply paste a small code, and they’ll update automatically every day! 

Click here for quick and easy instructions.

Economic Reports

provided by: ForexFactory.com

All times are Eastern Time ( New York)

57d56a69 6211 4e0f 8ab6 59d99d1f72da

Find us on Trustpilot

stars

Trading Futures, Options on Futures, and retail off-exchange foreign currency transactions involves substantial risk of loss and is not suitable for all investors. You should carefully consider whether trading is suitable for you in light of your circumstances, knowledge, and financial resources. You may lose all or more of your initial investment. Opinions, market data, and recommendations are subject to change at any time.

Join our Private Facebook group

Subscribe to our YouTube Channel

Listen to our podcast: Subscribe on AppleSpotify, Amazon

or wherever you listen to podcasts!

S
Facebook  Instagram  LinkedIn
S
ef3ab1c9 8d6d 4e60 a3f1 af5d9d4ecbb3
Services
Software
Tools
Community
Contact

Labor Day Weekend 2025, Non Farm Payroll, December 10 Year Notes, Levels, Reports; Your 4 Important Must-Knows for Trading Futures the Week of September 1st, 2025

7cfe5b36 db9f 4933 824a 7f264613e7fe

Cannon Futures Weekly Letter

In Today’s Issue #1256

  • The Week Ahead – Labor Day Schedule, NFP

  • Futures 101 – Using Fundamental Analysis

  • Hot Market of the Week – December 10 year notes

  • Trading Levels for Next Week

  • Trading Reports for Next Week

Important Notices: The Week Ahead

Labor Day, Non Farm Payrolls

By John Thorpe, Senior Broker

Labor Day

Abbreviated Futures Market hours on Labor Day (Labor Day Schedule), Non Farm Payroll Friday, EIA Statistics for Crude and Natural Gas will be released Thursday due to the Holiday.

A heavy dose of economic data points will be released next week providing plenty of food for thought to chew on for the fed voting members as they continue to assess whether a freeze on Fed Funds or a reduction of .25 to .50 is the best medicine for the economy when they announce a rate decision September 20th.

CME FedWatch tool has the probability of a Fed Fund rate reduction on Sep 20th at 89.2 %, 10.8% chance of no reduction. This is a 30+ percentage point improvement from 1 month ago. The purpose of markets is to take in all information and adjust price according to that information.

Markets have already priced in this probability so it’s important to watch these numbers to see how the markets react today to these probabilities changing,  I am talking about Precious metals (inflation), Bonds (long term rates following short term to varying degrees), the energy complex (cheaper capital higher demand), Equities (cheaper capital), Currencies (capital flows out of US dollar denominated assets to higher interest rate debentures)

The on again off again nature of Tariff and Russia/Ukraine war talks has created golden opportunities for breakouts in some markets, rangebound trades in others. (see gold commentary below)  Crude Oil is knocking on the ceiling of it’s range near $65.00 bbl.

Remember to zoom out when reading your intraday time frame charts to daily and weekly time frames. December Gold is still rangebound! High end of the range this week trading above $3500.00 for the first time since august 8th. Last week I wrote this:  This week, the psychological low was challenged in the 3350.00 area basis December and bounced, as of this writing, current price is 3420.00. Three weeks ago, I wrote this: Watch for the gold market to maintain its rangebound stance, close below 3350 (basis December) or above 3500 should denote a breakout, begin trading the December(Z) contract next week.

Two weeks ago, I wrote:  Dec gold traded below 3350 today and the past three days but never closed meaningfully below 3350.0 (3348.60 Thurs.) Today we have breached $3500.00 oz with a high in the $3543.00 area per oz. while currently trading @$3493.00 oz as of this writing. Look for a close above $3500.00 on successive days to again accumulate longs.

This may be the break from this range we are looking for. Manage your downside risk according to your account size, risk no more than 15-20% whether with options or futures.   Today, August 15th as of this writing that 3500.00 oz did not hold, always wait for confirmation prior to taking a position, several consecutive closes above or below a range is a start. We are teasing the bottom of the range today Dec gold in the 3380’s, I see psychological support @ 3350.00 

Continued volatility to come as next week all markets will be reacting to whatever comes out of U.S. Govt leadership relating to conflicts cessation and trade deals, especially with China, India, Canada and Russia. Also, remember that Mexico’s extension will end October 29.

We’ll see you next week! Please enjoy a safe and memorable weekend.

Earnings Next Week:

  • Mon. Labor Day

  • Tue.  Zscaler, Macy’s
  • Wed.  SalesForce, Hewlett-Packard, DollarTree
  • Thu. Broadcom, LuLuLemon
  • Fri.   Baba

FED SPEECHES: (all times CDT)

  • Mon.  (holiday trade)
  • Tues.  Quiet
  • Wed.  8:00 am, Musalem. 12:30 pm Kashkari (non vtg mbr)
  • Thu.    11:05 am Williams, 6:00 PM Goolsbee
  • Fri.       Quiet

Economic Data week:

  • Mon.  Quiet (holiday trade)
  • Tue.    Redbook, Global PMI, ISM PMI , RCM/TIPP Optimism Index
  • Wed.  JOLTS, Beige Book, (EIA Crude Stocks moved due to L-Day Weekend), 17-week Bill auction
  • Thur. ADP, Balance of trade, Initial Jobless claims, ISM PMI, 7:30 am EIA NAT GAS Storage,  11:00     am EIA Crude Stocks, Fed Balance sheet,
  • Fri.   Non Farm Payroll

222d49b3 b321 490d 8d2d 6c72b6180386

Using Fundamental Analysis When Evaluating Trades

Course Overview

Fundamental analysis is the process of determining the model price of a futures contract, now and in the future, using factors like economic data and industry financial conditions. A trader using fundamental analysis to inform their decisions is looking at how supply and demand could move price, now and in the future. The type of information a trader will use to formulate their opinions will differ across products, in this course we’ll look at each class of products and cover some of the variables that could impact price.

START THE FREE COURSE

Hot Market of the Week

Hot market of the week is provided by QT Market Center, A Swiss army knife charting package that’s not just for Hedgers, Cooperatives and Farmers alike but also for Spread traders, Swing traders and shorter time frame application for intraday traders with a unique proprietary indicator that can be applied to your specific trading needs.

Free Trial Available

December 10-Year Treasury Note

The December 10-Year treasury note has resumed its rally into a new high. If the trend can sustain further strength, the second upside PriceCount objective projects a potential run to the 113’21 area.

d0497312 64ca 4532 a2ee fe9e61a853bd

The PriceCount study is a tool that can help to project the distance of a move in price. The counts are not intended to be an ‘exact’ science but rather offer a target area for the four objectives which are based off the first leg of a move with each subsequent count having a smaller percentage of being achieved.

It is normal for the chart to react by correcting or consolidating at an objective and then either resuming its move or reversing trend. Best utilized in conjunction with other technical tools, PriceCounts offer one more way to analyze charts and help to manage your positions and risk. Learn more at www.qtchartoftheday.com

Trading in futures, options, securities, derivatives or OTC products entails significant risks which must be understood prior to trading and may not be appropriate for all investors. Past performance of actual trades or strategies is not necessarily indicative of future results.

Would you like to get weekly updates on real-time, results of Automated Systems?

Daily Levels for Sept. 2nd, 2025

880ba687 24c1 4a70 8015 073ea7dfae07

Would you like to receive daily support & resistance levels?

Trading Reports for Next Week

First Notice (FN), Last trading (LT) Days for the Week:

www.mrci.com

034c0ea9 2e6a 47ea a547 5f94d4d3e729

Find us on Trustpilot

stars

Trading Futures, Options on Futures, and retail off-exchange foreign currency transactions involves substantial risk of loss and is not suitable for all investors. You should carefully consider whether trading is suitable for you in light of your circumstances, knowledge, and financial resources. You may lose all or more of your initial investment. Opinions, market data, and recommendations are subject to change at any time.

Join our Private Facebook group

Subscribe to our YouTube Channel

Listen to our podcast: Subscribe on AppleSpotify, Amazon

or wherever you listen to podcasts!

S
Facebook  Instagram  LinkedIn
S
ef3ab1c9 8d6d 4e60 a3f1 af5d9d4ecbb3
Services
Software
Tools
Community
Contact

NVDIA, December Corn, Levels, Reports – even Kelce/Swift! Your 5 Important News for Trading Futures on August 27th, 2025

9dc1e02e d5f7 4ff4 abf7 1df60775f196

Dog Days of August and

Travis Kelce/ Taylor Swift are getting hitched!

By John Thorpe, Senior Broker

Markets Ease After Friday’s Surge

S

nvdia

What does the Redbook, Case Shiller Home Price Index, CB Consumer Confidence, Richmond Fed Svc and Mfg. Index, Dallas Fed Svc. index and the announcement of the Swift / Kelce nuptials have in common?

I am sure you are glad I asked, “They have everything in common with each other.” The markets failed to move on any of the breaking economic releases and celebrity gossip columns today.

For the Equity index markets, this is typical behavior at the end of the dog days of summer.

Low Volume, low energy. It seems like last Friday’s rally was months ago. And then? There is NVDIA.

Earnings will be released tomorrow after the NYSE close for NVDIA. The star AI Chipmaker EPS estimate is 1.01 usd with Revenues @ 45.94B usd. This 4.34 trillion market cap. company’s Q2 release and future guidance will move the Equity indexes after Wednesday’s NYSE cash market close and perhaps deep into Thursday’s trading session.

Below are the last few high-profile quarters and how NQ futures reacted in the hours after

results hit:

  • Feb 2024: NVDIA crushed expectations; Nasdaq futures jumped nearly ~2% overnight.
  • May 2024: NVDIA beat and guided strong; Nasdaq/S&P 500 hit intraday records the next session (futures were bid after the print).
  • Aug 2024: NVDIA beat, but guidance/GM underwhelmed lofty expectations; Nasdaq 100 E-mini futures were flat to slightly down (around –0.1% to –0.7%) that night/morning.
  • Feb 2025: Heading into results, NVDIA was the market focus; stock-index futures led gains as the print eased some AI demand fears (positive lean for Nasdaq futures).

Pattern: when NVDA positively surprises NQ futures usually pop; when results meet but don’t wow—or guidance suggests doubt—NQ futures are flat/down. This is consistent with NVDIA’s outsized weight in the Nasdaq-100 and its role as the AI bellwether. The NFL is 2 weeks away.

  • Earnings tomorrow NVDIA and Crowdstrike
  • Fed Speaker: Wed.  9:45 am Barkin.
  • Wed.  EIA Crude Stocks, 17-week Bill auction
  • Trump Tarriff News, anything goes

Real Time Text Alerts Directly to your Phone!

·    You will receive a text and email each time there is an entry or exit in a simple language along with the current price for that specific market.

·    A licensed series 3 broker at your fingertips

·    Text alerts available to US and Canada residents. Int’l clients will receive the alerts via email. No obligation

·    Alerts available for: Stock Indices, Grains, Metals, Rates, Currencies and Meats

·    Open an account* and receive the Trade Alerts free for 3 months ($357 value)

Start Your FREE Trial NOW

December Corn

December corn activated upside PriceCount objectives off the recent low. The first count projects a possible run to the $4.20 area.

ba43c81e a6c3 4677 a4de 2968cb4edeb4

Daily Levels for Aug 27th, 2025

1765d31b a0be 4f80 837d 9c1f7569e4ea

Want to feature our updated trading levels on your website? Simply paste a small code, and they’ll update automatically every day!

Click here for quick and easy instructions.

Economic Reports

provided by: ForexFactory.com

All times are Eastern Time ( New York)

9a7ab4b3 25f1 4021 ba39 82fd74752a6e

Find us on Trustpilot

stars

Trading Futures, Options on Futures, and retail off-exchange foreign currency transactions involves substantial risk of loss and is not suitable for all investors. You should carefully consider whether trading is suitable for you in light of your circumstances, knowledge, and financial resources. You may lose all or more of your initial investment. Opinions, market data, and recommendations are subject to change at any time.

Join our Private Facebook group

Subscribe to our YouTube Channel

Listen to our podcast: Subscribe on AppleSpotify, Amazon

or wherever you listen to podcasts!

S
Facebook  Instagram  LinkedIn
S
ef3ab1c9 8d6d 4e60 a3f1 af5d9d4ecbb3
Services
Software
Tools
Community
Contact

Labor Day 2025; Your Important Trading Calendar for the 3-Day Weekend

9dc1e02e d5f7 4ff4 abf7 1df60775f196

Labor Day 2025 FULL SCHEDULE

labor day 2025

labor day 2025

Find us on Trustpilot

stars

Trading Futures, Options on Futures, and retail off-exchange foreign currency transactions involves substantial risk of loss and is not suitable for all investors. You should carefully consider whether trading is suitable for you in light of your circumstances, knowledge, and financial resources. You may lose all or more of your initial investment. Opinions, market data, and recommendations are subject to change at any time.

Join our Private Facebook group

Subscribe to our YouTube Channel

Listen to our podcast: Subscribe on AppleSpotify, Amazon

or wherever you listen to podcasts!

S
Facebook  Instagram  LinkedIn
S
ef3ab1c9 8d6d 4e60 a3f1 af5d9d4ecbb3
Services
Software
Tools
Community
Contact
Cannon Trading Co., Inc.

12100 Wilshire Blvd.

Suite 1640

Los Angeles, CA 90025 US