Keeping a Futures Trading Journal, Economic Reports & Levels 8.28.2014

Hello Traders,

For 2014 I would like to wish all of you discipline and patience in your trading!


The EXTREMELY low volume today ( as well as last few days…) made me go look in my trading journal where sure enough I wrote down that the week before Labor Day is usually lower volume and a good time to take some days off….( too bad I did not schedule some vacation time LOL)
The point of the story is that keeping a trading journal has MANY ADVANTAGES….and I highly recommend it.

I keep notes on the following:

  • different methods I test
  • Market behavior during different economic reports
  • Things I did well, mental state of mind
  • Mistakes I have made, the reasons I did and how I can try to avoid these mistakes
  • Different indicators, chart settings, ideas I read about
  • Different codes I created for my charts
  • Much more…

Many times the journal will help me put closure on a bad day but more so it helps keep track of work I have done so I don’t have to do it again.


Try it. It is not easy, especially after bad days….it takes time, energy and consistency – just like trading. I keep mine on a word doc so I can easily access it ( plus my hand writing is terrible). Hope this tip helps and wishing you good trading!
PS: About low volatility and volume, its a cycle and times of much higher volume and volatility are proably very near…. Continue reading “Keeping a Futures Trading Journal, Economic Reports & Levels 8.28.2014”

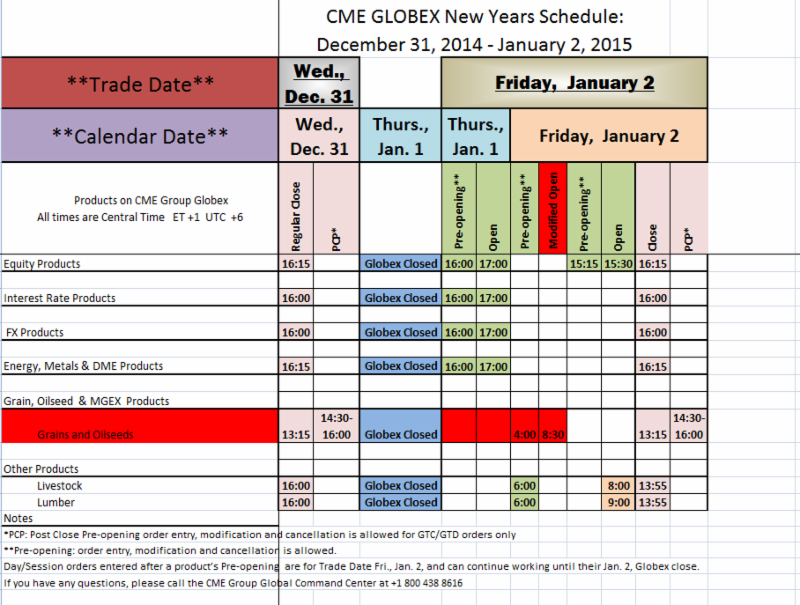
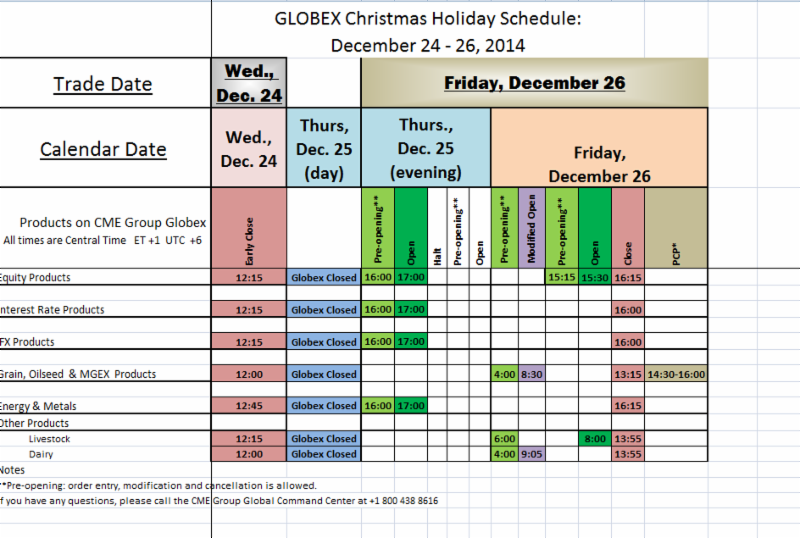
Futures Markets Labor Day Holiday Schedule 2014

Labor Day Holiday Schedule for CME / Globex and ICE Exchanges

All times listed as Central Time


827


Regular close-Per each product schedule

More details at: http://www.cmegroup.com/tools-information/holiday-calendar/files/2014-labor-day-holiday-schedule.pdf

If you have any questions, please call the CME Global Command Center at +1 800 438 8616, in Europe

at +44 800 898 013 or in Asia at +65 6532 5010


trans

More Details at: https://www.theice.com/marketdata/Calendar.shtml?calendars=Holiday&expirationEnabled=false&calendars=SpecialTradingHours

The above sources were compiled from sources believed to be reliable.  Cannon Trading assumes no responsibility for any errors or omissions.  It is meant as an alert to events that may affect trading strategies and is not necessarily complete.  The closing times for certain contracts may have been rescheduled.

Futures Algorithms, Economic Reports & Levels 8.27.2014

Hello Traders,

For 2014 I would like to wish all of you discipline and patience in your trading!


I have posted an analysis of coffee futures market ( medium term time frame) at:


http://experts.forexmagnates.com/coffee-futures-break-fake/


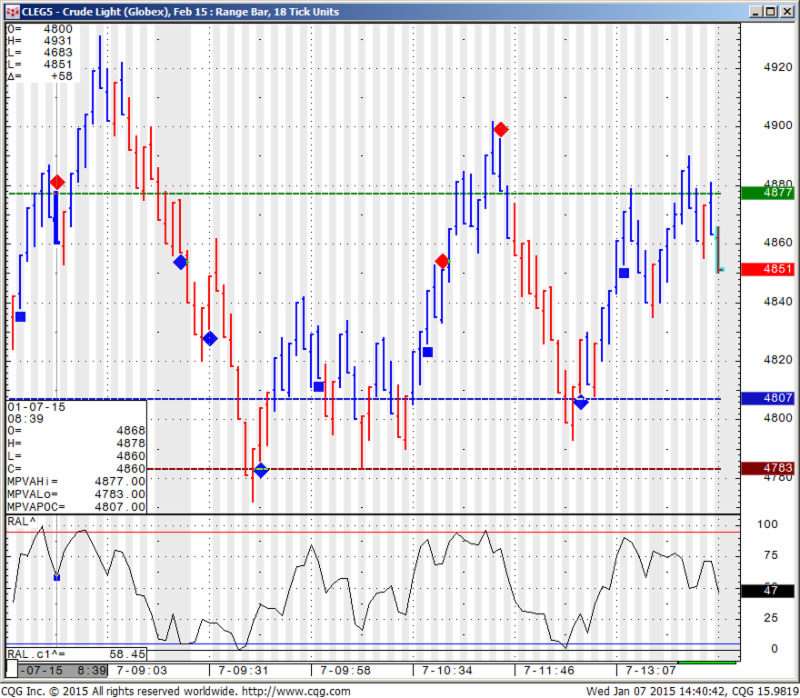
In between going back to day trading, I mentioned to clients before that I prefer volume charts, range bar charts and Renko charts for any time frame that is less than 15 minutes. Main reason in few words is that these type of charts can sometimes provide you with a faster signal when there is action in the market and may sometimes filter our “noise signals” when markets are quiet with low volume.
Below you will see my “longer term day trading chart” I use for mini Russell. It is a 36 ticks range bar chart. You will be to view the few signals I got this past few days.

Range Bar Charts:

A Range Bar chart is constructed of bars that indicate price movement as a way to help expose trends and volatility. A bar is created each time the bar range (high to low) is equal to some value that you set in preferences.

826


826


Would you like to have access to my DIAMOND and TOPAZ ALGOs as shown above

and be able to apply for any market and any time frame on your own PC ?   You can now have a three weeks free trial where I enable the ALGO along with few studies for your own sierra/ ATcharts.


To start your trial, please visit: http://levex.net/trading-algo/


HYPOTHETICAL PERFORMANCE RESULTS HAVE MANY INHERENT LIMITATIONS, SOME OF WHICH ARE DESCRIBED BELOW.  NO REPRESENTATION IS BEING MADE THAT ANY ACCOUNT WILL OR IS LIKELY TO ACHIEVE PROFITS OR LOSSES SIMILAR TO THOSE SHOWN.  IN FACT, THERE ARE FREQUENTLY SHARP DIFFERENCES BETWEEN HYPOTHETICAL PERFORMANCE RESULTS AND THE ACTUAL RESULTS SUBSEQUENTLY ACHIEVED BY ANY PARTICULAR TRADING PROGRAM.


ONE OF THE LIMITATIONS OF HYPOTHETICAL PERFORMANCE RESULTS IS THAT THEY ARE GENERALLY PREPARED WITH THE BENEFIT OF HINDSIGHT.  IN ADDITION, HYPOTHETICAL TRADING DOES NO INVOLVE FINANCIAL RISK, AND NO HYPOTHETICAL TRADING RECORD CAN COMPLETELY ACCOUNT FOR THE IMPACT OF FINANCIAL RISK IN ACTUAL TRADING.  FOR EXAMPLE, THE ABILITY TO WITHSTAND LOSSES OR TO ADHERE TO A PARTICULAR TRADING PROGRAM IN SPITE OF TRADING LOSSES ARE MATERIAL POINTS WHICH CAN ALSO ADVERSELY AFFECT ACTUAL TRADING RESULTS.  THERE ARE NUMEROUS OTHER FACTORS RELATED TO THE MARKETS IN GENERAL OR TO THE IMPLEMENTATION OF ANY SPECIFIC TRADING PROGRAM WHICH CANNOT BE FULLY ACCOUNTED FOR IN THE PREPARATION OF HYPOTHETICAL PERFORMANCE RESULTS AND ALL OF WHICH CAN ADVERSELY AFFECT ACTUAL TRADING RESULTS


GOOD TRADING !

Trading Futures, Options on Futures, and retail off-exchange foreign currency transactions involves substantial risk of loss and is not suitable for all investors. You should carefully consider whether trading is suitable for you in light of your circumstances, knowledge, and financial resources. You may lose all or more of your initial investment. Opinions, market data, and recommendations are subject to change at any time. Past performance is not indicative to future results.

If you like Our Futures Trading Daily Support and Resistance Levels, Please share!


Futures Trading Levels

Contract Sept. 2014 SP500 Nasdaq100 Dow Jones Mini Russell Dollar Index
Resistance 3 2013.92 4092.25 17235 1193.53 83.04
Resistance 2 2008.33 4084.00 17183 1184.27 82.89
Resistance 1 2003.42 4078.25 17140 1179.03 82.78
Pivot 1997.83 4070.00 17088 1169.77 82.63
Support 1 1992.92 4064.25 17045 1164.53 82.53
Support 2 1987.33 4056.00 16993 1155.27 82.38
Support 3 1982.42 4050.25 16950 1150.03 82.27
Contract December Gold Sept.Silver Oct. Crude Oil September Bonds Sept. Euro
Resistance 3 1307.4 19.9 95.34 141 18/32 1.3252
Resistance 2 1299.6 19.8 94.85 141 10/32 1.3233
Resistance 1 1291.2 19.6 94.34 140 28/32 1.3203
Pivot 1283.4 19.4 93.85 140 20/32 1.3184
Support 1 1275.0 19.2 93.34 140 6/32 1.3154
Support 2 1267.2 19.1 92.85 139 30/32 1.3135
Support 3 1258.8 18.9 92.34 139 16/32 1.3105
Contract Dec Corn Dec. Wheat Nov. Beans Dec. SoyMeal Dec. bean Oil
Resistance 3 371.9 558.0 1038.83 349.67 33.78
Resistance 2 369.3 557.5 1033.67 347.23 33.49
Resistance 1 367.2 557.0 1030.83 345.37 33.33
Pivot 364.6 556.5 1025.67 342.93 33.04
Support 1 362.4 556.0 1022.8 341.1 32.9
Support 2 359.8 555.5 1017.67 338.63 32.59
Support 3 357.7 555.0 1014.83 336.77 32.43
Economic Reports

source: http://www.forexfactory.com/calendar.php

All times are Eastern time Zone (EST)


Date 3:55pm Currency Impact Detail Actual Forecast Previous Graph
WedAug 27 2:00am CHF UBS Consumption Indicator 2.06
EUR GfK German Consumer Climate 8.9 9.0
EUR German Import Prices m/m -0.1% 0.2%
10:30am USD Crude Oil Inventories 1.1M -4.5M
Tentative AUD HIA New Home Sales m/m 1.2%
9:30pm AUD Private Capital Expenditure q/q -0.6% -4.2%

This is not a solicitation of any order to buy or sell, but a current market view provided by Cannon Trading Inc. Any statement of facts here in contained are derived from sources believed to be reliable, but are not guaranteed as to accuracy, nor they purport to be complete. No responsibility is assumed with respect to any such statement or with respect to any expression of opinion herein contained. Readers are urged to exercise their own judgment in trading

Market Recap, Trading Levels & Economic Reports 8.19.2014

Hello Traders,

For 2014 I would like to wish all of you discipline and patience in your trading!


As I usually try to do on Mondays, a little on the fundamental side that affected trading in the past few days and should have an effect on trading this week. From our friends at www.TradeTheNews.com


TradeTheNews.com Weekly Market Update: The Guns of August


– It may be August but markets refuse to settle into a sleepy late summer trading pattern as even more geopolitical shocks and economic slowdown in Europe and Asia keep things very interesting. US stock averages were on track for their best gains in several weeks until heightened tensions in eastern Ukraine knocked them over on Friday and sent the 10-year UST yield to one-year lows around 2.322% and the German 10-year Bund below the 1% mark for the first time ever. In Brazil, the death of an opposition presidential candidate threw the campaign into turmoil, while there was finally some good news out of Iraq. Terrible European GDP data and worrying numbers in Asia left serious questions about the sustainability of the global economic recovery. Stocks continued to climb the wall of worry, and for the week the DJIA rose 0.7%, the S&P500 gained 1.2%, and the Nasdaq added 2.2%.- The situation in Ukraine kept markets off balance this week, as stories of escalation and de-escalation alternated in quick succession. Kiev was tightening the noose around separatist strongholds Donetsk and Lugansk as the Russian authorities dispatched a humanitarian aid convoy of 280 trucks to help civilians in eastern Ukraine, although Kiev and the Western powers reacted to the move as a thinly-veiled provocation. In a speech on Thursday, Russian President Putin said his government would do “all it can” to stop the conflict in Ukraine and asserted that Russia should not isolate itself from the outside world, inspiring a sense that finally de-escalation was at hand. But within 24-hours of Putin’s dovish speech, an incursion into Ukrainian territory by a column of purported Russian armored vehicles and a Ukraine army attack on the column briefly prompted fears that the crisis was headed for a more serious confrontation.

– Data out this week stoked fears of economic slowdown in Asia and Europe. In China, the July new yuan loans measure plunged by two-thirds m/m to the lowest level since January 2010, reviving talk about a Chinese economic hard landing. German GDP shrank 0.2% sequentially, putting the annualized figure at +0.8%, while French and Eurozone q/q GDP was flat. Japan initial second quarter GDP saw the economy contract by the biggest margin since the massive earthquake three years ago, although the drop was not as bad as expected. The numbers were widely expected, given the increase in sales tax, however the 5% contraction in private consumption was much bigger than the -3.7% expected. The one bright spot was the UK, where a modest expansion continued, with preliminary GDP +0.8% q/q and +3.2% y/y.

– The JOLTS report out this week showed that job openings surged to their highest level in over a decade in June. The data suggests there are about two unemployed job seekers for each available job in the economy. Fed Chair Yellen has referred to the JOLTS report as one of her key metrics for gauging labor demand in the US economy, and investors will be closely watching her remarks for any hawkish tones at her Jackson Hole speech next Friday which will focus on the labor market.

– The outbreak of the Ebola virus in West Africa continues to escalate, with about 2,000 confirmed cases reported from Guinea, Liberia, Nigeria, and Sierra Leone, and the mortality rate running over 50%. The WHO has warned that there is evidence that the number of reported cases and deaths vastly underestimate the magnitude of the outbreak.

– After massive pressure from a wide spectrum of domestic political players plus the US and Iran, Iraq PM Maliki stepped down this week after Iraqi President Masoum designated a new candidate to form a government. There had been fears Maliki would try to foment a coup and hold on to power, however the armed forces gave him no support, undercutting his position. Late in the week, leaders of the Sunni and Kurdish factions threw tentative support behind the new PM, Al-Abadi, raising hopes for a more inclusive and cohesive government. In the north, US airstrikes seemed to lift the siege of the Yazidi minority trapped on Mount Sinjar, but ISIS remains as strong as ever.

– Kinder Morgan announced plans this week to eliminate its master limited partnership structure and consolidate the four Kinder firms – Kinder Morgan Energy Partners, El Paso Pipeline Partners and Kinder Morgan Management – into one company. All four names rocketed higher after Kinder Morgan announced the $70 billion megadeal, which caught observers by surprise considering that Kinder was the first major energy firm to pioneer the MLP approach. The new Kinder Morgan entity will pay out a very generous dividend of $2/share in 2015, up 16% from this year.

– The July US advance retail sales numbers were flat, for the worst reading in the series in six months. The ex-autos figure was little better, at +0.1%. Analysts suggested that the weak July data is merely making up for unexpectedly strong numbers in May and June. Retail majors Macy’s and Walmart released very soft second-quarter results and trimmed forward guidance. JCPenny, Nordstrom, and Kohl’s reported decent quarterly numbers, with JCP and JWN both disclosing positive comps and higher guidance.

– Retail analyst firm ChannelAdvisor released estimated July SSS figures for Amazon and eBay. It said that Amazon July SSS were +40.4% versus June SSS of +34.4%, and estimated eBay July SSS +9.7% versus June SSS +12.3%. Shares of Amazon gained after the report while shares of eBay lost ground this week.

– In other earning news, Cisco reported flattish fourth-quarter performance and first-quarter guidance, which was received by markets without much enthusiasm. The company also launched another round of sizable job cuts, reducing the workforce to refocus on its strongest business segments. Deere mowed down its FY14 forecasts, and saw both earnings and revenue decline on a y/y basis. SeaWorld shares sank after a terrible quarter as gate receipts plummets, and the company responded to recent bad press by announcing it would improve the habitat areas for its signature orcas.

– The weak European GDP numbers and the continuing geopolitical tensions aided dollar strength. EUR/USD retested the nine-month lows seen last week, briefly dropping below 1.3340. Euro sell stops are said to be clustered below 1.3330. The BoE Quarterly Inflation Report was nowhere near as hawkish as expected, as it merely amended its spare capacity view to 1.00-1.25% from 1.00-1.50% prior and trimmed the wage growth forecast for 2014 and 2015. The BoE said there were no numerical thresholds for wage growth to trigger a rate hike. This contrasts sharply with Governor Carney’s earlier more hawkish tone. GBP/USD tested four-month lows in the aftermath of the report, around 1.660, and racked up its sixth straight week of losses.


Source: http://www.tradethenews.com/?storyId=1587834


Continue reading “Market Recap, Trading Levels & Economic Reports 8.19.2014”

Futures Trading Tips, Levels & Reports 8.15.2014

Hello Traders,

For 2014 I would like to wish all of you discipline and patience in your trading!


Just like a basketball player doesn’t just show up for the game a minute before and starts playing, so does a trader need to prepare him/herself for trading.


You may not need to warm or shoot around but it definitely does not hurt to visualize successful trading, be rested, relaxed and more specifically, know the following:


↔What reports are coming out

↔Overview of longer time frames

↔Key support and resistance levels

↔Go over your equity run

↔Make sure your surroundings will enable you to trade

↔Fit trading into your schedule, life style not viceversa

↔E-mail us to be added to a daily newsletter which outlines reports and levels for each trading day


Continue reading “Futures Trading Tips, Levels & Reports 8.15.2014”

Gold Daily Continuation Chart – Levels & Reports 8.14.2014

Hello Traders,

For 2014 I would like to wish all of you discipline and patience in your trading!


So I was doing some research and signal evaluator work on some candlesticks formation to go along with some of the conditions I like to use and figured might as well share some of the basic knowledge with my readers…

The following is taken from my CQG trading/chart terminal. If anyone is interested in a free trial, feel free to email me or visit our CQG section on our website.

So today, two formations I started exploring:

1. Engulfing Bearish

The Engulfing Bearish formation is, of course, a bearish formation and therefore its symbol (EG) will always appear at the top of the formation. It represents the opposite of the Engulfing Bullish formation. Three criteria establish an Engulfing Bearish formation:

*The market has to be in a clearly definable up-trend, even if the trend is short term.

*Of the 2 candlesticks in the formation, the second candle’s real body must engulf the first candle’s real body.

*The second real body of the formation should be “down” while the first real body should be “up.”


2. Engulfing Bullish

The Engulfing Bullish formation is, of course, a bullish formation and therefore its symbol (EG) will always appear at the bottom of the formation. It represents the opposite of the Engulfing Bearish formation. Three criteria establish an Engulfing Bullish formation:

*The market has to be in a clearly definable downtrend, even if the trend is short term.

*Of the 2 candlesticks in the formation, the second candle’s real body must engulf the first candle’s real body.

*The second real body of the formation should be “up” while the first real body should be “down.”


824


Above is a daily chart of Gold futures, going back to March 17th 2014 where one can see a good example of the ” Bearish EG”  formation and yet in the same exact chart you can see a failed “Bullish EG” formation on May 2nd 2014.


Will continue and explore a few other candlesticks formations over the next couple of weeks.

Continue reading “Gold Daily Continuation Chart – Levels & Reports 8.14.2014”

Mindful of Trading Size – Futures Reports & Levels 8.13.2014

Hello Traders,

For 2014 I would like to wish all of you discipline and patience in your trading!


Today I want to touch briefly on a very important subject of “position size”.

Many traders spend hours and hours on trading signals, studies, reviewing the charts and patterns yet dedicate very little time to the subject of money management and one of it’s important aspects – position size.

If you have the ability, risk capital and desire to trade more than one contract, then position size is an important aspect.

How do you decide if you going to enter a trade with 2 or 10 contracts?
Are you the type of trader that gets in and out with ALL contracts or perhaps you enter and exit in layers?
Do you have certain set ups/ signals you feel stronger about and you enter with larger trade quantity? or do you enter all trades with a predefined number of contracts?
How do you calculate the number of contracts you will enter per trade? is it based on your account value? the market you trade?
does it changes with out regards to the account size?

As I mentioned in the beginning of this very short blog which meant to wake up that part in you as a trader, this subject is much deeper than a quick blog post but the questions/ thoughts above should encourage you to put more time and research into this matter.

To finish I will share just a few tips that I found useful and like to use:

1. Lower trade size when volatility increases as normally you will need to give your trade more room.
2. If you feel  uneasy when in a trade, more than normal, that means you are probably trading larger quantity than you should be.
3. Try to do some math based on your trading performance, worst draw-down, amount of maximum losing trades etc. to determine the amount of contracts per $ equity in the account. Example, “I will trade 1 contract of mini SP 500 per trade signal per $5,000 of equity in the account.”
4. Evaluate periodically as your account value fluctuates and as the market fluctuates.


Continue reading “Mindful of Trading Size – Futures Reports & Levels 8.13.2014”

Mini S&P Daily Continuation Chart – Levels & Reports 8.12.2014

Hello Traders,

For 2014 I would like to wish all of you discipline and patience in your trading!

Nice bounce on stock index futures after the lows we made Thursday night.

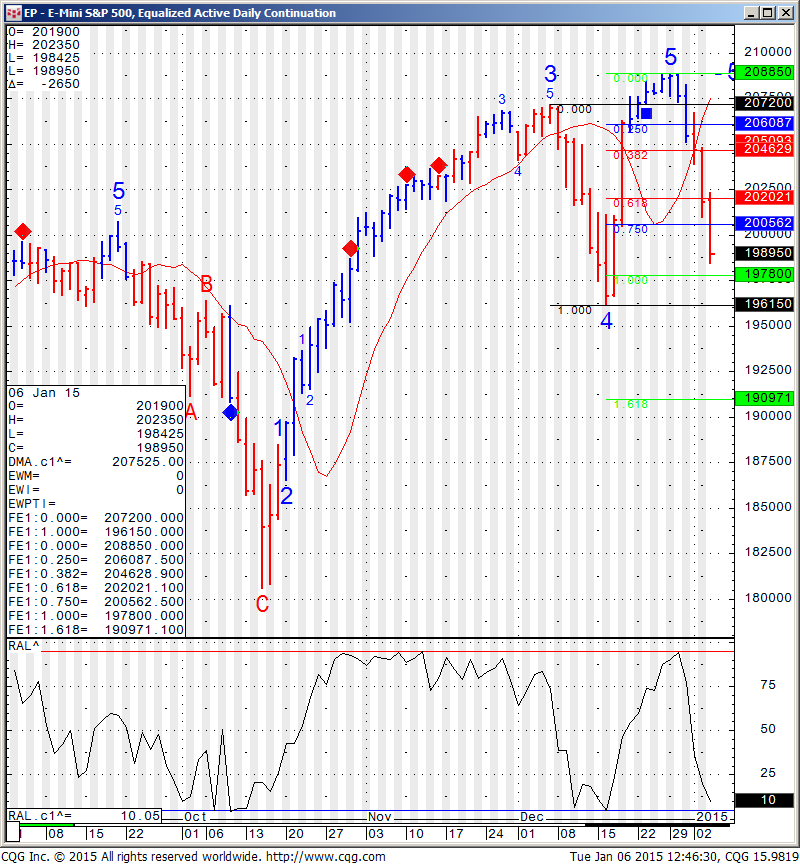
So far the market has respect to the symmetry I am sharing below and the current bounce should test 1951 if continues OR test 1913 if selling pressure resumes. These are the levels I will be watching as in between we have enough room for intraday fluctuations. Volume today was light and action took place mostly in the first few hours. August is know to be the “month of vacations” over at Europe.
Mini SP 500 daily chart for your review below:


823


In between the Geo political focus will be on the situation in Iraq and the concerning issue of the Islamic group known as ISIS.

Continue reading “Mini S&P Daily Continuation Chart – Levels & Reports 8.12.2014”

SP 500 Futures Testing Major Support Zone – Levels & Reports for 8.8.2014

Hello Traders,

For 2014 I would like to wish all of you discipline and patience in your trading!

SP 500 made new lows and about to test a series of support levels as one can see in the daily chart below:

We have few levels of support between 1885 and 1896.50 in case we break again below the psychological 1900 mark.

I mentioned a couple of days ago support of 1795 by mistake and was asked by few of the readers. That was a typo the support I meant to write is 1895.

Looks like we will visit that level and zone very soon, maybe as early as night session. My best guess is for an initial bounce of that level. Just a guess. Either way I will look to see what kind of reaction we get if and when we get down there.

A strong bounce may signal some more upside, however a break below 1895-1885 level may actually make my 1795 typo into a reality… 822

Continue reading “SP 500 Futures Testing Major Support Zone – Levels & Reports for 8.8.2014”

Crude Oil Futures Testing Major Weekly Support Level, SP500 Volatility Higher + Levels for 8.6.2014

Hello Traders,

For 2014 I would like to wish all of you discipline and patience in your trading!

Volatility has picked up again! Make sure you adapt as markets are always changing and what may work for range bound/ low volatility days will not work for wide range/ higher volatility days.

I see major support for SP500 at 1795 and it will be interesting to see price reaction if we test this level in the next few days.

On a different note, I wrote a quick analysis along with chart for Crude Oil futures at:

http://experts.forexmagnates.com/crude-oil-attempting-break-lower/

Continue reading “Crude Oil Futures Testing Major Weekly Support Level, SP500 Volatility Higher + Levels for 8.6.2014”