Weekly Newsletter: Bean Oil Outlook, Crude Oil System+ Trading Levels for Oct. 28th

Get Real Time updates and more by joining our Private Facebook Group!
Subscribe to our YouTube Channel

C86

Cannon Futures Weekly Letter Issue # 1214

In this issue:

  • Important Notices – Earnings & NFP, Consumer Confidence
  • Futures 102 – Recognizing Chart Patterns
  • Hot Market of the Week – December Bean Oil
  • Broker’s Trading System of the Week – Crude Oil Swing Trading System
  • Trading Levels for Next Week
  • Trading Reports for Next Week


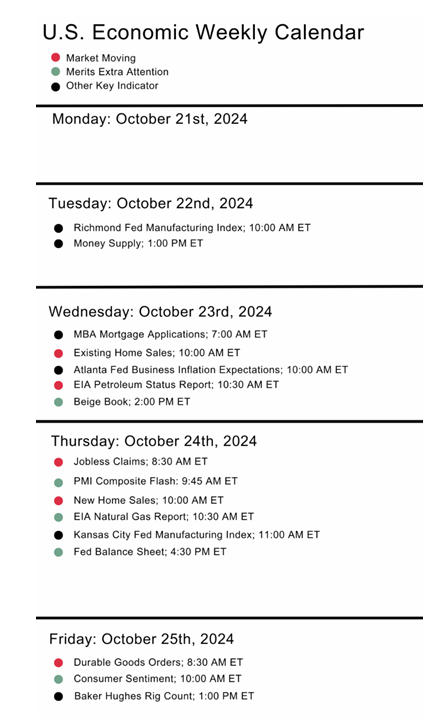
Important Notices – Next Week Highlights:


The Week Ahead

By Mark O’Brien, Senior Broker


We’re a week away from the Labor Dept.’s release of its monthly Non-farm payrolls report. It’s widely considered to be one of the most important and influential measures of the U.S. economy. The report is released at 7:30 A.M., Central Time on the first Friday of the month.

U.S. Election Day (Nov. 5th) countdown: 11 days


Next week’s earnings include some of the largest U.S. companies by market cap.:


Apple, Microsoft, Alphabet (Google), Amazon, Meta (old Facebook), Berkshire Hathaway, Visa, Exxon Mobile, Chevron, Merck, McDonalds, Caterpillar, Uber


Apple and Microsoft each boast a market cap. of over $3 trillion. That’s 3,000,000,000,000. Google and Amazon come in at about $2 trillion.


Tuesday, Oct. 29th:


9:00: Consumer Confidence


Wednesday, Oct 30th:


7:30: Gross Domestic Product (3rd qtr.)

ADP Employment


Thursday, Oct. 31st:


7:30: Personal Income / Spending

7:30: Personal Consumption & Expenditures – Index & year-over-year

8:45: Chicago Purchasing Managers Index


Friday, Nov. 1st:


Non-Farm Payrolls / U.S. Unemployment Report


Futures 101: Ask a Broker!!

Ask a Broker: Why Trade Bitcoin Futures?

thumbnail?url=https%3A%2F%2Fi.ytimg.com%2Fvi%2FtQSPiEDjKkc%2Fhqdefault


Before Your next Trade, learn to recognize charts and patterns!

Learning the different types of charts and patterns will be another arsenal in your Trading Tools!

  • What is an Ascending Triangle Futures Chart Pattern?

What is an Ascending Triangle Futures Chart Pattern?

An ascending triangle is a bullish futures pattern that can indicate a breakout in the upwards direction.

How do I Recognize an Ascending Triangle Futures Chart Pattern?

An ascending triangle is formed when resistance remains flat and support rises.

What Does a Ascending Triangle Chart Pattern Mean?

The price will rise and fall within the triangle until support and resistance converge. At that point, the apex, breakout occurs, usually upwards.

  • What is a Broadening Top Futures Chart Pattern?
  • Head & Shoulders?
  • Bull Flags?
  • Bear Flags?
  • Rectangle Bottoms?
  • Rectangle Tops?
  • See ACTUAL Charts Patterns images AND many more patterns you should know as a trader!

LEARN THE REST


stars

3b644da2 2bee 4d39 8d98 5208a20bec39


    • Hot Market of the Week – December Hogs

    Hot market of the week is provided by QT Market Center, A Swiss army knife charting package that’s not just for Hedgers, Cooperatives and Farmers alike but also for Spread traders, Swing traders and shorter time frame application for intraday traders with a unique proprietary indicator that can be applied to your specific trading needs.

    FREE TRIAL AVAILABLE

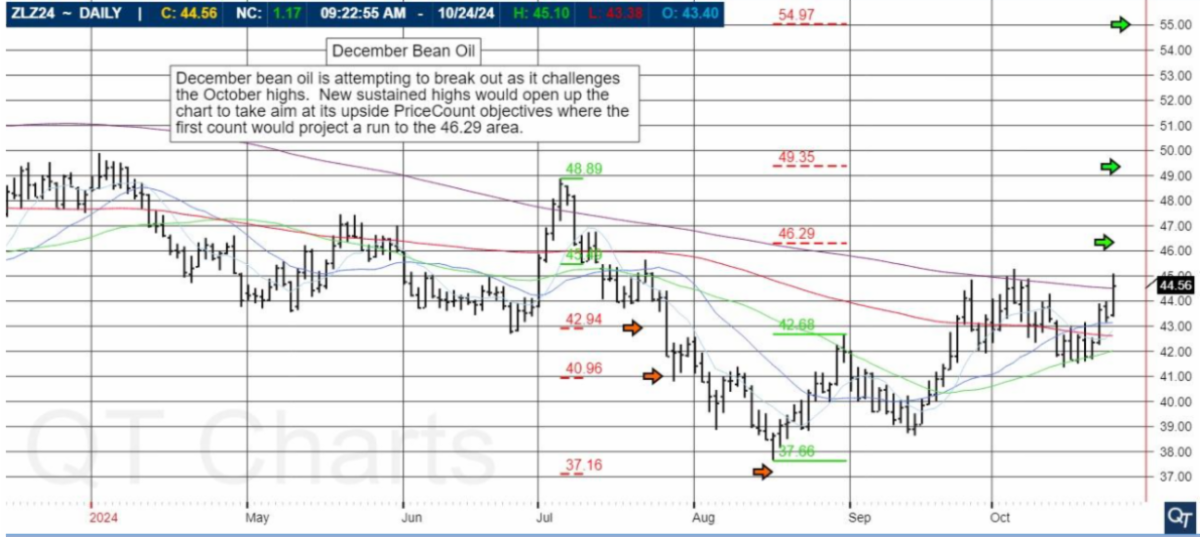
    December Bean Oil

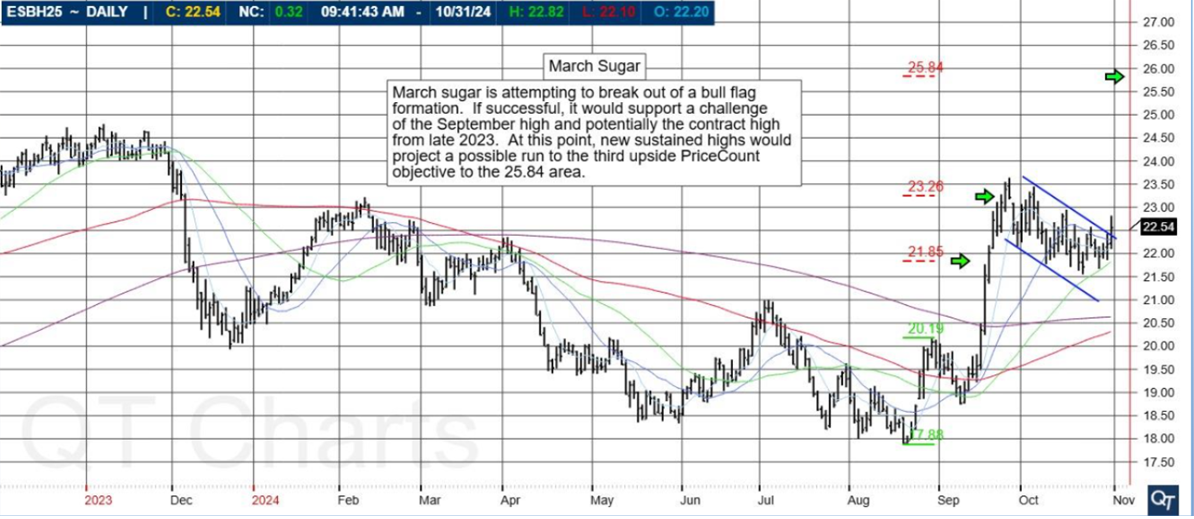
    December bean oil is attempting to break out as it challenges the October highs. New sustained highs would open up the chart to take aim at its upside PriceCount objectives where the first count would project a run to the 46.29 area.


    PriceCounts – Not about where we’ve been , but where we might be going next!

    990a6ed8 2749 4858 898b 84a2b2e631a6

The PriceCount study is a tool that can help to project the distance of a move in price. The counts are not intended to be an ‘exact’ science but rather offer a target area for the four objectives which are based off the first leg of a move with each subsequent count having a smaller percentage of being achieved. It is normal for the chart to react by correcting or consolidating at an objective and then either resuming its move or reversing trend. Best utilized in conjunction with other technical tools, PriceCounts offer one more way to analyze charts and help to manage your positions and risk. Learn more at www.qtchartoftheday.com
Trading in futures, options, securities, derivatives or OTC products entails significant risks which must be understood prior to trading and may not be appropriate for all investors. Past performance of actual trades or strategies is not necessarily indicative of future results.

   Broker’s Trading System of the Week

With algorithmic trading systems becoming more prevalent in portfolio diversification, the following system has been selected as the broker’s choice for this month.

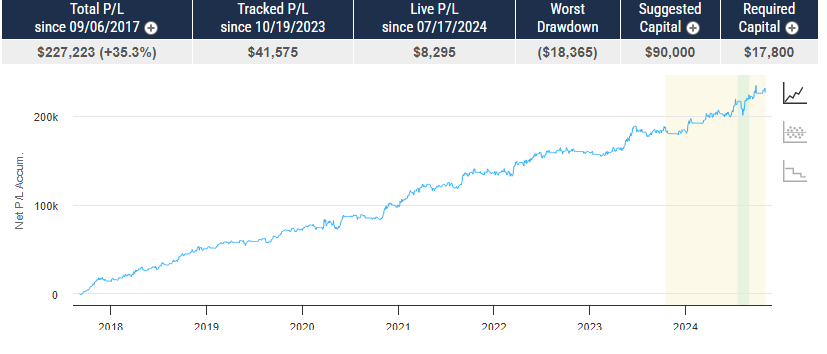
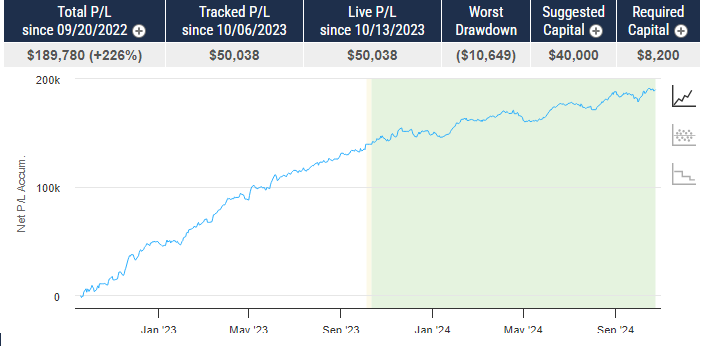
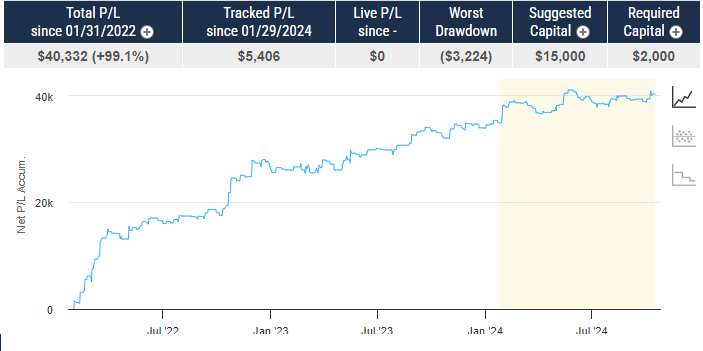
Position Trading Cont v.22 _ CRUDE

PRODUCT

CL – Crude Oil


SYSTEM TYPE

Swing Trading


Recommended Cannon Trading Starting Capital

$25,000


COST

USD 165 / monthly


Get Started

Learn More

4ed8344a e876 415f 927a 7e1c58431eb7

The performance shown above is hypothetical in that the chart represents returns in a model account. The model account rises or falls by the average single contract profit and loss achieved by clients trading actual money pursuant to the listed system’s trading signals on the appropriate dates (client fills), or if no actual client profit or loss available – by the hypothetical single contract profit and loss of trades generated by the system’s trading signals on that day in real time (real‐time) less slippage, or if no real time profit or loss available – by the hypothetical single contract profit and loss of trades generated by running the system logic backwards on back adjusted data. Please read full disclaimer HERE.
Would you like to receive daily support & resistance levels?
Yes
S
No
S

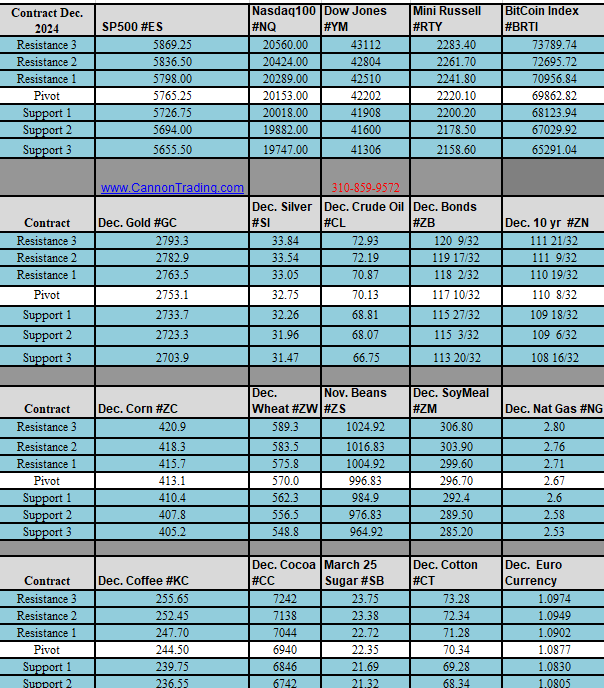
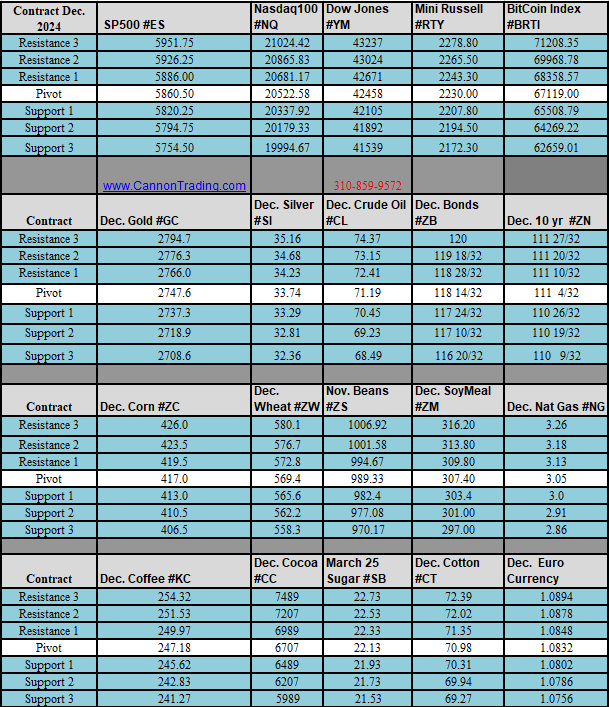
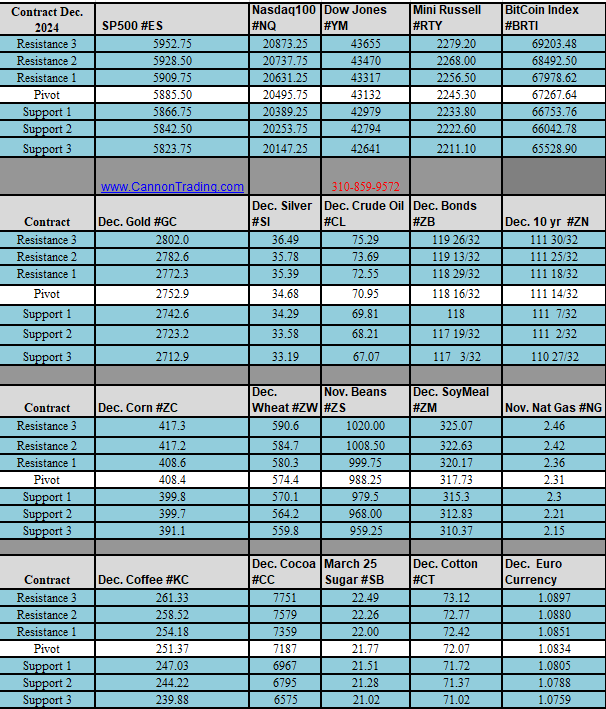
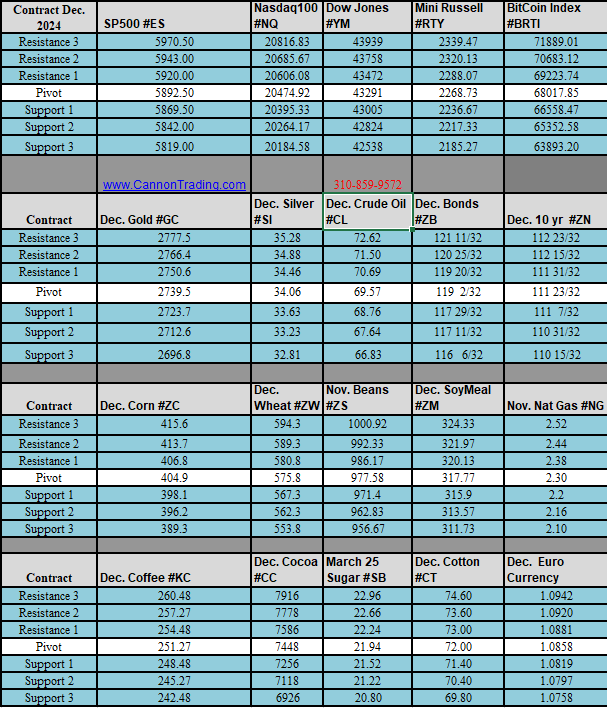
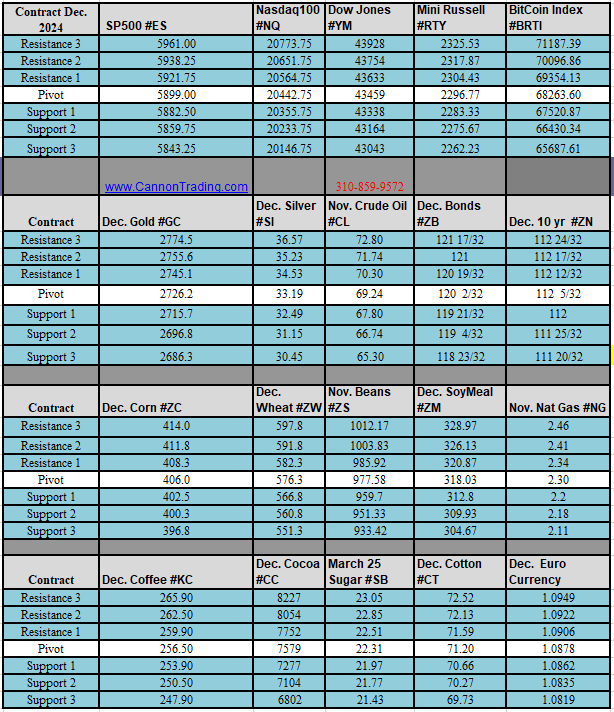
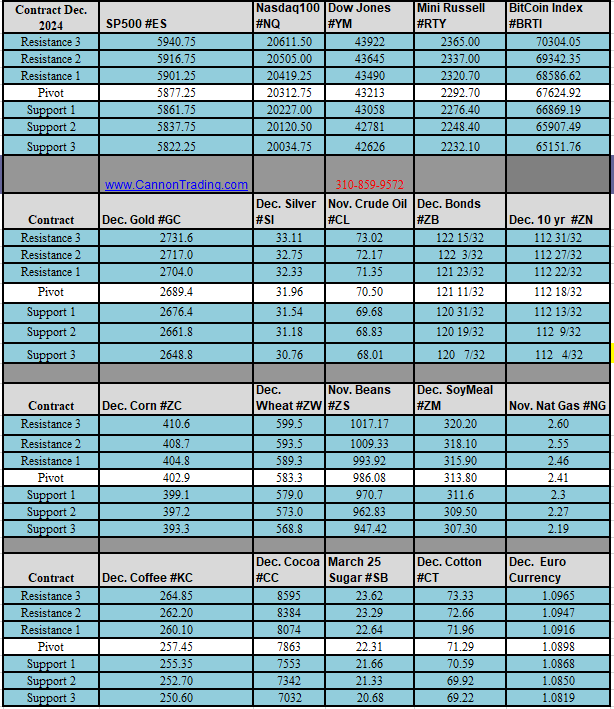
Daily Levels for October 28th, 2024

5c4c45df 5996 416a acd5 57181a871cdd

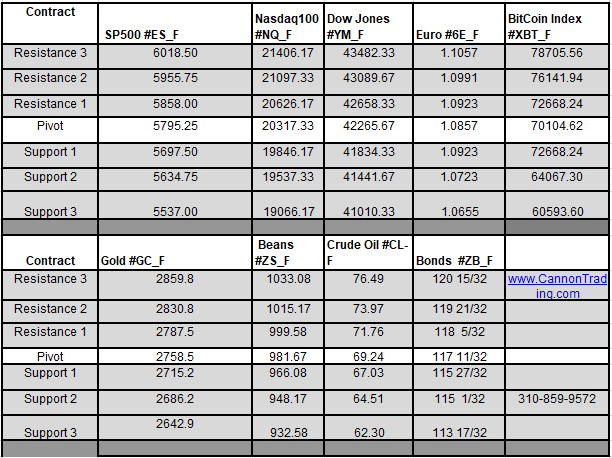
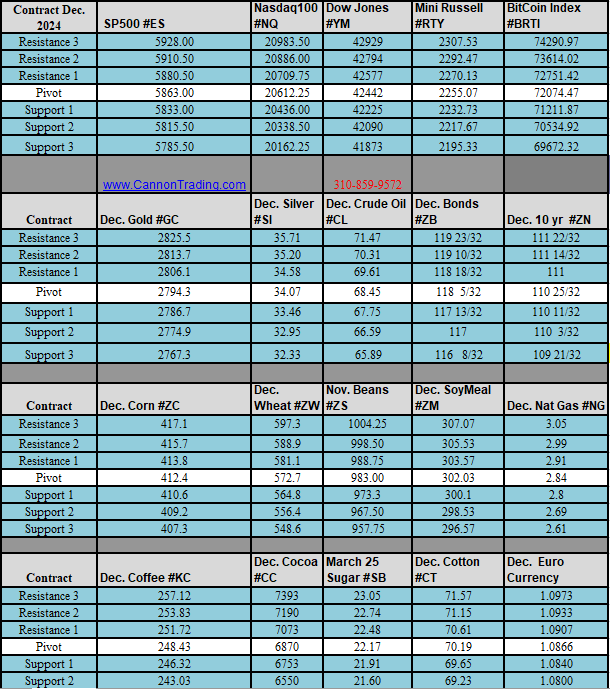
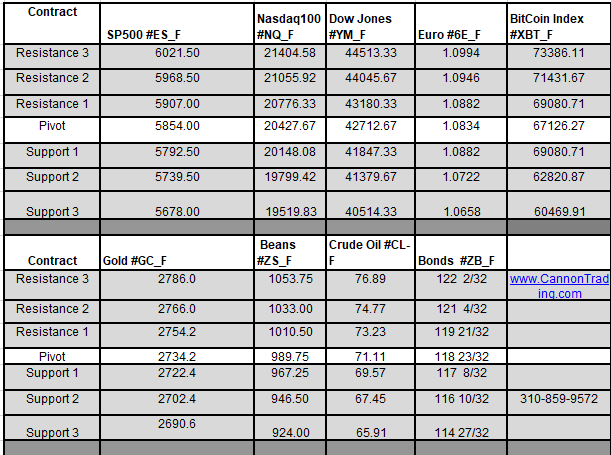
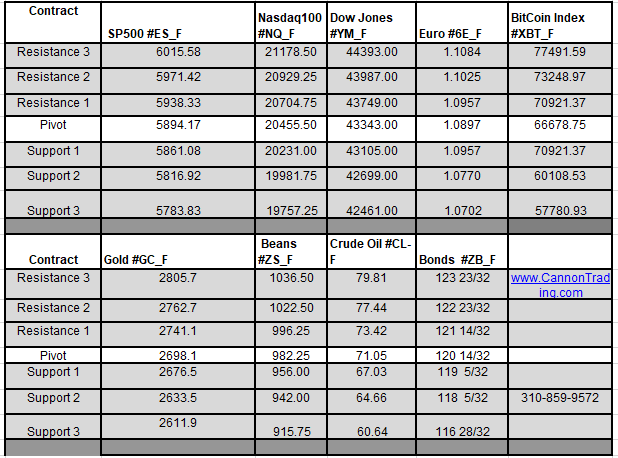
Weekly Levels for the week of October 28th, 2024

3494a9d9 17cc 46ee 98b1 64648344cea7


bf9b3e0d 9c23 44e8 980c a8c01bfbe2cf

Trading Reports for Next Week

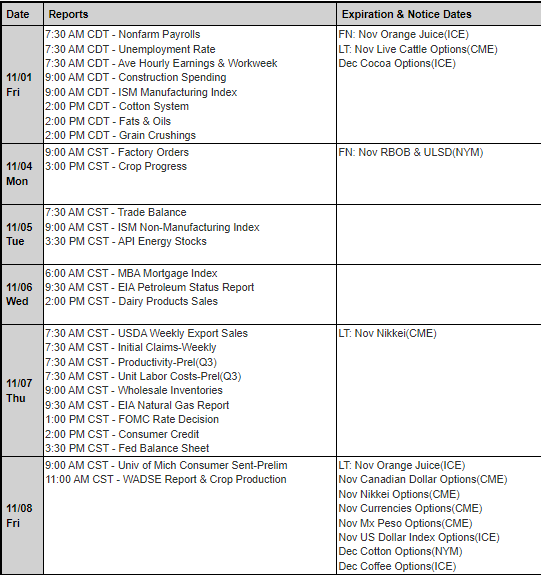
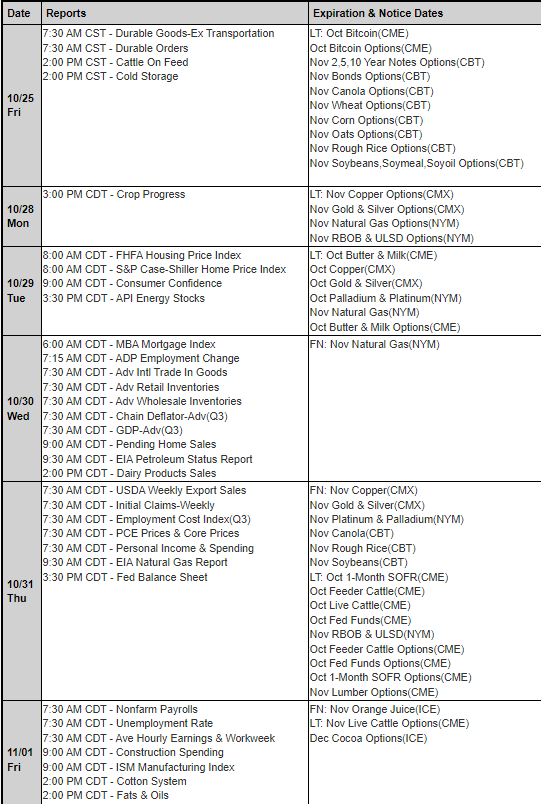
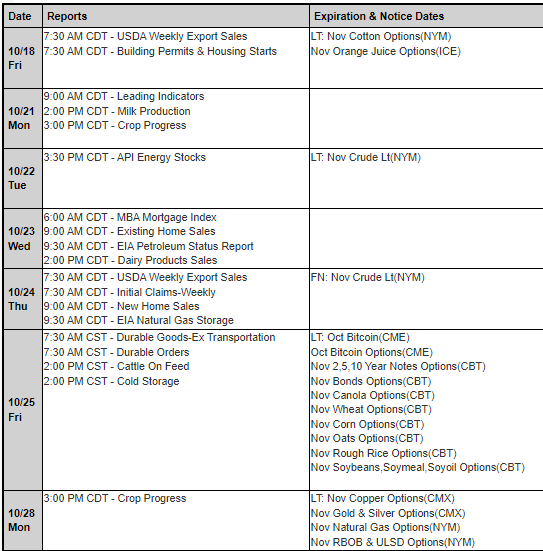
First Notice (FN), Last trading (LT) Days for the Week:
db4c281c 3c99 4515 8a25 1894ec24da04

Improve Your Trading Skills

Get access to proprietary indicators and trading methods, consult with an experienced broker at 1-800-454-9572.

Explore trading methods. Register Here

* This is not a solicitation of any order to buy or sell, but a current market view provided by Cannon Trading Inc. Any statement of facts here in contained are derived from sources believed to be reliable, but are not guaranteed as to accuracy, nor they purport to be complete. No responsibility is assumed with respect to any such statement or with respect to any expression of opinion herein contained. Readers are urged to exercise their own judgement in trading.

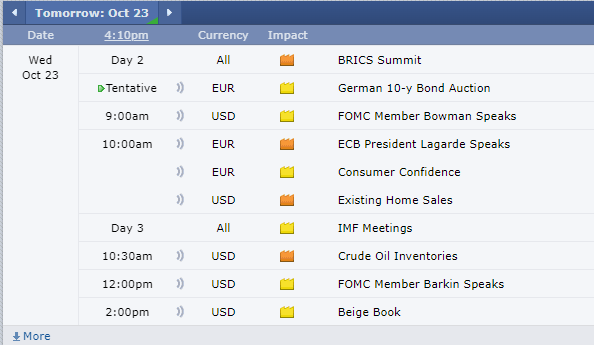
Tomorrow’s Market Lineup: Existing Home Sales, Beige Book, and Crude Oil Reports

Join our Private Facebook group

Subscribe to our YouTube Channel

Listen to our podcast: Subscribe on AppleSpotify, Amazon, or wherever you listen to podcasts!

C79

Existing Home Sales, Beige Book, Crude Oil numbers heading tomorrow’s line up!

Ask a Broker: Futures Spreads Trading


stars
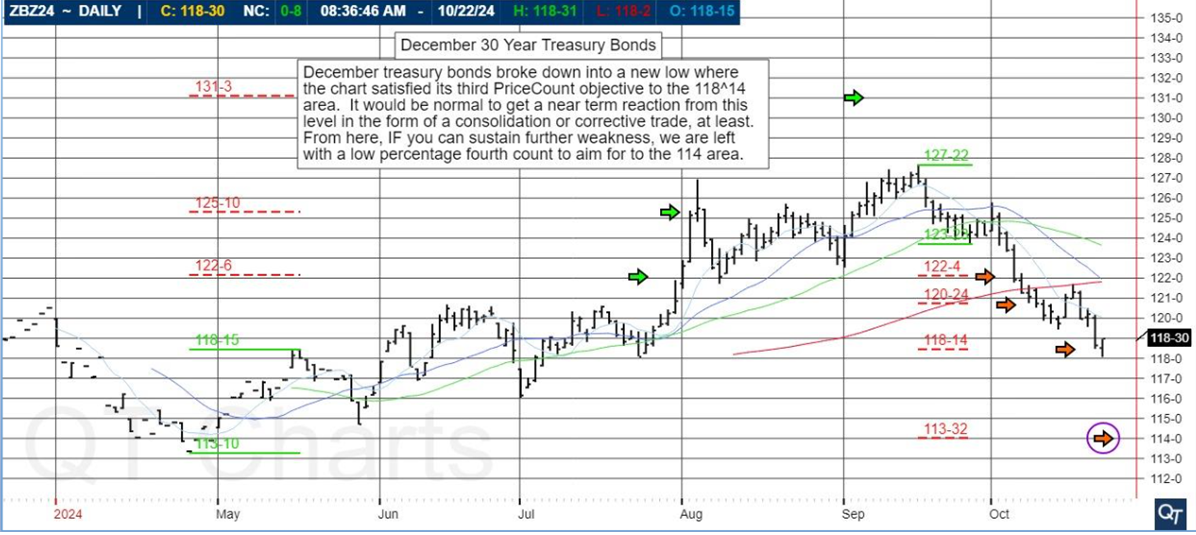
December 30 Year Treasury Bonds

December treasury bonds broke down into a new low where the chart satisfied its third PriceCount objective to the 118^14 area. It would be normal to get a near term reaction from this level in the form of a consolidation or corrective trade, at least. From here, IF you can susustain furuther weakness, we are left with a low percentage fourth count to aim for to the 114 area.


f6d55f9c a187 401f 8160 e9db99aa47f7

The PriceCount study is a tool that can help to project the distance of a move in price. The counts are not intended to be an ‘exact’ science but rather offer a target area for the four objectives which are based off the first leg of a move with each subsequent count having a smaller percentage of being achieved. It is normal for the chart to react by correcting or consolidating at an objective and then either resuming its move or reversing trend. Best utilized in conjunction with other technical tools, PriceCounts offer one more way to analyze charts and help to manage your positions and risk. Learn more at www.qtchartoftheday.com

Trading in futures, options, securities, derivatives or OTC products entails significant risks which must be understood prior to trading and may not be appropriate for all investors. Past performance of actual trades or strategies is not necessarily indicative of future results.

Daily Levels for Oct. 23rd 2024

ebc6c784 226d 45eb 9864 fe3bb888ec19

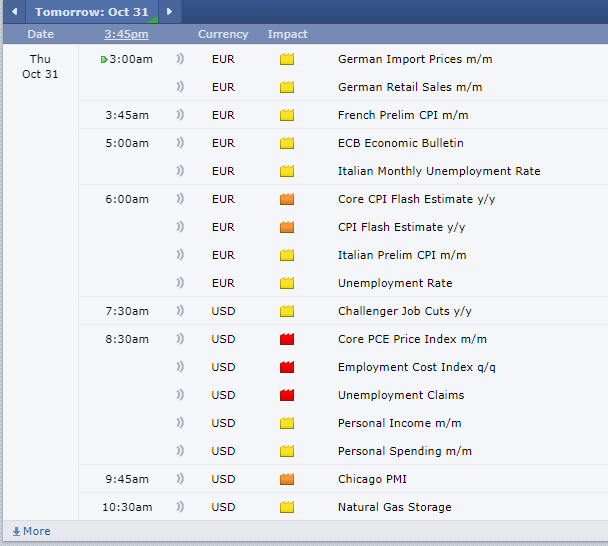
Economic Reports
provided by:ForexFactory.com
All times are Eastern Time ( New York)
36362de1 5c22 4a99 934e 13d4550fe838
Good Trading!
About: Cannon Trading is an independent futures brokerage firm established in 1988 in Los Angeles. Our mission is to provide reliable service along with the latest technological advances and choices while keeping our clients informed and educated in the field of futures and commodities trading.
Trading Futures, Options on Futures, and retail off-exchange foreign currency transactions involves substantial risk of loss and is not suitable for all investors. You should carefully consider whether trading is suitable for you in light of your circumstances, knowledge, and financial resources. You may lose all or more of your initial investment. Opinions, market data, and recommendations are subject to change at any time.
Contact
S
Cannon Trading Company
12100 Wilshire Boulevard
Suite 1640
Los Angeles, CA 90025
(800) 454-9572
Follow Us
Facebook  Twitter  Instagram
Visit Our Website


AI: The Next Gold Mine or Money Pit? Insights on Markets, Earnings, and Economic Trends

Join our Private Facebook group

Subscribe to our YouTube Channel

Listen to our podcast: Subscribe on AppleSpotify, Amazon, or wherever you listen to podcasts!

C97

Will AI be a gold mine or a money pit?

21 October 2024

By GalTrades.com

Oil went below $70 concern of commodity inflation receded somewhat

Markets are a little stretched on the upside SPX up for 6 weeks, investor sentiment is in favor of the bulls. Small caps appear to be playing catch-up Russell closed at a two-year high Wednesday, which may help sustain the recent uptrend. Next week the economic calendar is light so the focus will be on Q3 earnings, which have been strong so far. The path of least resistance still seems to be trending higher. If the benign earnings momentum doesn’t continue throughout next week perhaps this could provide enough of an excuse for investors to take profits, resulting in a modest pullback in stocks.

What happens with the FED what’s the next move? As long as data continues to validate the soft/no-landing thesis it seems that the bias will continue to remain higher.


Deutsche bank posted that 5-year inflation swaps spiked to the highest level since March 2023. Can we see another spike in inflation that can affect the fed’s next move?

At some point the huge debt levels that we’re running suppress growth and increase interest rates and that leads to higher inflation. The market is pricing in 6 rate cuts of 150 basis points and full-on expectations of $275 of earnings. What if any of the Mag 7 miss earnings? Last quarter they all delivered good earnings and were sold off, we saw profit taking. ASML missed and semies went down this past week. Then we saw positive earnings from Taiwan Semiconductor Manufacturing (TSM), the largest chipmaker in the world. TSM reported a 54% climb in annual profit, better than analysts had expected, driven by accelerating AI demand. I understood it as AI semies demand is there.

Piper Sandler said, “the S&P is overvalued by 8% but so what”.

Stifel said this week “we’re goanna go up another 8 to 10% and then we’re goanna crash 25% sometime next year”.

Bottom line anything is plausible but what’s actionable is now.

Nuclear energy: Mega companies are investing in energy to power their AI infrastructure. AMZN announced it has signed an agreement with Dominion Energy, Virginia’s utility company, to invest more than $500 million to develop small modular reactors. Stocks in nuclear energy space – CEG, VST, D, TLN, LEU, BWXT, OKLO, SMR.

We received solid earnings from Goldman Sachs (GS), Bank of America (BAC), and Citigroup (C). Another newsmaker was UnitedHealth (UNH), which saw shares drop sharply after the company shaved the top end of its guidance amid rising costs. It was the first outlook miss in years for the giant health company.

Treasury yields fell as inflation concerns eased amid sliding crude oil prices on media reports that Israel doesn’t plan to target Iran’s oil sector. Odds of a 25-basis-point Federal Reserve rate cut next month climbed in futures trading Tuesday.

The Russell 2000® Index (RUT) pushed above technical resistance intraday at the July peak near 2,260, though it settled below that. Strength there likely reflects the slight dip in Treasury yields that also lent support to “defensive” and yield-sensitive sectors including real estate, utilities, and consumer staples. The financial sector strength related to strong bank earnings also helps the RUT, which is heavily weighted toward that sector.

Walgreens Boots Alliance jumped more than 15% after the company said it will shut 1,200 stores over the next three years. The company’s earnings beat Wall Street’s estimates. Shares were down about 70% year to date.

Data-wise, October New York Fed Empire State Manufacturing, which provides insight into New York’s manufacturing climate, was much worse than expected at –11.9, with anything under zero indicating contraction. Analysts had expected a reading of 3.6, down from 11.5 a month ago. On a positive note, the report’s six-month outlook rose to its highest in three years, and employment numbers looked strong.

On Thursday we had retail sales. They climbed 0.4%, compared with the 0.2% consensus and 0.1% in August. Excluding autos, one very strong category in retail sales was restaurants and bars, which saw a 1.05% monthly increase.

Retail sales figures indicate consumers are still doing well and spending, which means gross domestic product growth is likely to be in the 3% plus region again.

Ongoing softness in manufacturing and falling commodity prices—reducing inflation expectations, Lower crude prices can help company margins across many industries and keep a lid on inflation.

Before retail sales, the thinking was that the Fed would cut rates 25 basis points in November but consider pausing in December if data remained strong. It’s unclear if a massive jobs report, a warm Consumer Price Index(CPI) and now a very hot retail sales report, would be enough for the Fed to think about a pause at either of its remaining meetings this year. Markets have lowered expectations about the number and size of rate cuts in 2024 due to the strength in the economic data.

It will be a pretty light week of economic data. However, there are two major updates on the state of the housing market, with September’s existing home sales out on Wednesday and September’s new home sales out on Thursday. Housing is a key watch item for investors and the Federal Reserve because it represents a large, unavoidable cost for most Americans, and it’s proven to be a sticky source of inflation. Last week, September housing starts were slightly better than expected, though they were down month over month. We’re unlikely to see a sustained material improvement in the housing market until bond yields come down, which will help pull mortgage rates lower and, in turn, make monthly payments more affordable.

Bonds:

Expect the sideways churning in the bond market to continue until there is a catalyst for the next move. Credit spreads will likely remain tight. The U.S. dollar, having rebounded again from the low end of its two-year trading range, looks like it has some room to move higher as weakness in global growth relative to the United States keeps it firm.

Currently, Bloomberg probabilities suggest a 92% chance of a 25-basis point cut at the November FOMC versus 89% last Friday. Through 2025, the probabilities are suggesting 150 basis points of cuts, which is consistent with the September dot plots from the Fed.

Before the next Federal Reserve meeting November 6–7, key data include September’s Personal Consumption Expenditures (PCE) price index on October 31 and October nonfarm payrolls on November 1.

The European Central Bank (ECB) cut rates 25 basis points for the third time this year.

Futures:

#SLV highest since November 2012. #GLD continues its record run.

As of Tuesday, looking at the daily chart for the Gold Futures December 2024 (/GCZ24) contract we can see significant buying pressure as the contract climbed to new all-time highs. The contract has consistently traded off the 20-Day Simple Moving Average which was tested yesterday on below average volume. /GCZ24 is currently trading well above the 50-Day and 200-Day SMA price points.

According to the CFTC Commitment of Traders report released October 8th managed money traders have decreased their long position by -20,271 contracts and increased their short position by +132 contracts. Managed money traders are net long 194,059 contracts. The 14-Day Relative Strength Index at 59.17% indicates more buyers than sellers.

Chinese stocks are under pressure lately, with declines this month eroding gains from the massive rally sparked by China’s stimulus announcement in September.

Investors appear to have lost faith that the government’s stimulus will be the answer to that economy’s problems,” Yardeni Research said in its Wednesday briefing note. “The quick knee-jerk rally in Chinese equities already looks like it’s getting a leg cramp.”

China’s third-quarter GDP rose 4.6% on an annual basis between July and September, inching just above the Reuters consensus view of 4.5%. Retail sales also climbed more than analyst had expected. Chinese stocks popped more than 3.5% Friday on stimulus hopes despite GDP falling sequentially from 4.7% in the second quarter.

European and Asian stocks mostly climbed this week, and Japan saw inflation dip, which could ease concerns about another rate hike there.

Conclusion from this week:

The decline in oil and solid retail sales this past week point to an economy with moderating inflation and resilient growth.

discipline mandates that we consider lightening up our stock exposure in an overbought market. We’re not there yet but still close.

You need a catalyst for the sector and stock that you’re trading to move higher. The markets were missing a catalyst this week for further upside. Some of the economic reports this week suggest that the FED may slow down further cuts. SPX price-to-earnings (P/E) ratio of nearly 22 remains historically elevated.

Earnings:

  • Monday     (10/21): Sandy Springs Bancorp Inc. (SASR), SAP SE (SAP), Nucor Corp.     (NUE), WR Berkley Corp. (WRB), Alexandria Real Estate Equities Inc. (ARE),     AGNC Investment Corp. (AGNC), Zions Bancorp (ZION). Logitech (LOGI).
  • Tuesday     (10/22): GE Aerospace (GE), Danaher Corp. (DHR), Verizon Communications     (VZ), Philip Morris International Inc. (PM), RTX Corp. (RTX), Lockheed     Martin Corp. (LMT), Texas Instruments (TXN), Baker Hughes Co. (BKR),     Seagate Technology Holdings (STX), Enphase Energy (ENPH), Norfolk Southern     Corp. (NSC), General Motors (GM), Freeport-McMoRan (FCX), 3M (MMM),
  • Wednesday     (10/23): Coca-Cola Co. (KO), Thermo Fisher Scientific Inc. (TMO), Nextera     Energy Inc. (NEE), AT&T Inc. (T), Boeing Co. (BA), General Dynamics     Corp. (GD), Tesla (TSLA), T-Mobile US (TMUS), International Business     Machines Corp. (IBM), ServiceNow Inc. (NOW), Lam Research Corp. (LRCX)
  • Thursday     (10/24): S&P Global Inc. (SPGI), Union Pacific Corp. (UNP), Honeywell     International Inc. (HON), United Parcel Services Inc. (UPS), Northrop     Grumman Corp. (NOC), Carrier Global Corp. (CARR), Capital One Financial     Corp. (COF), Digital Realty Trust Inc. (DLR)
  • Friday     (10/25): Sanofi SA (SNY), HCA Healthcare Inc. (HCA), Colgate-Palmolive Co.     (CL), AON PLC (AON), Centene Corp. (CNC)

Technical Analysis:

NDX is less than 2% away from it’s all time high 20,675. NDX remains in an uptrend and price has been converging over the past two months in triangle trend. mega-cap tech earnings, which we’ll get the week after next, will likely determine whether we can make new all-time highs or not.

Russell appears to be forming a bull flag formation on the charts. This bullish pattern would be confirmed if the index closes above the upper trendline of the flag, or some technicians look for a close above the top of the flagpole which is at Wednesday’s 2,286 close.

KWEB ETF China, retraced 50% according to Fibonacci numbers.

Memoirs of a trader:

For the past two years I added trading options as opposed to just trading stocks. Trading options is very risky we’re paying for time value (every day that passes on your option without the option moving in the direction of your trade, the option loses time value). And if the stocks you’re trading aren’t moving, trading the options is a losing bet. Another thing that caught my attention, 20 years ago options premiums were much cheaper than they are today, The only options trade that worked for me this week was selling a put, taking the other side of the trade (which can be very risky) but works when the underlying stock doesn’t move or moves in your direction. Conclusion stick to trading stocks when the stock isn’t moving you aren’t losing and add options only once the volatility gets going.

Trading stocks, commodity futures and options involves a substantial risk of loss. The information here is of opinion only and do not guarantee any profits. Past performances are not necessarily indicative of future results.


stars

266dfe53 1e2d 4eae a86e 911d4bbd098c

Daily Levels for Oct. 22nd 2024

11608cad b9fb 4b61 a0ba b9ae9b86b957

Economic Reports
provided by:ForexFactory.com
All times are Eastern Time ( New York)
fd5536ce 9ecb 4eaf a0a8 d8bbafa86bb2
Good Trading!
About: Cannon Trading is an independent futures brokerage firm established in 1988 in Los Angeles. Our mission is to provide reliable service along with the latest technological advances and choices while keeping our clients informed and educated in the field of futures and commodities trading.
Trading Futures, Options on Futures, and retail off-exchange foreign currency transactions involves substantial risk of loss and is not suitable for all investors. You should carefully consider whether trading is suitable for you in light of your circumstances, knowledge, and financial resources. You may lose all or more of your initial investment. Opinions, market data, and recommendations are subject to change at any time.
Contact
S
Cannon Trading Company
12100 Wilshire Boulevard
Suite 1640
Los Angeles, CA 90025
(800) 454-9572
Follow Us
Facebook  Twitter  Instagram
Visit Our Website


Weekly Newsletter: Hogs Outlook, Mini Russell System+ Trading Levels for Oct. 21st

Get Real Time updates and more by joining our Private Facebook Group!
Subscribe to our YouTube Channel

Hogs

Cannon Futures Weekly Letter Issue # 1213

In this issue:

  • Important Notices – Earnings & Fed Speakers
  • Futures 101 – Ask a Broker: Day trading Futures? Margins?
  • Hot Market of the Week – December Hogs
  • Broker’s Trading System of the Week – Mini Russell Day Trading System
  • Trading Levels for Next Week
  • Trading Reports for Next Week


Important Notices – Next Week Highlights:


The Week Ahead

By John Thorpe, Senior Broker


A fair amount of Speakers, Data and Earnings .

Just 2 ½ weeks to the U.S. Presidential Election. Nov 5th.


Economic Data:

Mon. CB Leading Indicators

Tue. Redbook, Richmond Fed

Wed. Mortgage Index

Thu. Chicago Fed Activity Index, Weekly Initial Jobless Claims, New Home Sales

Fri. Durable Goods, Michigan Consumer Sentiment.


Fed and ECB Speakers:

Mon. Logan, Kashkari, Schmid

Tue. 9A.M. Central ECB President Lagarde,  Harker

Wed. Bowman, LaGarde 9 A.M. Central, Barkin

Thu. Hammack

Fri. quiet


Earnings: 608 3rd QTR. Reports this week

Prominent Companies reporting

Wed. Tesla, IBM, Coca-Cola

  • Thu. UPS


Futures 101: Ask a Broker!!

What is Futures Margin?

thumbnail?url=https%3A%2F%2Fi.ytimg.com%2Fvi%2F2VQwRHHIQ8Y%2Fhqdefault

What is Day Trading Futures?


“Trading Around Key Economic Reports” FREE SHORT Course you will learn:

  • What is GDP?
  • About the Retail Sales Report
  • What is NFP ( non farm payroll) Report?
  • Understanding US housing Data
  • FOMC
  • Understanding Oil Data Report
  • Importance of Consumer Confidence Survey

ACCESS THE COURSE


stars

3b644da2 2bee 4d39 8d98 5208a20bec39


    • Hot Market of the Week – December Hogs

    Hot market of the week is provided by QT Market Center, A Swiss army knife charting package that’s not just for Hedgers, Cooperatives and Farmers alike but also for Spread traders, Swing traders and shorter time frame application for intraday traders with a unique proprietary indicator that can be applied to your specific trading needs.

    FREE TRIAL AVAILABLE

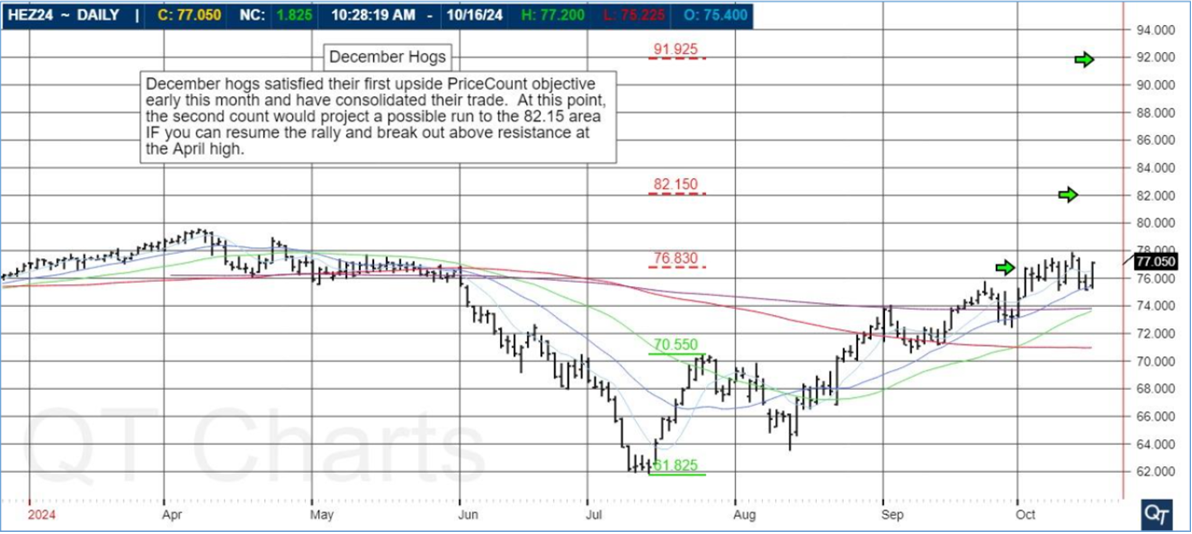
    December Hogs

    December hogs satisfied their first upside PriceCount objective early this month and have consolidated their trade. At this point, the second count would project a possible run to the 82.15 area IF you can resume the rally and break out above resistance at the April high.


    PriceCounts – Not about where we’ve been , but where we might be going next!

    e01a8e3a 0793 4347 9e7c d95ceb169dee

The PriceCount study is a tool that can help to project the distance of a move in price. The counts are not intended to be an ‘exact’ science but rather offer a target area for the four objectives which are based off the first leg of a move with each subsequent count having a smaller percentage of being achieved. It is normal for the chart to react by correcting or consolidating at an objective and then either resuming its move or reversing trend. Best utilized in conjunction with other technical tools, PriceCounts offer one more way to analyze charts and help to manage your positions and risk. Learn more at www.qtchartoftheday.com
Trading in futures, options, securities, derivatives or OTC products entails significant risks which must be understood prior to trading and may not be appropriate for all investors. Past performance of actual trades or strategies is not necessarily indicative of future results.

   Broker’s Trading System of the Week

With algorithmic trading systems becoming more prevalent in portfolio diversification, the following system has been selected as the broker’s choice for this month.

MVA 998 RTY 208

PRODUCT

RTY – Mini Russell 2000


SYSTEM TYPE

Day Trading


Recommended Cannon Trading Starting Capital

$10,000


COST

USD 80 / monthly


Get Started

Learn More

9192efe7 f93a 408e 80ff 3e99390e4cb8

The performance shown above is hypothetical in that the chart represents returns in a model account. The model account rises or falls by the average single contract profit and loss achieved by clients trading actual money pursuant to the listed system’s trading signals on the appropriate dates (client fills), or if no actual client profit or loss available – by the hypothetical single contract profit and loss of trades generated by the system’s trading signals on that day in real time (real‐time) less slippage, or if no real time profit or loss available – by the hypothetical single contract profit and loss of trades generated by running the system logic backwards on back adjusted data. Please read full disclaimer HERE.
Would you like to receive daily support & resistance levels?
Yes
S
No
S

Daily Levels for October 21st, 2024

6b7189b7 de1c 4948 84c1 3cfece6c1954

Weekly Levels for the week of October 21st, 2024

4cbc5539 f55f 49b2 8740 bbceade4e60e


bf9b3e0d 9c23 44e8 980c a8c01bfbe2cf

Trading Reports for Next Week

First Notice (FN), Last trading (LT) Days for the Week:
3f492ad8 7aae 4b88 8a16 73e5bfa0972a

Improve Your Trading Skills

Get access to proprietary indicators and trading methods, consult with an experienced broker at 1-800-454-9572.

Explore trading methods. Register Here

* This is not a solicitation of any order to buy or sell, but a current market view provided by Cannon Trading Inc. Any statement of facts here in contained are derived from sources believed to be reliable, but are not guaranteed as to accuracy, nor they purport to be complete. No responsibility is assumed with respect to any such statement or with respect to any expression of opinion herein contained. Readers are urged to exercise their own judgement in trading.

Action-Packed Thursday: Key Economic Data & Energy Reports; CME Increases Impact Day Trading Margin Requirements

Join our Private Facebook group

Subscribe to our YouTube Channel

Listen to our podcast: Subscribe on AppleSpotify, Amazon, or wherever you listen to podcasts!

C67

Busy day ahead! Natural Gas, Crude Oil numbers, weekly unemployment, retail n umbers, housing numbers, few Fed speakers…., Thursday, Oct. 17th!

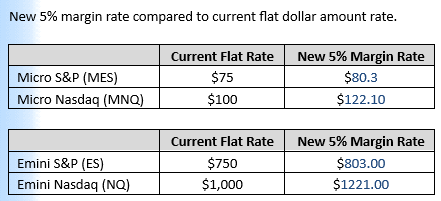
On a different note, as the CME raises margins, the day trading margins may be higher as well.

Depending on the trading platform you are using, your day trading margins may be a percent of the overnight margins. If you are using the E-Futures International, then your day trading margins between 7:45 AM central and 3:30 PM central are as below:

0e7bab50 b9f3 4646 8319 513832198a9e
Any questions, please reach out to your broker.
Ask a Broker: What is Futures Margin?
thumbnail?url=https%3A%2F%2Fi.ytimg.com%2Fvi%2F2VQwRHHIQ8Y%2Fhqdefault


stars
 

Daily Levels for Oct. 17th 2024

6721f9ab 1822 433f 97c0 c292635b8bca

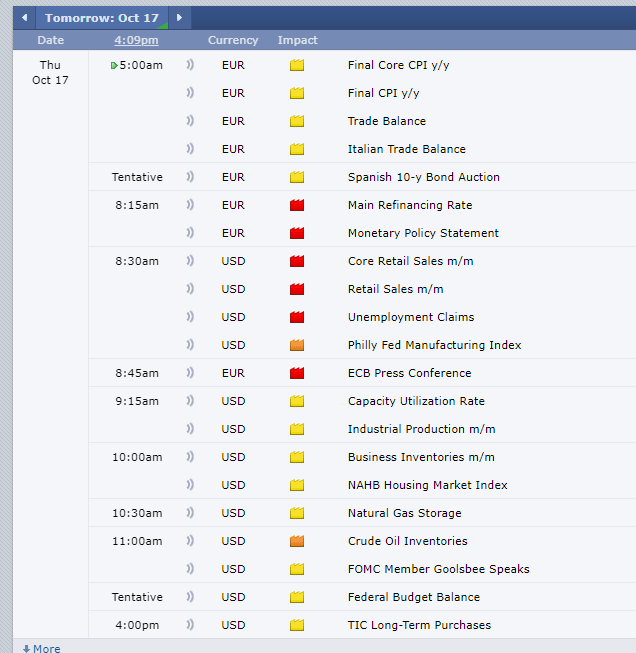
Economic Reports
provided by:ForexFactory.com
All times are Eastern Time ( New York)
64fb3f2c ec79 4e74 9536 4667398d0b14
Good Trading!
About: Cannon Trading is an independent futures brokerage firm established in 1988 in Los Angeles. Our mission is to provide reliable service along with the latest technological advances and choices while keeping our clients informed and educated in the field of futures and commodities trading.
Trading Futures, Options on Futures, and retail off-exchange foreign currency transactions involves substantial risk of loss and is not suitable for all investors. You should carefully consider whether trading is suitable for you in light of your circumstances, knowledge, and financial resources. You may lose all or more of your initial investment. Opinions, market data, and recommendations are subject to change at any time.
Contact
S
Cannon Trading Company
12100 Wilshire Boulevard
Suite 1640
Los Angeles, CA 90025
(800) 454-9572
Follow Us
Facebook  Twitter  Instagram
Visit Our Website


Oil Slumps on OPEC Demand Downgrade, Metals Rally as Fed Rate Cut Hopes Grow

Join our Private Facebook group

Subscribe to our YouTube Channel

Listen to our podcast: Subscribe on AppleSpotify, Amazon, or wherever you listen to podcasts!

C67

Movers and Shakers

By John Thorpe, Senior Broker

Oil took another $3 .40 nosedive when OPEC announced a smaller than expected demand growth forecast for 2025 for the Third time!

Updated: October 14, 2024 8:43 am

For the third time OPEC slashed its 2024 and 2025 worldwide crude oil demand growth rate. This year’s demand was lowered to 1.93 mln bpd, down from last month’s projection at 2.03 mln mt. Analysts noted much the downgrade came from lower expected Chinese demand. Next year’s demand growth is seen at 1.64 mln bpd down from 1.74 mln bpd previously forecast.


Flirting with the low end of the 25 month old range, November crude held it’s ground around $69.75/bbl level , a mere 3 dollars from the springtime 2023 lows.

Equity markets were upset by poor United healthcare Group end of year Guidance although they beat EPS estimates, Buy the rumor sell the fact? UNH shares down 48.25 per share or nearly 8%.

Metals cruised higher today with the CME FedWatch tool reflecting a solid 90% chance the FED will lower rates .25-50 in its November meeting is again fueling speculative buying in the Yellow Metal.

The All time high in the December contract is 2708.70 , are we flirting with that number?, yes, as of this writing GCZ24 is @ 2678.00 can we take that out? Stay tuned…

Sympathetic Silver is recouping it’s bullish stance, 1.80 away from it’s contract high @ 31.70 /oz +.37 for the day


Watch Tomorrow’s Movers and Shakers:

No Fed Speakers, No Economic Data, very few ,if any earnings that would make headlines.

Ask a Broker: What is Futures Margin?

thumbnail?url=https%3A%2F%2Fi.ytimg.com%2Fvi%2F2VQwRHHIQ8Y%2Fhqdefault

stars
 

Daily Levels for Oct. 16th 2024

4005bd53 e4c8 42e2 9e19 3f20e644a198

Economic Reports
provided by:ForexFactory.com
All times are Eastern Time ( New York)
43ff99a5 90d3 4f0f a09a 9563cfd37ec9
Good Trading!
About: Cannon Trading is an independent futures brokerage firm established in 1988 in Los Angeles. Our mission is to provide reliable service along with the latest technological advances and choices while keeping our clients informed and educated in the field of futures and commodities trading.
Trading Futures, Options on Futures, and retail off-exchange foreign currency transactions involves substantial risk of loss and is not suitable for all investors. You should carefully consider whether trading is suitable for you in light of your circumstances, knowledge, and financial resources. You may lose all or more of your initial investment. Opinions, market data, and recommendations are subject to change at any time.
Contact
S
Cannon Trading Company
12100 Wilshire Boulevard
Suite 1640
Los Angeles, CA 90025
(800) 454-9572
Follow Us
Facebook  Twitter  Instagram
Visit Our Website


Fed Easing Cycle Fuels Market Rally Amid Earnings Season and Economic Uncertainty

Join our Private Facebook group

Subscribe to our YouTube Channel

Listen to our podcast: Subscribe on AppleSpotify, Amazon, or wherever you listen to podcasts!

C89

The FED is your friend…..

14 October 2024

By GalTrades.com

The FED is your friend plus the trend is your friend. The Federal Reserve is in an easing cycle which is a positive for the markets. I would like to see that trend continue and there be no change in the Fed’s stance, we don’t want to see economic reports which would hint at inflation creeping back up. Federal Reserve officials debated whether to lower interest rates by a quarter or half of a percentage point last month. Almost all participants agreed that the upside risks to inflation had diminished, and most remarked that the downside risks to employment had increased. Inflation is broadly trending down. Markets had to digest a warmer-than-expected CPI report and a one-year high print in initial claims, rising geopolitical risks, along with higher oil prices and yields, yet stocks have been able to make new highs.

With markets at all-time highs, earnings season can be a boost or a test of lower support zones. All eyes will be on the earnings numbers and what executives have to say about their outlooks. In the week ahead, a number of influential companies are set to report. While the trend in stocks remains bullish, the environment is not without its risks and valuation is full. The forward P/E on the S&P 500 currently stands at roughly 22 versus the 10-year average of 17.7, per FactSet. Elevated valuation is largely driven by expectations for strong earnings growth and easing monetary policy from the Federal Reserve. Therefore, Q3 earnings season, which unofficially kicked off, will likely need to deliver strong results to keep this bull market going. High earnings valuations are fully priced in this growth story, any miss on overall earnings can generate a valuation re-set and a pullback. I would also like to look at Thursday’s Retail Sales report. The last couple of Retail Sales reports have been stronger than expected, so this data point will provide a good read on the state of the U.S. consumer. Friday CNBC/NRF Retail Monitor showed a 0.3% month/month drop in consumer spending, which could suggest a soft Retail Sales report. If so, this could be enough to trigger a profit-taking pullback in stocks.

If NVDA can obtain a new all-time high, or the small cap’s Russell can break out to fresh two-year highs next week, these would likely be near-term bullish catalysts. I would like to see a continuation of the uptrend; However, I am very cautious as any negative news from earnings or the retail’s report can change the momentum until the next catalyst.

S&P fifth straight weekly gain. The market is hitting this level without much help from tech stocks and the Magnificent 7 as the rally broadens out to the financials in response to positive third-quarter numbers from Wells Fargo, JPMorgan, and BlackRock.

Multiples are high and portfolio managers are saying they’re uncomfortable buying at these levels, but there is a lot of money coming in from the sidelines therefore they feel that they have to participate. The index level feels expensive as well, I hear analysts are looking for mid cap size companies.

Banks delivered earnings on Friday and their prices went up, which is a good start for earnings season. Year to date; JPM is up 31%, C 28%, GS 33%, BAC 25%, WFC 24%. That’s higher than the S&P YTD.

Cybersecurity: is making new highs, see ETF – BUG.

Money is coming out of China-related stocks on some disappointment around stimulus. Those dollars are rotating out of China tech names such as Alibaba and moving into the U.S. tech giants.

Bond yields rose this week, primarily driven by the warmer-than-expected inflation data. Two-year Treasury yields increased to 3.955% from 3.923% while 10-year yields tacked on roughly 10 basis points to 4.085% from 3.981%

Earnings & Economic reports this week: Monday, Oct.14: Charles Schwab (SCHW)

Tuesday, Oct. 15: Walgreens Boots Alliance(WBA), UnitedHealth (UNH), Citigroup (C), Bank of America (BAC), Johnson & Johnson (JNJ) and Goldman Sachs (GS) United Airlines (UAL), Interactive Brokers (IBKR) and JB Hunt(JBHT) Interactive Brokers Group Inc. (IBKR), Omnicom Group Inc. (OMC), J.B. Hunt Transport Services (JBHT)

Wednesday, Oct.16: Morgan Stanley (MS), Abbott Labs (ABT), ASML (ASML), US Bancorp (USB), Citizens (CFG) and Prologis (PLD) Alcoa (AA), PPG Industries(PPG), CSX (CSX), Kinder Morgan (KMI), Discover (DFS) and Crown Castle (CCI) Discover Financial Services (DFS), Equifax Inc. (EFX)

Thursday, Oct. 17: Initial Jobless Claims, Retail Sales, Industrial Production & Capacity Utilization

Taiwan Semi (TSM), Travelers (TRV), Elevance (ELV), Huntington Bancshares (HBAN), Blackstone (BX), Truist (TFC) and KeyCorp(KEY) Netflix (NFLX), Intuitive Surgical (ISRG) and Crown Holdings (CCK) Elevance Health Inc. (ELV), Travelers Companies Inc. (TRV),

Friday, Oct. 18: Housing Starts & Building Permits. American Express (AXP), SLB (SLB) and Procter & Gamble (PG) Fifth Third Bancorp (FITB), Regions Financial Corp. (RF), Ally Financial Inc. (ALLY), Comerica Inc. (CMA),

Technical Analysis:

While the SPX and DOW made new all-time highs, the Nasdaq 100 did not. But it continued to trend higher this week and is on pace to close less than 2% below the all-time closing high of 20,675, hit back on July 10th. If Nvidia sets fresh all-time highs this could signal to markets that the AI trade is alive and well and should help the NASDAQ, but other AI plays are trading well as well, such as ORCL, AVGO, PLTR.

Small caps: the Russell is heavily weighted on regional banks and health care. The Russell 2000 was the relative outperformer Friday (+1.64%), assisted by several strong earnings reports out of the financial sector Friday. The index trading range is roughly 2,050-2,260. If the Index can notch a fresh two-year closing high this could send a bullish technical signal to the markets that small caps are finally ready to join the party.

Market breadth:closed out the week strongly, with roughly 75% of SPX components trading above their respective 200-day moving averages. No change in market breadth. On a week-over-week basis, the SPX) breadth ticked down to 75.75% from 76.35%, the CCMP ticked up to 44.66% from 44.09%, and the RTY is flat at 55.87% from 55.76%.

Overseas: rates are in the news ahead of the European Central Bank’s (ECB) decision Thursday. The ECB has cut rates twice in 2024, and analysts expect a third one next week and a fourth in December, Reuters reported.

Bonds: Economy defies gravity, sending bond yields higher. The U.S. economy continues to defy expectations by growing faster than expected. Despite all of the constraints —tightening Federal Reserve monetary policy, weak global growth, wars in the Middle East and Ukraine, and low consumer confidence. GDP growth has been running at about a 3% annualized pace over the past four quarters. The major driver behind the growth is consumer spending. Supported by steady job and income growth, consumers are spending at a pace that is keeping the economy buoyant. In the Treasury bond market, yields, which generally move inversely to prices, have rebounded on these signs of strength.

XLK, XLI, XLF, MAGS, KRE, IJR, MSFT, NVDA, ORCL, IBM, CSCO, MU, DELL, CMG, WFC, BLK, GS, EBAY, VRT, ABNB, PINS, OGN, GOOGL, NXT, MBLY, FROG, AFRM, PANW, CRWD, GXO, HD, CLF, GLW, LEVI, DD.

What stands out to me: ever since the Microsoft Constellation energy deal, I have been looking for plays in the Energy sector particularly in nuclear power plants. Listen to Brad Gerstner podcast on BG2. I welcome any insight and news on the subject from any of you.

futures I am watching this week:

Have an amazing week.

The outlook contained in this article are of opinion only and do not guarantee any profits. Futures trading is risky and suitable for everyone.

stars
68718841 fc35 4e2f 8427 f9926ab6a4f2


Daily Levels for Oct. 15th 2024

bbd27db3 8672 451b bbec f14e2a4f7783

Economic Reports
provided by: ForexFactory.com
All times are Eastern Time ( New York)
8710c1cf 3ba9 4dab 8d79 ea903065557b
Good Trading!
About: Cannon Trading is an independent futures brokerage firm established in 1988 in Los Angeles. Our mission is to provide reliable service along with the latest technological advances and choices while keeping our clients informed and educated in the field of futures and commodities trading.
Trading Futures, Options on Futures, and retail off-exchange foreign currency transactions involves substantial risk of loss and is not suitable for all investors. You should carefully consider whether trading is suitable for you in light of your circumstances, knowledge, and financial resources. You may lose all or more of your initial investment. Opinions, market data, and recommendations are subject to change at any time.
Contact
S
Cannon Trading Company
12100 Wilshire Boulevard
Suite 1640
Los Angeles, CA 90025
(800) 454-9572
Follow Us
Facebook  Twitter  Instagram
Visit Our Website


Weekly Newsletter: Free Trial to Advanced Daily Market Insight + Trading Levels for Oct. 14th

Get Real Time updates and more by joining our Private Facebook Group!
Subscribe to our YouTube Channel

Crude Oil2

Cannon Futures Weekly Letter Issue # 1212

In this issue:

  •  Important Notices – Quiet Reports Week & Iran/Israel in background
  • Futures 101 – Advanced Market Insight – Free trial
  • Hot Market of the Week – December Heating Oil
  • Broker’s Trading System of the Week – Unleaded Swing Trading System
  • Trading Levels for Next Week
  • Trading Reports for Next Week


Important Notices – Next Week Highlights:


The Week Ahead

By John Thorpe, Senior Broker


A relatively Quiet Data week next week, Geopolitics may be the only driver of volatility. One Caveat: the Fed Speakers dialogue may be given much more weight by investors as there will be a lot less noise in the form of Economic Data and earnings from prominent “Magnificent Seven” stocks to drive market volatility.


Prominent Earnings this Week:

  • Tues, pre-open United Healthcare, B Of A, Goldman Sachs, Citi Group, Johns and Johnson
  • Wed. Abbott Labs,
  • Thu. NetFlix Post-Close


FED SPEECHES:

  • Mon. Kashkari, Waller, 2nd Kashkari.
  • Tue. Kugler, Bostic
  • Wed. QUIET
  • Thu. QUIET
  • Fri. Bostic, Waller, Kashkari, Bostic


Big Economic Data week:

  • Mon. BANKS CLOSED-Columbus Day National Holiday
  • Tues. Quiet
  • Wed. Quiet
  • Thur. Bus. Inventories, Jobless Claims.
  • Fri. Housing Starts, Building Permits


546fa316 68cc 4c71 a531 5773fea57f29

Would you like to have access to research like shown above and MORE?

Here is what you will receive DAILY:

  • Specific price points for shorter term, medium term and longer term
  • Detailed chart analysis
  • Audio brief summary as well as more detailed PDF summary
  • View insight into Gold, Mini SP, Crude Oil, Corn, feeder Cattle, Live Cattle, Wheat, Hogs and more!

To sign up and get two weeks FULL access, start by requesting the free trial below.

START YOUR FREE TRIAL


stars

3b644da2 2bee 4d39 8d98 5208a20bec39


    • Hot Market of the Week – Heating Oil

    Hot market of the week is provided by QT Market Center, A Swiss army knife charting package that’s not just for Hedgers, Cooperatives and Farmers alike but also for Spread traders, Swing traders and shorter time frame application for intraday traders with a unique proprietary indicator that can be applied to your specific trading needs.

    FREE TRIAL AVAILABLE

    December Heating Oil

    December heating oil Rallied to its second upside PriceCount objective before correcting. At this point if the chart can resume its rally with new sustained highs, the 3rd count would project a possible run into the 2.59 area


    PriceCounts – Not about where we’ve been , but where we might be going next!

    2960fbfb a36b 4ef6 b97f 46dc9fa94e2d

The PriceCount study is a tool that can help to project the distance of a move in price. The counts are not intended to be an ‘exact’ science but rather offer a target area for the four objectives which are based off the first leg of a move with each subsequent count having a smaller percentage of being achieved. It is normal for the chart to react by correcting or consolidating at an objective and then either resuming its move or reversing trend. Best utilized in conjunction with other technical tools, PriceCounts offer one more way to analyze charts and help to manage your positions and risk. Learn more at www.qtchartoftheday.com
Trading in futures, options, securities, derivatives or OTC products entails significant risks which must be understood prior to trading and may not be appropriate for all investors. Past performance of actual trades or strategies is not necessarily indicative of future results.

   Broker’s Trading System of the Week

With algorithmic trading systems becoming more prevalent in portfolio diversification, the following system has been selected as the broker’s choice for this month.

Swing61B Cont v.3 _ RBOB Gasoline

PRODUCT

RB – RBOB ( unleaded gasoline)


SYSTEM TYPE

Swing Trading


Recommended Cannon Trading Starting Capital

$25,000


COST

USD 160 / monthly


Get Started

Learn More

5f9b5881 1752 49dc 95f0 3ab2d92e166d

The performance shown above is hypothetical in that the chart represents returns in a model account. The model account rises or falls by the average single contract profit and loss achieved by clients trading actual money pursuant to the listed system’s trading signals on the appropriate dates (client fills), or if no actual client profit or loss available – by the hypothetical single contract profit and loss of trades generated by the system’s trading signals on that day in real time (real‐time) less slippage, or if no real time profit or loss available – by the hypothetical single contract profit and loss of trades generated by running the system logic backwards on back adjusted data. Please read full disclaimer HERE.
Would you like to receive daily support & resistance levels?
Yes
S
No
S

Daily Levels for October 14th, 2024

4665eb8e 27be 4d9d a498 e0ea47acdd3b

Weekly Levels for the week of October 14th, 2024

37fa4fc7 9ae8 470e 8c34 4cf8ff625565


bf9b3e0d 9c23 44e8 980c a8c01bfbe2cf

Trading Reports for Next Week

First Notice (FN), Last trading (LT) Days for the Week:
974e5421 d431 409b b871 f3083977d92a

Improve Your Trading Skills

Get access to proprietary indicators and trading methods, consult with an experienced broker at 1-800-454-9572.

Explore trading methods. Register Here

* This is not a solicitation of any order to buy or sell, but a current market view provided by Cannon Trading Inc. Any statement of facts here in contained are derived from sources believed to be reliable, but are not guaranteed as to accuracy, nor they purport to be complete. No responsibility is assumed with respect to any such statement or with respect to any expression of opinion herein contained. Readers are urged to exercise their own judgement in trading.

Quick Videos on Trading Techniques + Futures Trading Levels for 9.25

Get Real Time updates and more by joining our Private Facebook Group! Subscribe to our YouTube Channel Listen to our Market Recap Podcasts on Apple Podcasts
C37
 

Trading Videos

Instant Viewing

Watch a series of short videos, where our VP, Ilan Levy-Mayer shares his personal preferences and opinions on different trading topics.

  • Ever wondered when to exit a trade? Take a look at what Ilan has to share on Bollinger Bands and a study called PARABOLICS
  • Some common uses you can make of support and resistance levels.
  • Filter out the noise with range bar charts
  • “Price Confirmation”

WATCH NOW

 
stars
     

Daily Levels for September 26, 2024

1088a659 e5de 42bc 8e24 66ef19a6e359 Economic Reports provided by: ForexFactory.com All times are Eastern Time ( New York)
f631f965 3216 44b0 a79b df7a62871290

Improve Your Trading Skills

Get access to proprietary indicators and trading methods, consult with an experienced broker at 1-800-454-9572. Explore trading methods. Register Here
3b644da2 2bee 4d39 8d98 5208a20bec39
* This is not a solicitation of any order to buy or sell, but a current market view provided by Cannon Trading Inc. Any statement of facts here in contained are derived from sources believed to be reliable, but are not guaranteed as to accuracy, nor they purport to be complete. No responsibility is assumed with respect to any such statement or with respect to any expression of opinion herein contained. Readers are urged to exercise their own judgement in trading.   #Equities, #Consolidation phase, #Interest rates, #Precious metals, #Gold, #Silver, #US Dollar, #Crude oil prices, #HurricaneHelene, #Middle East tensions, #Chinese stimulus, #Redbook US Retail Sales, #Case Schiller US Metro-Area Home Prices, #Richmond Fed Manufacturing Index, #Service Sector Index, #Consumer Confidence, #New Home Sales, #Micron Technology

Market Movers: Precious Metals Surge, Dollar Slides, and New Home Sales September 25th 2024

Get Real Time updates and more by joining our Private Facebook Group!

Subscribe to our YouTube Channel

Listen to our Market Recap Podcasts on Apple Podcasts


C65


Movers and Shakers

By John Thorpe, Senior Broker   With Equities quietly trading in a consolidation phase, Interest rates following, the precious metals ,once again found footing and surprised many traders with their mid-day upside move, Gold higher by $36.00 @ 2689.00, Silver up $1.50 into the $32.50 /Troy OZ range..  The US Dollar @ 100.10 continuing it’s 2.5 month long slide, flirting with 14 month lows of 99.22. Metals should gain additional strength if the dollar falls below that number on a closing basis.   Todays Headlines   Updated: September 24, 2024 6:12 am Churning hurricane threatening US production, continued Middle East tensions, and Chinese stimulus measures have helped crude oil prices trade higher on Tuesday.   Updated: September 24, 2024 7:00 am China’s central bank announced its largest stimulus measures since the pandemic. The bank will lower interest rates and additional funding. However, analysts say very week consumer and business demand for credit will have little response to lower interest rates, and the lack of fiscal stimulus measures will leave the central bank’s response to fall short of jump starting the economy and beating back deflationary environment.   Updated: September 24, 2024 7:55 am Redbook Weekly US Retail Sales Headline Recap   **Redbook Weekly US Retail Sales were +5.2% in the first three weeks of September 2024 vs September 2023 **Redbook Weekly US Retail Sales were +4.4% in the week ending September 21 vs yr ago week   Updated: September 24, 2024 8:00 am Case Schiller 20 US Metro-Area Home Prices Recap   **Case Schiller 20 US metro area home prices for July Y/Y: +5.9% from the year ago month **Case Schiller 20 US metro area home prices for July M/M: +0.01% vs prior month   Updated: September 24, 2024 9:02 am Richmond Fed Manufacturing Index Headline Recap   **Richmond Fed September Manufacturing Index: -21.0 ; prior -19.0 **Richmond Fed September Manufacturing Shipments Index: -18.0 ; prior -15.0 **Richmond Fed September Manufacturing New Orders: -23.0 ; prior -26.0 **Richmond Fed September Manufacturing Employees: -22.0 ; prior -15.0 **Richmond Fed September Manufacturing Prices Paid: +3.36 ; prior +2.45 **Richmond Fed September Manufacturing Prices Received: +1.57 ; prior +1.87   **Richmond Fed September Service Sector Index:-1.0 ; prior -11.0 Updated: September 24, 2024 9:09 am Conference Board Consumer Confidence, Present Situation, Expectations Index Headline Recap   **Conference Board September Consumer Confidence Index: 98.7 ; prior revised to 105.6 from 103.3 ; expected 102.8 **Conference Board September Consumer Present Situation Index: 124.3 ; prior revised to 134.6 from 134.4 **Conference Board September Consumer Expectations Index: 81.7 ; prior revised to 86.3 from 82.5   Tomorrows Movers and Shakers New Home Sales Released On 9/25/2024 10:00:00 AM For Aug, 2024   d5630393 2c73 4ce0 b0be 7493161efe7b   US new home sales data for June will be updated Wednesday morning at 9:00 am CT. Analysts expect new home sales month-to-month at a 0.640 mln unit annualized pace, up +3.4%. The prior month’s sales were -11.3% at 0.619 mln unit annual rate.   Micron Technology reports after the close  

stars


Daily Levels for September 25, 2024


Economic Reports

provided by: ForexFactory.com

All times are Eastern Time ( New York)

ee47eb0e affe 407f b7b1 18190dc7ce36

Improve Your Trading Skills

Get access to proprietary indicators and trading methods, consult with an experienced broker at 1-800-454-9572.

Explore trading methods. Register Here

3b644da2 2bee 4d39 8d98 5208a20bec39

* This is not a solicitation of any order to buy or sell, but a current market view provided by Cannon Trading Inc. Any statement of facts here in contained are derived from sources believed to be reliable, but are not guaranteed as to accuracy, nor they purport to be complete. No responsibility is assumed with respect to any such statement or with respect to any expression of opinion herein contained. Readers are urged to exercise their own judgement in trading.


#Equities, #Consolidation phase, #Interest rates, #Precious metals, #Gold, #Silver, #US Dollar, #Crude oil prices, #HurricaneHelene, #Middle East tensions, #Chinese stimulus, #Redbook US Retail Sales, #Case Schiller US Metro-Area Home Prices, #Richmond Fed Manufacturing Index, #Service Sector Index, #Consumer Confidence, #New Home Sales, #Micron Technology