Using Range Bar and Volume Charts for Scalping 7-20-2016

Connect with Us! Use Our Futures Trading Levels and Economic Reports RSS Feed.

Like us on FacebookFollow us on TwitterView our profile on LinkedInFind us on Google+Cannon Trading Futures Trading Resistance & Support Levels and Economic ReportsFind us on Yelp

1. Market Commentary
2. Futures Support and Resistance Levels – S&P, Nasdaq, Dow Jones, Russell 2000, Dollar Index
3. Commodities Support and Resistance Levels – Gold, Euro, Crude Oil, T-Bonds
4. Commodities Support and Resistance Levels – Corn, Wheat, Beans, Silver
5. Futures Economic Reports for Wedneday July 20, 2016

Hello Traders,

Why I Like to Use Tick and Volume Charts for Scalping

Today, I decided to touch more on an educational feature rather than provide a certain market outlook.

Many of my clients and blog readers know that when it comes to short-term trading I am a fan of using volume charts, tick charts, range bar charts and Renko charts rather than the traditional time charts like the 1 minutes, 5 minutes etc.

My rule of thumb is that if you as a trader who makes decisions based on charts that are less than 15 minutes time frame, it may be worth your time to research, back test and do some homework as to potentially using other type of charts like volume charts, Range charts etc.

Volume charts will draw a new bar once a user defined number of contracts traded. An example is the mini SP 10,000 volume chart which will draw a new bar once 10,000 contracts are traded.

Range bar charts will draw new charts once price action has exceeded a user’s pre-defined price or ticks range. An example might be an 18 ticks range bar chart on crude oil.

While volume charts rely ONLY on volume, the range bar charts rely ONLY on price action.

Their main advantage over traditional time charts is twofold in my opinion:

If the market is moving fast, reports have come out or there is heavy volume in the market, the traditional 5 minute chart will need 5 minutes to complete the next bar before it provides you with a signal…if you have day traded futures before you know what 5 minutes can do to these markets….The volume charts or range bar charts in this case will complete the bars MUCH faster because there is strong price action and strong volume and will be able to provide a signal faster than the time charts. Continue reading “Using Range Bar and Volume Charts for Scalping 7-20-2016”

Gold Chart for Review 7.06.2016

Connect with Us! Use Our Futures Trading Levels and Economic Reports RSS Feed.

Like us on FacebookFollow us on TwitterView our profile on LinkedInFind us on Google+Cannon Trading Futures Trading Resistance & Support Levels and Economic ReportsFind us on Yelp

1. Market Commentary
2. Futures Support and Resistance Levels – S&P, Nasdaq, Dow Jones, Russell 2000, Dollar Index
3. Commodities Support and Resistance Levels – Gold, Euro, Crude Oil, T-Bonds
4. Commodities Support and Resistance Levels – Corn, Wheat, Beans, Silver
5. Futures Economic Reports for Wednesday July 6, 2016

Hello Traders,

We got both ECB Draghi speaking tomorrow morning as well as FOMC minutes later in the day. Could turn out to be a volatile trading day.

There are a few factors you can control as a day trader:

How many contracts you trade per ticket?

How many markets you trade at any given time?

What is your ( hopefully ) self imposed risk per trade? per day?

These factors should be adjusted as your trading capital change, as volatility increases/ decreases and according to your performance.

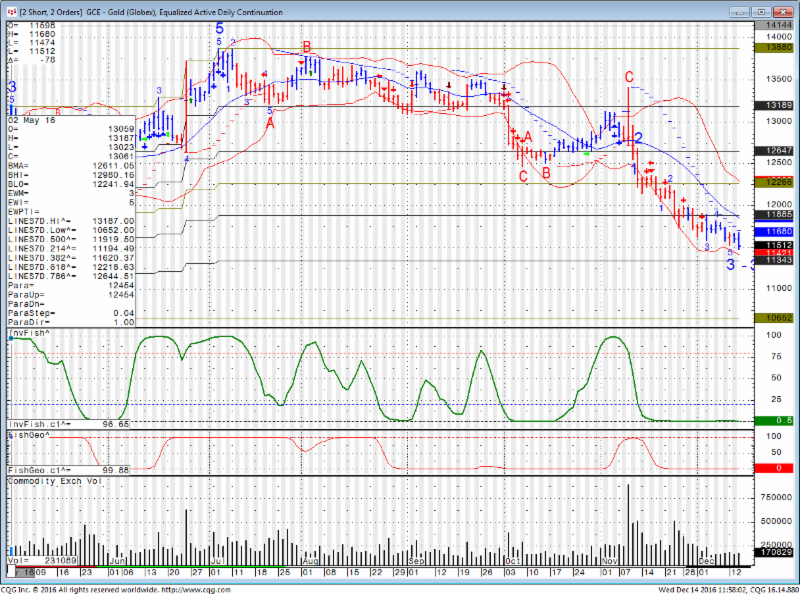
Gold chart for your review below:

Gold Chart

Continue reading “Gold Chart for Review 7.06.2016”

4th of July Futures Trading Schedule 7.01.2016

Connect with Us! Use Our Futures Trading Levels and Economic Reports RSS Feed.

Like us on FacebookFollow us on TwitterView our profile on LinkedInFind us on Google+Cannon Trading Futures Trading Resistance & Support Levels and Economic ReportsFind us on Yelp

1. Market Commentary
2. Futures Support and Resistance Levels – S&P, Nasdaq, Dow Jones, Russell 2000, Dollar Index
3. Commodities Support and Resistance Levels – Gold, Euro, Crude Oil, T-Bonds
4. Commodities Support and Resistance Levels – Corn, Wheat, Beans, Silver
5. Futures Economic Reports for Friday July 1, 2016

Hello Traders,

4th of July Trading Schedule:

Please have a Safe and Happy Holiday!!

From the CME Globex Control Center, here is the summary of KEY changes, per CME market segment –

Friday – ALL REGULAR closes

Sunday night – NORMAL OPEN times for all markets, EXCEPT grains and meats = remain closed.

Monday – ALL open markets go into HALT at 12:00 noon

– (except grains and meats = stay closed)

Monday night – NORMAL OPEN times – (except grains and meats = stay closed)

Tuesday morning – grains and meats pre-open 6:00 am, OPEN at 8:30 am

Independence Day Holiday Schedule 2016

Continue reading “4th of July Futures Trading Schedule 7.01.2016”

FOMC + Futures Levels & Economic Reports for June 15th 2016

Connect with Us! Use Our Futures Trading Levels and Economic Reports RSS Feed.

Like us on FacebookFollow us on TwitterView our profile on LinkedInFind us on Google+Cannon Trading Futures Trading Resistance & Support Levels and Economic ReportsFind us on Yelp

1. Market Commentary
2. Futures Support and Resistance Levels – S&P, Nasdaq, Dow Jones, Russell 2000, Dollar Index
3. Commodities Support and Resistance Levels – Gold, Euro, Crude Oil, T-Bonds
4. Commodities Support and Resistance Levels – Corn, Wheat, Beans, Silver
5. Futures Economic Reports for Wednesday June 15, 2016

Hello Traders,

Cannon Trading’s new eBook

FRONT MONTH for STOCK INDEX, CURRENCIES and FINANCIALS is September!!

The FOMC interest rate decision is due at 2:15 ET in the US tomorrow ( Wednesday, June 15th ). Also more than a few economic numbers ahead of the announcement.

FOMC days have different characteristics than other trading days. If you have traded for a while, check your trading notes from past FOMC days that may help you prepare for tomorrow.

if you are a newcomer, take a more conservative approach and make sure you understand that the news can really move the market.

The following are suggestions on trading during FOMC days:

  • Reduce trading size
  • Be extra picky = no trade is better than a bad trade
  • Choose entry points wisely. Look at longer time frame support and resistance for entry. Take the approach of entering at points where you normally would have placed protective stops. Example, trader x looking to go long the mini SP at 2065.00 with a stop at 2059.00, instead “stretch the price bands” due to volatility and place an entry order to buy at 2059.75 and place a stop a few points below in this hypothetical example.
  • Expect the higher volatility during and right after the announcement
  • Expect to see some “vacuum” ( low volume, big zigzags) right before the number.
  • Consider using automated stops and limits attached to your entry order as the market can move very fast at times.
  • Know what the market was expecting, learn what came out and observe market reaction for clues
  • Be patient and be disciplined

Continue reading “FOMC + Futures Levels & Economic Reports for June 15th 2016”

iSystems: Plataformas de sistemas comerciale Levels and Reports 5.27.2016

Connect with Us! Use Our Futures Trading Levels and Economic Reports RSS Feed.

Like us on FacebookFollow us on TwitterView our profile on LinkedInFind us on Google+Cannon Trading Futures Trading Resistance & Support Levels and Economic ReportsFind us on Yelp

1. Market Commentary
2. Futures Support and Resistance Levels – S&P, Nasdaq, Dow Jones, Russell 2000, Dollar Index
3. Commodities Support and Resistance Levels – Gold, Euro, Crude Oil, T-Bonds
4. Commodities Support and Resistance Levels – Corn, Wheat, Beans, Silver
5. Futures Economic Reports for Friday May 27, 2016

Hello Traders,

For 2016 I would like to wish all of you discipline and patience in your trading!

Voted #1 futures trading blog!  

Dear Traders,

We are excited to announce that our new technology, iSystems is now available in Spanish!

This cutting edge platform allows you to browse, filter, select, monitor and when ready trade live many different systems based on different, tested algorithms.

We will be happy to assist or answer any questions.

Start your journey now! https://cannon.isystems.com 

Estimado Comerciante,

Estamos muy contentos de anunciar que nuestra nueva tecnologia de , Systems, ahora disponible en espanol !

Esta plataforma de vanguardia le permite navegar , filtrar , seleccionar,

controlar y , cuando este listo, podra comprar y vender en  vivo en linea
bajo varios sistemas basados en diferentes algoritmos comprobados.

Estaremos encantados de ayudarle o responder a cualquier pregunta .

Comience  ahora!  https://cannon.isystems.com 

Trading ALGOS free trial 5.26.2016

Connect with Us! Use Our Futures Trading Levels and Economic Reports RSS Feed.

Like us on FacebookFollow us on TwitterView our profile on LinkedInFind us on Google+Cannon Trading Futures Trading Resistance & Support Levels and Economic ReportsFind us on Yelp

1. Market Commentary
2. Futures Support and Resistance Levels – S&P, Nasdaq, Dow Jones, Russell 2000, Dollar Index
3. Commodities Support and Resistance Levels – Gold, Euro, Crude Oil, T-Bonds
4. Commodities Support and Resistance Levels – Corn, Wheat, Beans, Silver
5. Futures Economic Reports for Thursday May 26, 2016

Hello Traders,

For 2016 I would like to wish all of you discipline and patience in your trading!

Voted #1 futures trading blog!  

Trading Algos

What are the trading algos?

Through my job as a broker I have spent 100’s of hours researching the markets in attempt to gain an “edge” and be able to assist my clients better. The results are a family of studies and trading conditions I programed and tested, that i feel comfortable using to analyze the markets. I use my ALGO’s in different ways in the trading program REN18 and I use them also when looking at the markets in different time frames.

Obviously there is more to trading than just studies. There is trade management, entry and exit techniques, fear and greed and much more….but I hope that you can evaluate the studies/ ALGOs and decide if it can be of help in your trading.

I currently have 3 main ALGOS I use in my managed accounts and offer for clients to use either with E-Futures, Sierra charts or CQG charts ( both CQG IC and CQG Q trader) – all charting packages offers free trial.

Diamonds: DIAMONDS are an algorithm I came up with as I was designing different trading systems. It is a proprietary algorithm that tries to measure exhaustion in selling or buying and possible chance of short term reversal. The ALGO calculates recent highs/lows, consecutive highs/lows, RSI, volatility and then the formula outputs; a number that either meet certain criteria or not. RED diamonds suggest possible short term top. Green or blue diamonds suggest possible short term bottoms. Like any other indicator, trading strategy, we simply don’t know what the future will bring, in our case the next few minutes, sometimes seconds…hence the use of the term “suggested”.

ILM: ILM produces arrows on the charts that signal potential change in direction/ momentum. The ILM is based on moving average, volatility system and momentum.

F50: The F50 tries to measure institutional activity that may lead to continued momentum within larger time frame. It looks for correlation with volatility systems and attempts to sense possible continuation of immediate trend.

I like to use my studies and ALGOS on either volume and range bar charts when it comes to short term trading and 15 minutes, hourly and daily charts when it comes to longer term day trading as well as swing trading.