Gold Outlook + Futures Trading Levels for April 2, 2024

Get Real Time updates and more by joining our Private Facebook Group!
Subscribe to our YouTube Channel


C35


First Week of Q2!

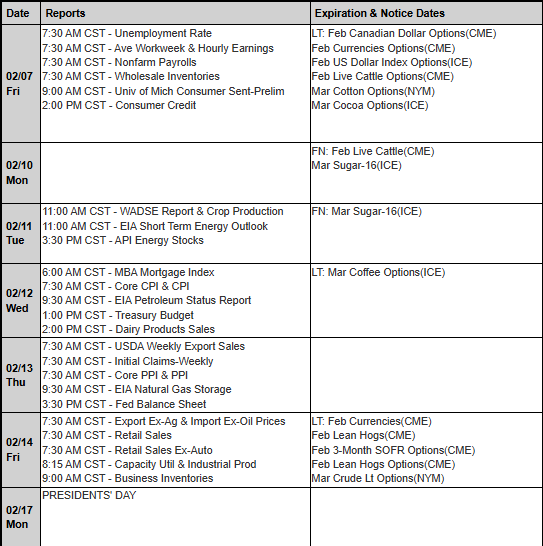
  • Heavy Fed Speeches, 19 Count ’em, Tuesday thru Friday with JPowell on Wednesday @ 11:10 a.m. CDT from Stanford.
  • Earnings season will officially begin the middle of April.
  • Economic Data Highlights : Jobless Claims early Thursday and NonFarm Payrolls headline Friday pre-opening
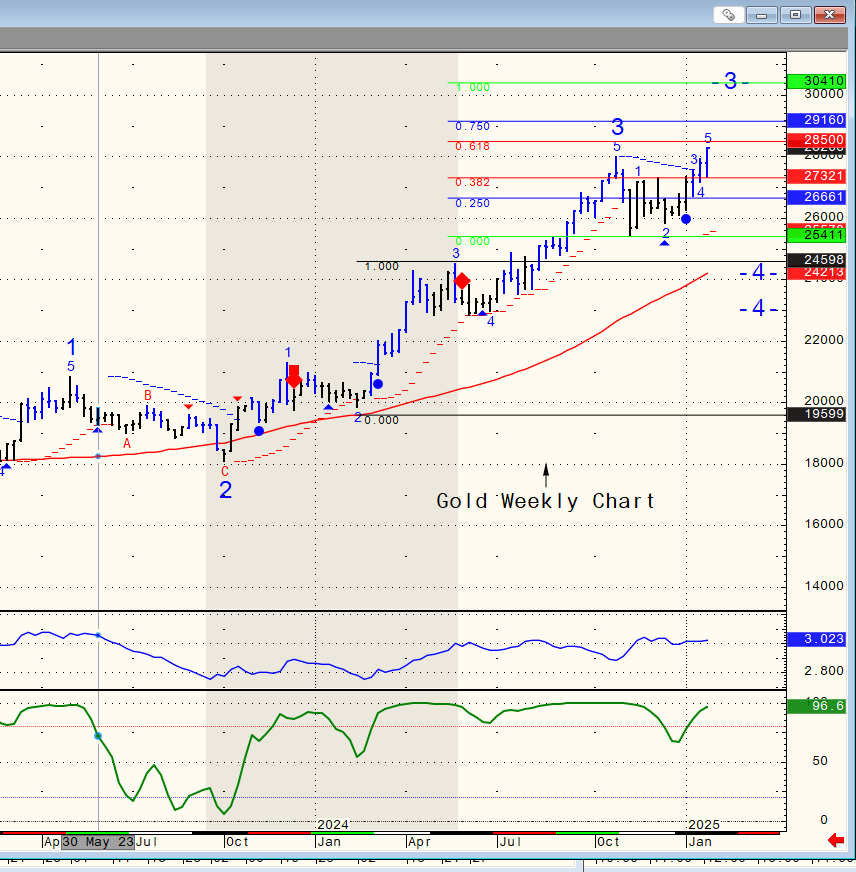
  • Gold Chart for your viewing below


9d030a51 bab9 46e6 89ea f013c8027406


4ee7278b 3e12 4019 8b79 e3382861f0be

Plan your trade and trade your plan


stars

e35cb555 9ff3 4f00 9fe8 0655b28fbd90

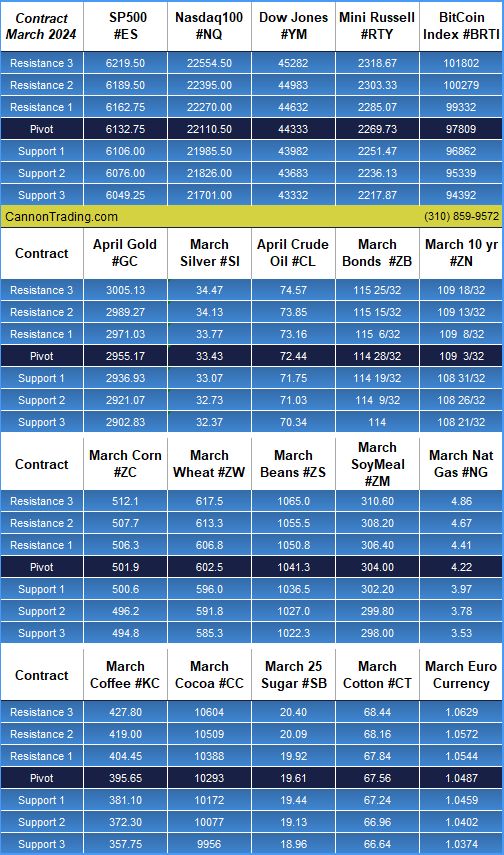
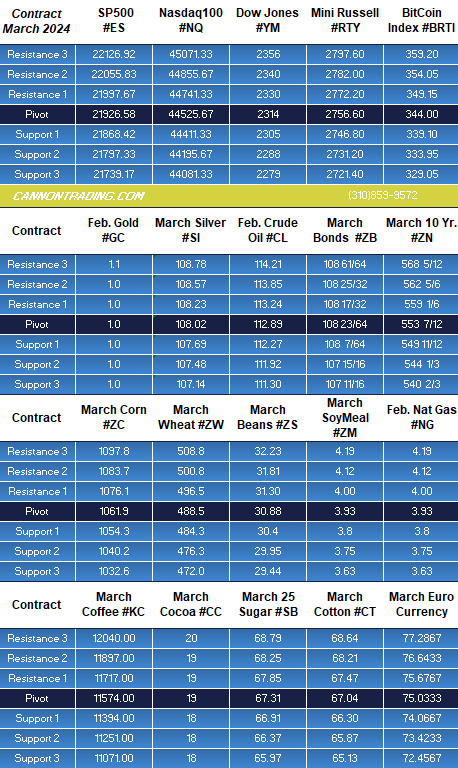
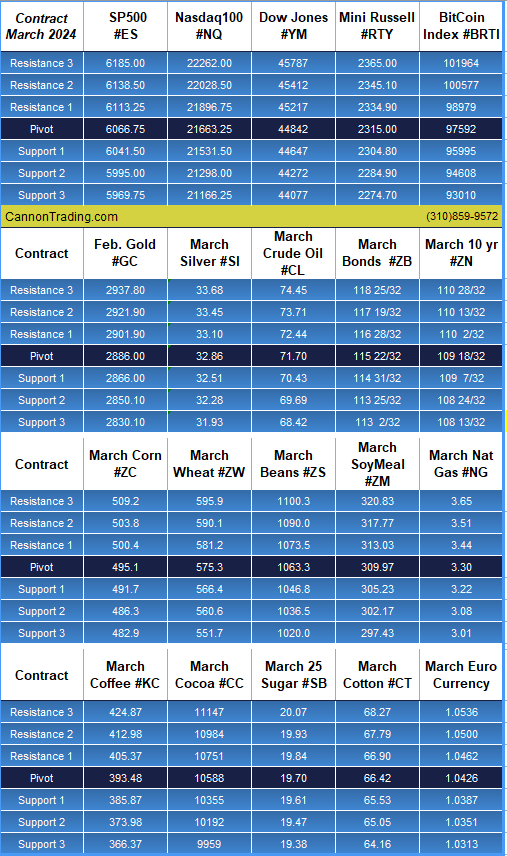
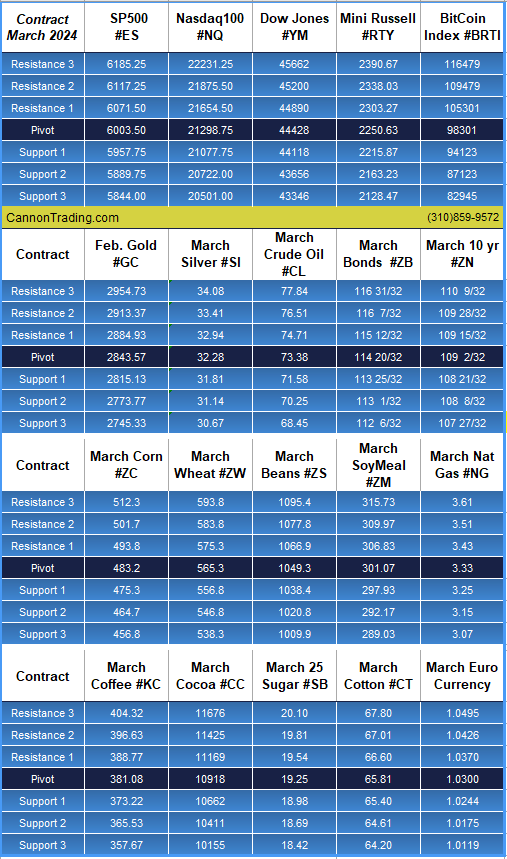
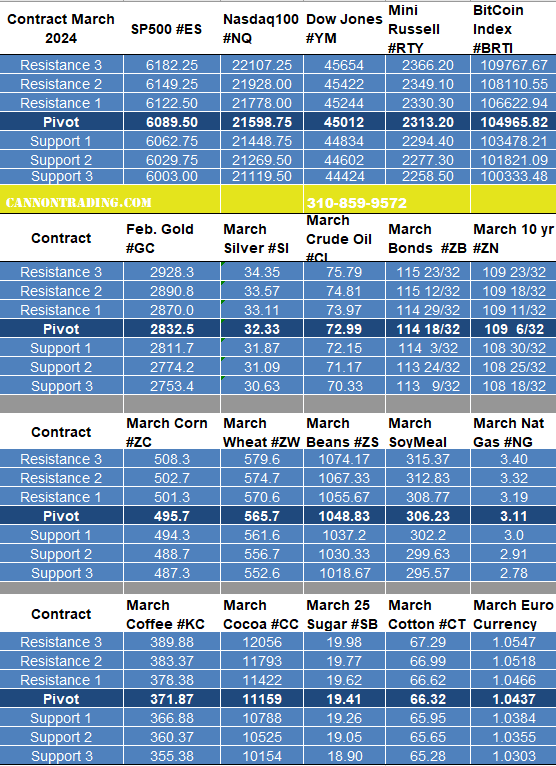
Daily Levels for April 2nd, 2024

b6b1a0dd 2eaf 4af9 bcd8 7c8b7e9715d7

thumbnail?url=http%3A%2F%2Fi.ytimg.com%2Fvi%2FJnHAMUGdNoM%2Fhqdefault

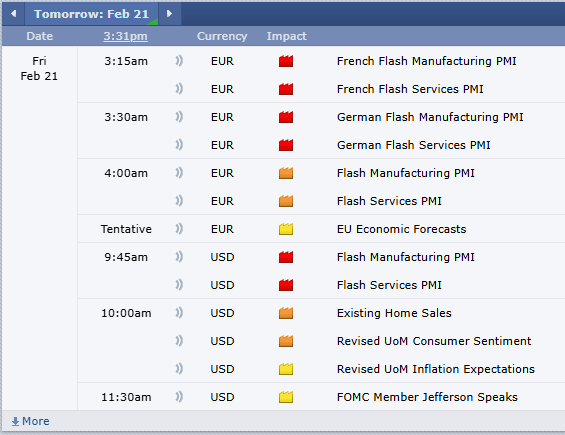
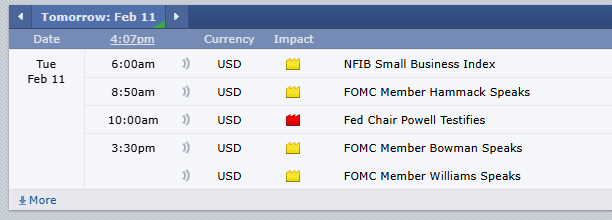
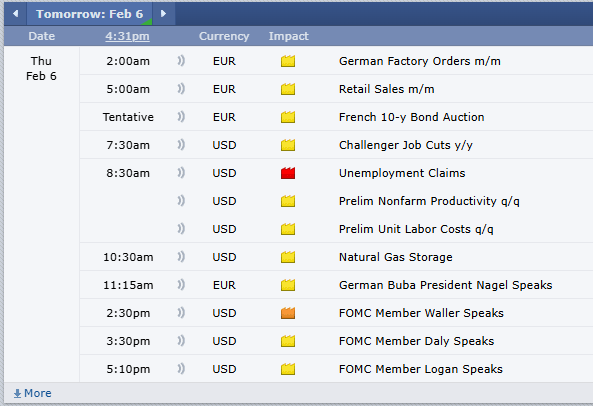
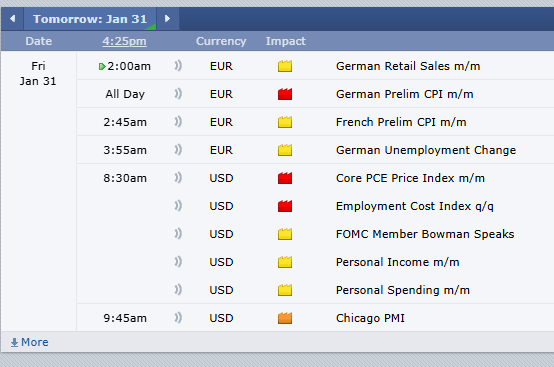
Economic Reports
provided by: ForexFactory.com
All times are Eastern Time ( New York)
76a21941 8f5f 45be 8344 a285dcf4b0e7

Improve Your Trading Skills

Get access to proprietary indicators and trading methods, consult with an experienced broker at 1-800-454-9572.

Explore trading methods. Register Here

3b644da2 2bee 4d39 8d98 5208a20bec39

* This is not a solicitation of any order to buy or sell, but a current market view provided by Cannon Trading Inc. Any statement of facts here in contained are derived from sources believed to be reliable, but are not guaranteed as to accuracy, nor they purport to be complete. No responsibility is assumed with respect to any such statement or with respect to any expression of opinion herein contained. Readers are urged to exercise their own judgement in trading.

Markets Post FOMC + Levels for March 21st 2024

Get Real Time updates and more by joining our Private Facebook Group!
Subscribe to our YouTube Channel


C6


Life After FOMC …..

by Mark O’Brien, Senior Broker

General: 


The Federal Reserve took center stage today.  With inflation proving stickier than expected, the central bank has found itself balancing between a hawkish and dovish view.  The policy-setting FOMC held interest rates steady at the 5.25%-5.50% range for the fifth straight meeting.  The bigger indicator traders were eager to see was the Fed governors’ so-called dot plot that updated their rate and economic projections – for the first time since December.  Turns out, it didn’t deviate from the three rate cuts they previously penciled in by the end of 2024.


Indexes: 


As of this typing, the June E-mini S&P 500 is trading at new all-time highs around 5280.  As well, the June E-mini Dow Jones is trading at its own all-time highs, barely 100 points away from 40,000!


Metals: 


April gold is on the verge of eking out its own all-time high close above last Monday’s closing price of $2,188.60 per ounce.  It’s currently trading ±$2,191.00 per ounce


General pt. II: 


Over the weekend, Japan ended its negative interest rate policy, marking a historic shift away from an aggressive monetary easing program that was implemented years ago to fight chronic deflation.  As part of the decision, the Bank of Japan (BOJ) raised interest rates for the first time in 17 years, lifting its short-term rate to “around zero to 0.1%” from minus 0.1%.


Plan your trade and trade your plan


stars

e35cb555 9ff3 4f00 9fe8 0655b28fbd90

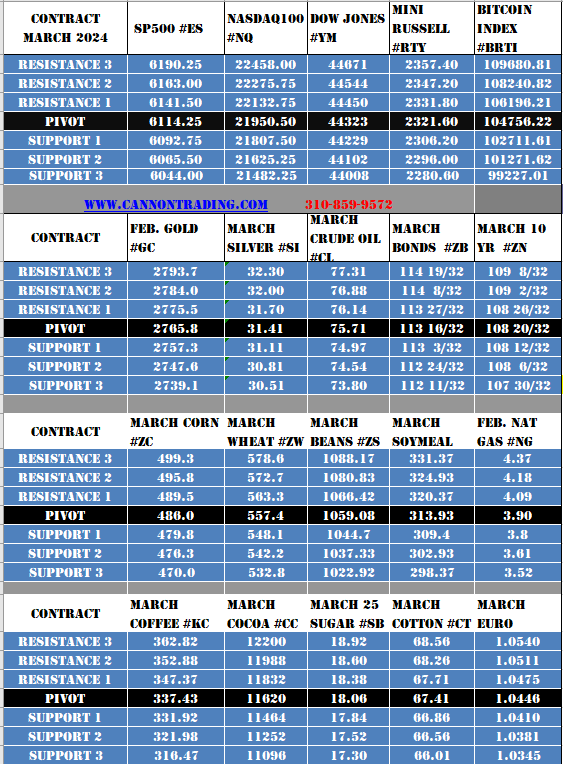
Daily Levels for March 21st, 2024

6d8c1969 faeb 45ef 86a7 555be3b55b38

b0ba1776 c0cd 4536 92c1 eef6595d7173

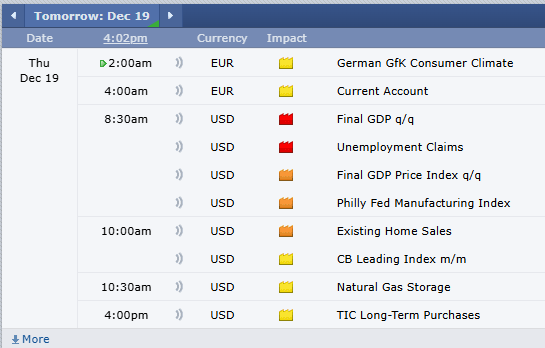
Economic Reports
provided by: ForexFactory.com
All times are Eastern Time ( New York)
f2a43cd3 379e 4c80 890c 0fe7e5f0d898

Improve Your Trading Skills

Get access to proprietary indicators and trading methods, consult with an experienced broker at 1-800-454-9572.

Explore trading methods. Register Here

3b644da2 2bee 4d39 8d98 5208a20bec39

* This is not a solicitation of any order to buy or sell, but a current market view provided by Cannon Trading Inc. Any statement of facts here in contained are derived from sources believed to be reliable, but are not guaranteed as to accuracy, nor they purport to be complete. No responsibility is assumed with respect to any such statement or with respect to any expression of opinion herein contained. Readers are urged to exercise their own judgement in trading.

Weekly Newsletter: Understanding Price Banding, May Bean Oil Outlook and Automated Gold System

Get Real Time updates and more by joining our Private Facebook Group!
Subscribe to our YouTube Channel

C27

Cannon Futures Weekly Letter Issue # 1186

In this issue:
  •  Important Notices – FOMC Next Week
  • Trading Resource of the Week – Understanding Price Limits and Banding
  • Hot Market of the Week – May Bean Oil
  • Broker’s Trading System of the Week – Gold Swing System
  • Trading Levels for Next Week
  • Trading Reports for Next Week


Important Notices –

  • FOMC Meeting next week. Announcement on Wednesday.
  • Light data most of the week. Housing sales
  • Very few earnings
  • June is front month for indices, currencies and financials.: M = June
  • USA is on daylight savings time – most international countries have NOT changed yet.


Trading Resource of the Week : What are Price Limits and Price Banding? by CMEgroup.com

As a trader, you want to know that there are mechanisms in place to ensure an orderly market. A regulated marketplace like CME Group provides this order by setting price limits and price banding.
Price Limits
Price limits are the maximum price range permitted for a futures contract in each trading session. These price limits are measured in ticks and vary from product to product. When markets hit the price limit, different actions occur depending on the product being traded. Some markets may temporarily halt until price limits can be expanded or trading may be stopped for the day based on regulatory rules. Different futures contracts will have different price limit rules; i.e. Equity Index futures have different rules than Agricultural futures.
Example
Equity Indexes futures have a three level expansion: 7%, 13% and 20% to the downside, and a 7% limit up and down in overnight trading.
When price reaches any of those levels the market will go limit up or limit down.
Calculating Price Limits
Price limits are re-calculated daily and remain in effect for all trading days except in certain physically-deliverable markets, where price limits are lifted prior to expiration so that futures prices are not prevented from converging on prices for the underlying commodity.
Typically, Agricultural futures will go limit up or down most often compared to Equity Index futures which very rarely if ever go limit up or down. When trading a specific product, it is important to be aware of price limits and the mechanisms that occur when limits are hit. Traders also know that it is possible for limits to be reached for more than one session in a row, however the expansion of limit thresholds over the last few years have reduced this occurrence.
Price Banding
Price banding is a similar mechanism which subjects all orders to price validation and rejects orders outside the given band to maintain orderly markets. Bands are calculated dynamically for each product based on the last price, plus or minus a fixed band value. Thus, if markets quickly move in one direction, the price bands dynamically adjust to accommodate new trading ranges.
Conclusion
The rules for each market can be found on cmegroup.com.
It is important to note that traders can place trades outside the daily price limits. These trades will be executed when price limits and price bands move within the specified range. So, traders still have the ability to place good-til-canceled or good-til-date orders inside and outside daily price limits.
In the last few years there are fewer and fewer times that markets will actually go limit up or down, but it is important to be aware of these pricing rules when you trade.
efa302e7 662d 4483 85eb 5655e4b45680


stars

3b644da2 2bee 4d39 8d98 5208a20bec39


  • Hot Market of the Week – May Bean Oil
Hot market of the week is provided by QT Market Center, A Swiss army knife charting package that’s not just for Hedgers, Cooperatives and Farmers alike but also for Spread traders, Swing traders and shorter time frame application for intraday traders with a unique proprietary indicator that can be applied to your specific trading needs.
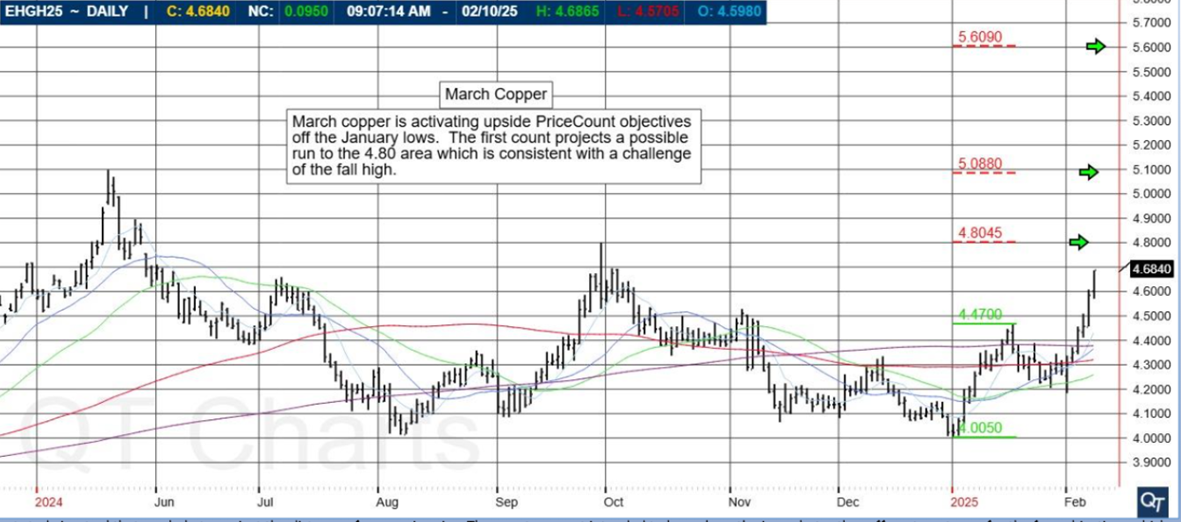
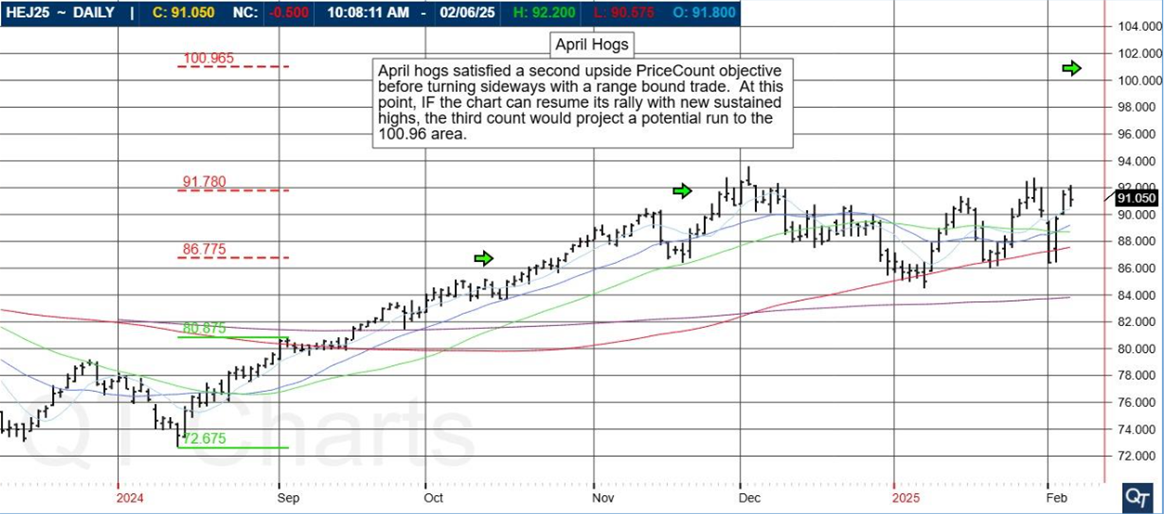
May Bean Oil
The rally in May soybean oil accelerated to its second upside PriceCount objective and now the chart is correcting. At this point, IF you can resume the rally with new sustained highs, the third count would project a possible run to the 50.87 area.
PriceCounts – Not about where we’ve been , but where we might be going next!
5bd46875 4f13 4f46 8290 888342486818
The PriceCount study is a tool that can help to project the distance of a move in price. The counts are not intended to be an ‘exact’ science but rather offer a target area for the four objectives which are based off the first leg of a move with each subsequent count having a smaller percentage of being achieved. It is normal for the chart to react by correcting or consolidating at an objective and then either resuming its move or reversing trend. Best utilized in conjunction with other technical tools, PriceCounts offer one more way to analyze charts and help to manage your positions and risk. Learn more at www.qtchartoftheday.com
Trading in futures, options, securities, derivatives or OTC products entails significant risks which must be understood prior to trading and may not be appropriate for all investors. Past performance of actual trades or strategies is not necessarily indicative of future results.
  • Broker’s Trading System of the Week

With algorithmic trading systems becoming more prevalent in portfolio diversification, the following system has been selected as the broker’s choice for this month.
Spartan Gold
PRODUCT
SYSTEM TYPE
Swing
COST
USD 75 / monthly
Recommended Cannon Trading Starting Capital
$20,000
846f5ed4 d467 4de2 9c1d 75acf0c4f4af
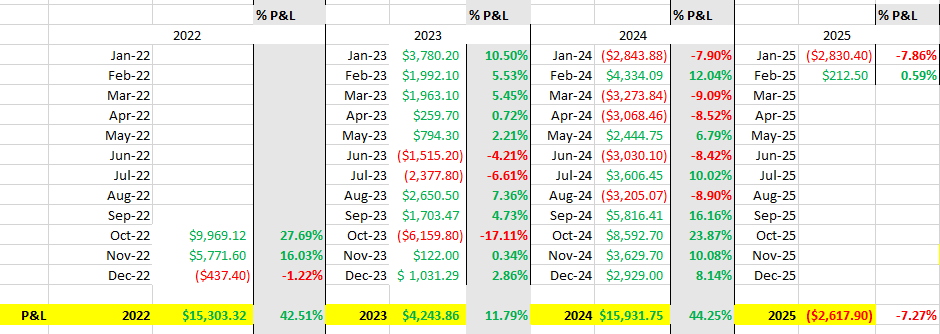
The performance shown above is hypothetical in that the chart represents returns in a model account. The model account rises or falls by the average single contract profit and loss achieved by clients trading actual money pursuant to the listed system’s trading signals on the appropriate dates (client fills), or if no actual client profit or loss available – by the hypothetical single contract profit and loss of trades generated by the system’s trading signals on that day in real time (real‐time) less slippage, or if no real time profit or loss available – by the hypothetical single contract profit and loss of trades generated by running the system logic backwards on back adjusted data. Please read full disclaimer HERE.
Would you like to receive daily support & resistance levels?
Yes
S
No
S


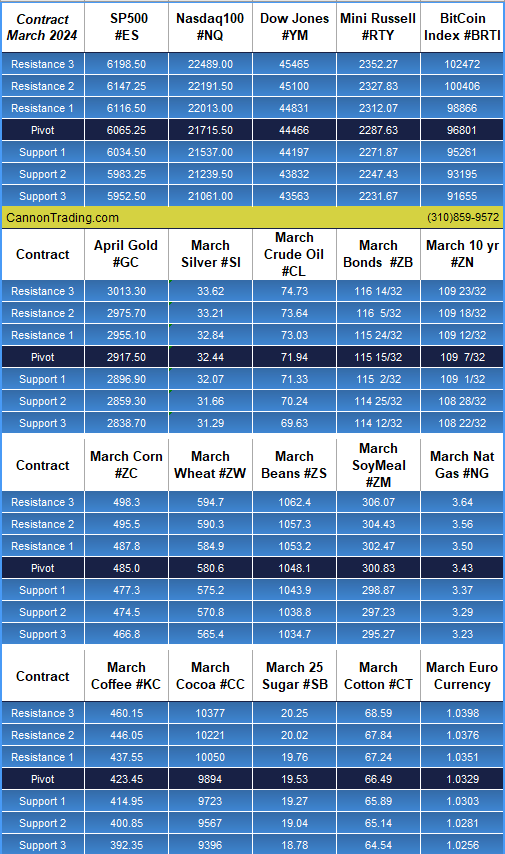
Daily Levels for March 18th 2024

b6a2bf3a a499 4edd 8d8e e4d3d22769b4

Trading Reports for Next Week

58d4627d b4e3 4117 a10c 1ddf826463a9
First Notice (FN), Last trading (LT) Days for the Week:

Improve Your Trading Skills

Get access to proprietary indicators and trading methods, consult with an experienced broker at 1-800-454-9572.

Explore trading methods. Register Here

871e501d 3a1d 4e83 8ee9 a2be76e7992f

* This is not a solicitation of any order to buy or sell, but a current market view provided by Cannon Trading Inc. Any statement of facts here in contained are derived from sources believed to be reliable, but are not guaranteed as to accuracy, nor they purport to be complete. No responsibility is assumed with respect to any such statement or with respect to any expression of opinion herein contained. Readers are urged to exercise their own judgement in trading.

Ahead of NFP + Futures Trading Levels for 03.06.2024

Get Real Time updates and more by joining our Private Facebook Group!
Subscribe to our YouTube Channel


C21


Bullet Points, Highlights, Announcements


Heads up: 


Keep an eye out for Friday (7:30 A.M., Central Time) for the release of the monthly Non-farm Payrolls report by the Labor Department.  It’s widely considered to be one of the most important and influential measures of the U.S. economy.


To review, the Labor Dept.’s Bureau of Labor Statistics surveys about 141,000 businesses and government agencies, representing approximately 486,000 individual work sites.  The report excludes farm workers, private household employees, domestic household workers and non-profit organization employees.  The report also includes other detailed industry data including the overall unemployment rate as a percentage of the total labor force that is unemployed but actively seeking work, wages, wage growth and average workday hours.


General:  


It was truly an historical day yesterday.  Both the decades-old 100-oz gold futures contract and the seven-year-old Bitcoin futures contracts traded up to all-time highs.  Apart from any of the stock index futures contracts, rarely do we see simultaneous all-time highs for futures contracts.  April gold touched $2,150.50 per ounce (and is trading at new all-time highs again today), while the March Bitcoin futures hit 70,195 – before a significant ±10,000-point sell-off in a span of four hours around mid-session.


But wait, there’s more!  May cocoa traded up to its own all-time high yesterday as well, hitting $6,660/metric ton intra-day.  This is a ±$26,000 move for cocoa in a little more than two months, having closed at $4,048 on Jan. 8.


Three consecutive all-time highs in futures: gold, Bitcoin and cocoa.  Oh my!


Energy:  


Managing Director and Global Head of Commodity Strategy at Royal Bank of Canada’s Capital Markets Division.  That’s quite a title and it’s how Helima Croft’s business card reads.  She’s well regarded as a specialist in geopolitics and energy and along with her team of commodity strategists who cover energy and metals are seeing signs of the higher supply/lower demand imbalance in crude oil tipping in the other direction.  This is a macro prediction and not forecasting any sort of breakneck move to $100/barrel and it rests in part on the view that the U.S. will be unable to replicate its “blockbuster” output of 2023.  It also anticipates OPEC+ will look to press on with its aggressive production cuts having already committed to extending its 2.2 million barrel-a-day production cut through June.  The projection also sees the conflict in the Middle East as instilling a risk premium in energy prices that isn’t going away soon and may increase if the region sees a spread of hostilities.


Plan your trade and trade your plan


stars

e35cb555 9ff3 4f00 9fe8 0655b28fbd90

Daily Levels for March 7th, 2024

aa2ec8ad 1144 45ca ad54 757166fc8d2d

b0ba1776 c0cd 4536 92c1 eef6595d7173

Economic Reports
provided by: ForexFactory.com
All times are Eastern Time ( New York)
123ef476 aa2f 4eac bbe8 67d6dc23d5bf

Improve Your Trading Skills

Get access to proprietary indicators and trading methods, consult with an experienced broker at 1-800-454-9572.

Explore trading methods. Register Here

3b644da2 2bee 4d39 8d98 5208a20bec39

* This is not a solicitation of any order to buy or sell, but a current market view provided by Cannon Trading Inc. Any statement of facts here in contained are derived from sources believed to be reliable, but are not guaranteed as to accuracy, nor they purport to be complete. No responsibility is assumed with respect to any such statement or with respect to any expression of opinion herein contained. Readers are urged to exercise their own judgement in trading.

Analysis of gold as we hit all time highs!

Get Real Time updates and more by joining our Private Facebook Group!
Subscribe to our YouTube Channel


C20


Gold’s Performance Against U.S., Asian Equities the Past Century

By Erik Norland of CMEGroup.com

Is gold a more profitable investment than equities over the long term? Our finding is that the value of gold has mostly held its own against the U.S. equity market since the S&P 500 time series began over 94 years ago (Figure 1). A well-defined picture of their performance through peaks and troughs is evident when the S&P 500 dollar value is repriced in gold, which is done by dividing the S&P 500 by the U.S. dollar price of one troy ounce of bullion (Figure 2).

Figure 1: Overall, gold has nearly held its own versus equities over the past 100 years.


4499bac2 55ef 41f7 a541 21479a9e17a1


9c1e2f79 fcaf 47e3 99b1 0d460c5f0683


The S&P 500/gold ratio has been subject to extremely strong trends and occasional periods of consolidation which correspond with different economic and geopolitical situations, some of which benefitted equities relative to gold and vice versa. Generally, equities have done better than gold during periods of geopolitical stability, disinflation and steady economic growth, while gold tends to outperform during periods of instability. Switching from one circumstance to another can set off powerful trends in the S&P 500/gold ratio that can last for years, even decades. The same goes for Asian equity markets when compared to gold, although the price history isn’t as long and the patterns differ both in equity market performance and trends in the currency market.

Since the equity market’s peak on September 3, 1929, the S&P 500/gold ratio has been through six distinct eras:

  • 1929-1942: The Great Depression and the Rise of the Axis Powers: Between 1929 and 1933 S&P 500 fell by 86% in U.S. dollar terms. In 1933, the incoming Roosevelt Administration’s first action was to devalue the dollar versus gold from $23 to $35 per ounce, a 52% gain for anyone who was still able to hold on to gold. Between 1933 and 1942, equities stagnated as the U.S. struggled to recover from the Depression and as the Axis Powers of Germany, Italy and Japan reached their peak of expansion in 1942.
  • 1942-1968: Allied Victory, Bretton Woods and Superpower Parity: as the Allies turned the tide in the war, equity markets began to rally. Stocks continued upward with only brief pauses around the time of the Korean War and the Cuban missile crisis. Under the post-war Bretton Woods system of fixed exchange rates, the dollar remained fixed at $35 per ounce and foreign currencies were pegged to the dollar. The S&P 500 soared 1,165% versus the dollar and gold.
  • 1968-1980: Overheating and Stagflation: The combination of the Great Society program and Vietnam War overheated the U.S. economy, leading to successive waves of inflation. Amid rising prices, the U.S. dollar peg to gold was no longer tenable. In 1971, the Nixon Administration pulled the plug on Bretton Woods, setting off a rally in gold prices that took the yellow metal from $35 to $800 per ounce by the end of the decade. Equity prices traded sideways in a wide range during this period of uncertainty which also featured the U.S. withdrawal from Vietnam, the 1973 Arab Embargo, the Iranian Revolution and the Soviet invasion of Afghanistan. Relative to gold, the S&P 500 fell by 95%.
  • 1980-2000: Disinflation and Pax Americana: Over the course of two decades the S&P 500 rose by 4,137% versus gold as stock prices soared and precious metals retreated amid tight money, falling inflation and improved economic growth.
  • 2000-2011: The Tech Wreck, War on Terror and the Global Financial Crisis: during this period, the S&P 500 lost 89% in gold terms.
  • 2011-2021: Pax Americana Part 2: From 2011-2019 equities soared amid a slow, low-inflation recovery in the U.S. that sent the price of gold substantially lower. While equities fell in the early stages of the Covid-19 pandemic, fiscal stimulus and $4.9 trillion of Federal Reserve quantitative easing (QE) purchases initially benefitted equities more than gold. Overall, the S&P 500 outperformed gold by 337% during this time.

What’s next? The S&P fell 28% versus gold from late 2021 through 2022, and despite its 2023 rebound led by mega-cap companies dubbed the Magnificent Seven, it remains 5% lower versus gold as of late February 2024 despite being about 6% above its 2021 highs when expressed in dollar terms. A few points are clear:

  • The S&P has lost its upside momentum versus gold.
  • The world may have entered a lasting period of geopolitical instability with Russia and other powers challenging the U.S.-led order.
  • It’s not clear if the U.S. and its peers will return to lastingly low levels of inflation or not.
  • Central banks have conducted the biggest tightening cycle in over 40 years, which may increase the risk of a global economic downturn and subsequent monetary easing.

These points have the potential to turn the tide against U.S. equities, which are highly valued (see our related article here), in favor of hard assets like gold. But what about much less expensive equity markets like those in China, Japan and Korea? South Korea’s KOSPI Index, Japan’s Nikkei 225 and Hong Kong’s Hang Seng Index have their own strong trends versus gold.

READ THE REST


Plan your trade and trade your plan


stars

e35cb555 9ff3 4f00 9fe8 0655b28fbd90

d52986c1 1df3 42ae a9c9 81a1636d587e

Daily Levels for March 6th, 2024

e138b1c7 ee6d 49ff 8cd9 3e8c2466355e

b0ba1776 c0cd 4536 92c1 eef6595d7173

Economic Reports
provided by: ForexFactory.com
All times are Eastern Time ( New York)
3a89076e 8ed6 45ad 9a26 5adbf7a41c4b

Improve Your Trading Skills

Get access to proprietary indicators and trading methods, consult with an experienced broker at 1-800-454-9572.

Explore trading methods. Register Here

3b644da2 2bee 4d39 8d98 5208a20bec39

* This is not a solicitation of any order to buy or sell, but a current market view provided by Cannon Trading Inc. Any statement of facts here in contained are derived from sources believed to be reliable, but are not guaranteed as to accuracy, nor they purport to be complete. No responsibility is assumed with respect to any such statement or with respect to any expression of opinion herein contained. Readers are urged to exercise their own judgement in trading.

What is a Troy Ounce? +Futures Trading Levels for 12.28.23

Get Real Time updates and more on our private FB group!

Join our Private Facebook group

Subscribe to our YouTube Channel


As has been the case in prior years, this week we’re seeing reduced daily trade volume across the futures markets.  Adding to this environment, Last Trading Day for Jan. ’24 Natural gas is tomorrow the 27th, and both First Notice Day for January ‘24 CBOT soy complex futures and Last Trading Day for January ‘24 RBOB gasoline and ULSD Heating oil is this Friday the 29th.

Both natural gas and crude oil numbers are out tomorrow due to the short trading week.


Just what is a Troy ounce, anyway?  For those trading precious metals futures like gold, silver, platinum and palladium, it’s the unit of weight by which those physical products are measured.


Turns out, a small town about 110 miles southeast of Paris and situated within the Champagne wine region was major intersection for parts of the Roman-era trade highways and then an important international trading hub during the Middle Ages (± 500 AD to 1500).  The town’s name: Troyes (pronounced: troy).  Right around the 12th and 13th centuries – call it the middle of the Middle Ages – an annual cycle of 2- to 3-week trade fairs flourished in the region and it was likely then that the unit of weight was standardized and first used.  It essentially beat out other systems of weight developed in other parts of Europe and eventually it was made the official weight for gold and silver by England in 1824, called the British Imperial system.  Four years later, the United States adopted it as an official weight standard for United States coinage.  And today, your precious metals are still measured using this system.


3b644da2 2bee 4d39 8d98 5208a20bec39


36e28a0d-7208-42c4-9f7c-dfe717a613ea image


Trading Futures, Options on Futures, and retail off-exchange foreign currency transactions involves substantial risk of loss and is not suitable for all investors.  You should carefully consider whether trading is suitable for you in light of your circumstances, knowledge, and financial resources. You may lose all or more of your initial investment. Opinions, market data, and recommendations are subject to change at any time when it comes to Futures Trading.

Futures Trading Levels

12-28-2023

#ES, #NQ, #YM, #RTY, #XBT, #GC, #SI, #CL, #ZB, #6E, #ZC, #ZW, #ZS, #ZM, #NG

Improve Your Trading Skills

Get access to proprietary indicators and trading methods, consult with an experienced broker
 1-800-454-9572 Explore trading methods. Register Here


Economic Reports,

Source: 

Forexfactory.com

24b5ddfd 4a15 4f9a abde 801ec87f2d92


This is not a solicitation of any order to buy or sell, but a current market view provided by Cannon Trading Inc. Any statement of facts here in contained are derived from sources believed to be reliable, but are not guaranteed as to accuracy, nor they purport to be complete. No responsibility is assumed with respect to any such statement or with respect to any expression of opinion herein contained. Readers are urged to exercise their own judgement in trading.

Weekly Newsletter: Text Alerts, Silver Daily Chart + Futures Trading Levels for Dec. 4th

Cannon Futures Weekly Newsletter Issue # 1173


Join our private Facebook group for additional insight into trading and the futures markets!

In this issue:

  •  Important Notices – Trade March bonds, Feb. gold
  • Trading Resource of the Week – Trade Alerts
  • Hot Market of the Week – March Silver
  • Broker’s Trading System of the Week – CL (Crude) Day Trading System
  • Trading Levels for Next Week
  • Trading Reports for Next Week
  • Important Notices

    • Federal Reserve Board Black Out Period Dec 2-14
    • March (H24) Interest rate products, ZB, UB,ZN,ZF,ZT. are now front month
    • Front month for gold is February
    • March (H24) front month for silver
    • Earnings watch, Tuesday 12-5 Toll Brothers Builders NYSE (TOL), Thursday 12-7 chipmaker Broadcom NYSE (AVCO)
    • Reports a variety, Main Focus Friday, NFP 6:30am, WASDE 10am and 1st day of Hanukkah all times CST

d259df9c bf07 4429 9fa8 d12b53c37804

  • click above for a LIVE demo, streaming prices


  • Trading Resource of the Week 

Real Time Text Alerts

Directly to your Phone!
  • You will receive a text and email each time there is an entry or exit in a simple language along with the current price for that specific market.
  • A licensed series 3 broker at your fingertips
  • Text alerts available to US and Canada residents. Int’l clients will receive the alerts via email. No obligation
  • Alerts available for: Stock Indices, Grains, Metals, Rates, Currencies and Meats
  • Open an account* and receive the Trade Alerts free for 3 months ($357 value)

.

Hot market of the week is provided by QT Market Center, A swiss army knife charting package that’s not just for Hedgers, Cooperatives and Farmers alike but also for Spread traders, Swing traders and shorter time frame application for intraday traders with a unique proprietary indicator that can be applied to your specific trading needs.
March Silver stabilized its break last month and activated upside PriceCount objectives on the correction higher. Now, the chart is taking aim at its first upside target in the 26.41 area.
PriceCounts – Not about where we’ve been , but where we might be going next!
6d11faa0 4604 4de6 8558 a28e211241a6
The PriceCount study is a tool that can help to project the distance of a move in price. The counts are not intended to be an ‘exact’ science but rather offer a target area for the four objectives which are based off the first leg of a move with each subsequent count having a smaller percentage of being achieved. It is normal for the chart to react by correcting or consolidating at an objective and then either resuming its move or reversing trend. Best utilized in conjunction with other technical tools, PriceCounts offer one more way to analyze charts and help to manage your positions and risk. Learn more at www.qtchartoftheday.com
Trading in futures, options, securities, derivatives or OTC products entails significant risks which must be understood prior to trading and may not be appropriate for all investors. Past performance of actual trades or strategies is not necessarily indicative of future results.
3b644da2 2bee 4d39 8d98 5208a20bec39
  • Broker’s Trading System of the Week

With algorithmic trading systems becoming more prevalent in portfolio diversification, the following system has been selected as the broker’s choice for this month.
PRODUCT
SYSTEM TYPE
Intraday
Recommended Cannon Trading Starting Capital
$15,000.00
COST
USD 115 / monthly
055e6d9c 59b0 40db b8e8 1bf91a01d402
The performance shown above is hypothetical in that the chart represents returns in a model account. The model account rises or falls by the average single contract profit and loss achieved by clients trading actual money pursuant to the listed system’s trading signals on the appropriate dates (client fills), or if no actual client profit or loss available – by the hypothetical single contract profit and loss of trades generated by the system’s trading signals on that day in real time (real‐time) less slippage, or if no real time profit or loss available – by the hypothetical single contract profit and loss of trades generated by running the system logic backwards on back adjusted data. Please read full disclaimer HERE.
Sign Up for a Free Personalized Consultation with a Broker from Cannon Trading Company
Questions about the markets? trading? platforms? technology? trading systems? Get answers with a complimentary, confidential consultation with a Cannon Trading Company series 3 broker.
Would you like to receive daily support & resistance levels?
Yes
S
No
S


  • Trading Levels for Next Week

Daily Levels for December 4th, 2023
#ES, #NQ, #YM, #RTY, #XBT, #GC, #SI, #CL, #ZB, #6E, #ZC, #ZW, #ZS, #ZM, #NG
Trading Reports for Next Week
1318f4ff bafa 4927 88b9 736aa284469e
First Notice (FN), Last trading (LT) Days for the Week: www.mrci.com 
c66e1411 7d11 4456 a550 e90e1038800d

This is not a solicitation of any order to buy or sell, but a current market view provided by Cannon Trading Inc. Any statement of facts herein contained are derived from sources believed to be reliable but are not guaranteed as to accuracy, nor they purport to be complete. No responsibility is assumed with respect to any such statement or with respect to any expression of opinion herein contained. Readers are urged to exercise their own judgment in trading.


Good Trading!
Trading Futures, Options on Futures, and retail off-exchange foreign currency transactions involves substantial risk of loss and is not suitable for all investors. You should carefully consider whether trading is suitable for you in light of your circumstances, knowledge, and financial resources. You may lose all or more of your initial investment. Opinions, market data, and recommendations are subject to change at any time.

Futures Trading Levels for December 1st

Get Real Time updates and more on our private FB group!

Join our Private Facebook group

Subscribe to our YouTube Channel


Tomorrow is the first trading day for December. Last and first trading days of the months can at times be more volatile and at times have a chance to become a trending day.

ISM and Fed’s Powell speaking are the highlights on the reports side.


Trader’s Check List:

·        Review prior day statement

·        Check for any working orders on your platforms.

·        Be aware of contract rollover dates

·        Set a daily loss limit and learn NOT to overtrade

·        Understand what reports are coming out today

·        Make sure you are not distracted

·        Calculate appropriate trading size based on current volatility and account size

·        Start with Larger Time Frame charts to get proper perspective

·        Understand what your goal is

·        Measure your success or lack of

·        Spend time furthering your trading education and exploring different methods

·        Put trading in perspective and make sure the overall psychology of trading fits you.

logo

Plan your trade and trade your plan.

Download your FREE copy of Order Flow Essentials!

b0ba1776 c0cd 4536 92c1 eef6595d7173


Trading Futures, Options on Futures, and retail off-exchange foreign currency transactions involves substantial risk of loss and is not suitable for all investors.  You should carefully consider whether trading is suitable for you in light of your circumstances, knowledge, and financial resources. You may lose all or more of your initial investment. Opinions, market data, and recommendations are subject to change at any time when it comes to Futures Trading.

3b644da2 2bee 4d39 8d98 5208a20bec39

Futures Trading Levels

12-1-2023

6e4720b3 374d 4ddd af51 f046744d8dbe


Improve Your Trading Skills

Get access to proprietary indicators and trading methods, consult with an experienced broker
 1-800-454-9572 Explore trading methods. Register Here


Economic Reports,

4442866e 18c6 4d18 8800 ae3ca2f96968

Source: 

Forexfactory.com


This is not a solicitation of any order to buy or sell, but a current market view provided by Cannon Trading Inc. Any statement of facts here in contained are derived from sources believed to be reliable, but are not guaranteed as to accuracy, nor they purport to be complete. No responsibility is assumed with respect to any such statement or with respect to any expression of opinion herein contained. Readers are urged to exercise their own judgement in trading.

Gold Broke Higher – Next levels? Futures Trading Levels 11.28.2023

Get Real Time updates and more on our private FB group!

09ee0fcd 6bcb 4670 8c6e ba64dca47f31


Plan your trade and trade your plan.


Trading Futures, Options on Futures, and retail off-exchange foreign currency transactions involves substantial risk of loss and is not suitable for all investors.  You should carefully consider whether trading is suitable for you in light of your circumstances, knowledge, and financial resources. You may lose all or more of your initial investment. Opinions, market data, and recommendations are subject to change at any time when it comes to Futures Trading.

3b644da2 2bee 4d39 8d98 5208a20bec39

Futures Trading Levels

11-29-2023

#ES, #NQ, #YM, #RTY, #XBT, #GC, #SI, #CL, #ZB, #6E, #ZC, #ZW, #ZS, #ZM, #NG

Improve Your Trading Skills

Get access to proprietary indicators and trading methods, consult with an experienced broker
 1-800-454-9572 Explore trading methods. Register Here


Economic Reports, Source: 

Forexfactory.com


3f88b72e 4c53 4384 b630 884d8df2c3c6

This is not a solicitation of any order to buy or sell, but a current market view provided by Cannon Trading Inc. Any statement of facts here in contained are derived from sources believed to be reliable, but are not guaranteed as to accuracy, nor they purport to be complete. No responsibility is assumed with respect to any such statement or with respect to any expression of opinion herein contained. Readers are urged to exercise their own judgement in trading.

Managing Risk: Your Guide to Hedging Live Cattle Futures

Get Real Time updates and more on our private FB group!

Mastering Risk: A Comprehensive Guide to Hedging Live Cattle on the Futures Market

Find out more about hedging cattle with Cannon Trading Company here.

Untitled 50

Hedging in the futures market is a strategic practice that empowers market participants, especially those in the agricultural sector, to manage and mitigate risk effectively. Among the various commodities traded on futures exchanges, live cattle holds a significant position due to its importance in the global food supply chain. In this comprehensive guide, we will explore the intricacies of hedging live cattle on the futures market, delve into the nuances of feeder cattle futures, and compare hedging strategies involving options and futures. From short and long hedges to the perspectives of hedgers and farmers, we will unravel the essential elements of hedging in the live cattle market.

  1. Introduction to Hedging Live Cattle Futures
  2. Significance of Live Cattle in Agriculture

Live cattle represent a crucial component of the agricultural sector, contributing to the production of beef and other by-products. The live cattle futures market provides a platform for producers, processors, and end-users to manage the price risk associated with fluctuations in the cattle market.

  1. Volatility in Agricultural Markets

Agricultural markets, including live cattle, are inherently susceptible to various risk factors such as weather conditions, disease outbreaks, and global economic trends. The volatility in these markets underscores the importance of risk management strategies, with hedging emerging as a key tool for stakeholders.

  1. Understanding Short and Long Hedges in Live Cattle Futures
  2. Short Hedge in Live Cattle Futures

A short hedge involves selling futures contracts to protect against potential price declines in the underlying asset—in this case, live cattle. Producers, such as farmers and ranchers, can use a short hedge to lock in a favorable selling price for their cattle, mitigating the impact of adverse market movements.

  1. Application of Short Hedge by Producers
  2. Locking in Selling Prices: Farmers and ranchers can initiate a short hedge to lock in selling prices for their live cattle. By selling futures contracts, they establish a predetermined price, safeguarding against price declines.
  3. Risk Mitigation for Selling Periods: Producers often face uncertainty regarding the future prices of their cattle, especially during selling periods. A well-timed short hedge allows them to manage this uncertainty and secure a stable revenue stream.
  4. Long Hedge in Live Cattle Futures

On the flip side, a long hedge involves buying futures contracts to protect against potential price increases in the underlying asset. End-users, such as meat processors and retailers, can employ a long hedge to secure a stable buying price for live cattle, guarding against upward price movements.

  1. Application of Long Hedge by End-Users
  2. Securing Buying Prices: Meat processors and retailers can use a long hedge to secure buying prices for live cattle. By buying futures contracts, they establish a fixed cost for their raw materials, protecting against potential price increases.
  3. Stable Input Costs: A long hedge ensures stable input costs for end-users, allowing them to plan their budgets more effectively. This strategy is particularly valuable when facing uncertainties in the commodity markets.
  4. Feeder Cattle Futures: A Specialized Segment of Live Cattle Hedging
  5. Distinct Characteristics of Feeder Cattle

Feeder cattle represent a specific category within the live cattle market. These are young cattle that are typically raised until they reach a suitable weight before being sent to feedlots for further fattening. Hedging feeder cattle involves unique considerations due to their specific market dynamics.

  1. Feeder Cattle Futures vs. Live Cattle Futures
  2. Weight and Age Differences: Feeder cattle are younger and lighter than live cattle. Hedging feeder cattle involves considering factors such as weight gain during the feeding period and the impact on the animals’ value.
  3. Price Relationships: The prices of feeder cattle and live cattle are interconnected. Traders and hedgers need to analyze the historical relationships between feeder cattle and live cattle prices to make informed decisions.
  4. Hedging Feeder Cattle Futures with Options vs. Futures

When it comes to hedging feeder cattle, market participants have the option to use either futures contracts or options contracts. Each approach has its advantages and considerations.

  1. Hedging with Futures Contracts
  2. Simplicity and Directness: Hedging with feeder cattle futures contracts is straightforward. Traders can directly buy or sell contracts to offset price risks.
  3. Limited Risk Management Tools: While effective, futures contracts have limited risk management tools. Traders must rely on the directional movements of the market to achieve their hedging objectives.
  4. Hedging with Options Contracts
  5. Flexibility in Risk Management: Options provide a higher degree of flexibility in risk management. Traders can use various options strategies to customize their hedges based on market expectations.
  6. Cost Considerations: Options contracts may involve upfront costs in the form of premiums. Traders need to assess whether the benefits of options, such as flexibility, outweigh the associated costs.
  7. Hedging Perspectives: Farmers, Ranchers, and End-Users
  8. Perspective of Farmers and Ranchers
  9. Price Stability: For farmers and ranchers, achieving price stability is paramount. Hedging allows them to lock in prices for their live cattle, providing financial predictability amid market uncertainties.
  10. Cost of Production Management: Farmers and ranchers can use hedging to manage the costs of production. By securing selling prices, they gain greater control over their profit margins.
  11. Perspective of End-Users (Meat Processors and Retailers)
  12. Budget Planning: End-users rely on stable input costs for effective budget planning. Hedging with live cattle futures enables them to manage and forecast costs with more precision.
  13. Consumer Price Stability: Hedging helps end-users maintain stable consumer prices. By securing buying prices, they can avoid passing on sudden and unpredictable cost increases to consumers.
  14. Factors Influencing Hedging Decisions in Live Cattle Futures
  15. Market Conditions and Outlook
  16. Supply and Demand Dynamics: Hedgers closely monitor supply and demand dynamics in the live cattle market. Shifts in these dynamics can influence price trends and impact hedging decisions.
  17. Global Economic Factors: Economic factors, both domestic and international, can affect the live cattle market. Hedgers consider variables such as economic growth, trade policies, and currency fluctuations in their analyses.
  18. Weather Conditions and Environmental Factors
  19. Impact on Feed Supply: Weather conditions play a crucial role in determining feed availability. Changes in weather patterns can affect the cost and availability of feed for cattle, influencing hedging decisions.
  20. Disease Outbreaks and Environmental Risks: Disease outbreaks or environmental risks, such as natural disasters, can have a significant impact on the live cattle market. Hedgers factor in these risks when formulating their risk management strategies.
  21. Government Policies and Regulations
  22. Trade Policies: Changes in trade policies, tariffs, and import/export regulations can influence the international movement of live cattle. Hedgers need to stay informed about government policies that may impact market dynamics.
  23. Agricultural Subsidies: Government subsidies and support programs for the agricultural sector can influence the cost structure for farmers and ranchers. Hedgers consider the potential effects of such policies on their risk exposure.
  24. Case Studies: Practical Applications of Live Cattle Hedging
  25. Case Study 1: Short Hedge by a Cattle Producer

Imagine a cattle producer who anticipates a potential decline in live cattle prices during the selling season. To mitigate the risk of lower prices, the producer decides to initiate a short hedge.

  1. Steps Taken:
  2. Sell Live Cattle Futures Contracts: The producer sells live cattle futures contracts to lock in a predetermined selling price.
  3. Offsetting the Hedge at Selling Time: When it’s time to sell the actual cattle, the producer offsets the short hedge by buying back the equivalent number of futures contracts.
  4. Results: If live cattle prices decline, the losses incurred in the physical market are offset by gains in the futures market, providing the producer with a more predictable revenue stream.
  5. Case Study 2: Long Hedge by a Meat Processor

Consider a meat processor facing uncertainties in live cattle prices, which could impact production costs. To stabilize input costs, the meat processor decides to initiate a long hedge.

  1. Steps Taken:
  2. Buy Live Cattle Futures Contracts: The meat processor buys live cattle futures contracts to establish a fixed buying price for the cattle.
  3. Offsetting the Hedge at Buying Time: When it’s time to purchase live cattle, the meat processor offsets the long hedge by selling back the equivalent number of futures contracts.
  4. Results: If live cattle prices increase, the higher costs in the physical market are mitigated by gains in the futures market, allowing the meat processor to maintain stable input costs.
  5. Risk Management and Monitoring Strategies in Live Cattle Hedging
  6. Continuous Monitoring of Market Conditions

Hedgers need to stay vigilant and continuously monitor market conditions. Regular analysis of supply and demand factors, weather forecasts, and economic indicators ensures that hedging strategies remain aligned with evolving market dynamics.

  1. Adjustments to Hedging Positions

Given the dynamic nature of commodity markets, hedgers may need to make adjustments to their positions. This could involve rolling over futures contracts, adjusting options positions, or even exiting or entering new hedges based on changing circumstances.

  1. Scenario Analysis and Stress Testing

Scenario analysis and stress testing involve simulating various market scenarios to assess the impact on hedging positions. This proactive approach allows hedgers to identify potential vulnerabilities and refine their risk management strategies accordingly.

  1. Educational Resources for Live Cattle Hedging
  2. Training Programs and Workshops

Many commodity trading platforms and industry organizations offer training programs and workshops on hedging strategies. These educational opportunities provide participants with practical insights and hands-on experience in live cattle hedging.

  1. Online Courses and Webinars

Online courses and webinars cover a range of topics related to live cattle hedging, including fundamental and technical analysis, risk management techniques, and the application of options in hedging strategies.

  1. Educational Materials from Industry Experts

Publications, articles, and research papers authored by industry experts provide valuable knowledge on live cattle hedging. These materials delve into advanced concepts, case studies, and best practices in risk management.

Hedging live cattle on the futures market is a sophisticated yet indispensable practice for stakeholders in the agricultural and meat processing industries. Whether employing short hedges as a cattle producer or long hedges as a meat processor, participants in the live cattle market can harness the power of futures and options to manage risk and achieve greater financial stability.

Cannon Trading, with its commitment to providing comprehensive support and educational resources, stands as a reliable ally for those navigating the complexities of live cattle hedging. The platform’s expertise, combined with its array of tools and personalized assistance, empowers hedgers to make informed decisions in a market characterized by both opportunities and uncertainties.

It’s essential to recognize that live cattle hedging is not a one-size-fits-all endeavor. The effectiveness of hedging strategies depends on a thorough understanding of market dynamics, diligent risk management, and the ability to adapt to changing conditions. By embracing these principles and leveraging the resources available through platforms like Cannon Trading, stakeholders can navigate the live cattle market with confidence, turning challenges into opportunities and securing a resilient position in this vital sector of the global economy.

Ready to start trading futures? Call US 1(800)454-9572 – Int’l (310)859-9572 email info@cannontrading.com and speak to one of our experienced, Series-3 licensed futures brokers and start your futures trading journey with Cannon Trading Company today.

Disclaimer – Trading Futures, Options on Futures, and retail off-exchange foreign currency transactions involves substantial risk of loss and is not suitable for all investors.  Past performance is not indicative of future results. You should carefully consider whether trading is suitable for you in light of your circumstances, knowledge, and financial resources. You may lose all or more of your initial investment. Opinions, market data, and recommendations are subject to change at any time.

**This article has been generated with the help of AI Technology. It has been modified from the original draft for accuracy and compliance reasons.

***@cannontrading on all socials.
Plan your trade and trade your plan.

Download your FREE copy of Order Flow Essentials!

b0ba1776 c0cd 4536 92c1 eef6595d7173


Trading Futures, Options on Futures, and retail off-exchange foreign currency transactions involves substantial risk of loss and is not suitable for all investors.  You should carefully consider whether trading is suitable for you in light of your circumstances, knowledge, and financial resources. You may lose all or more of your initial investment. Opinions, market data, and recommendations are subject to change at any time when it comes to Futures Trading.

3b644da2 2bee 4d39 8d98 5208a20bec39


Improve Your Trading Skills

Get access to proprietary indicators and trading methods, consult with an experienced broker
 1-800-454-9572 Explore trading methods. Register Here
This is not a solicitation of any order to buy or sell, but a current market view provided by Cannon Trading Inc. Any statement of facts here in contained are derived from sources believed to be reliable, but are not guaranteed as to accuracy, nor they purport to be complete. No responsibility is assumed with respect to any such statement or with respect to any expression of opinion herein contained. Readers are urged to exercise their own judgement in trading.