Second Interest Rate Cut, December Cotton, Levels, Reports; Your 4 Critical Need-To-Knows for Trading Futures on October 30th, 2025

9dc1e02e d5f7 4ff4 abf7 1df60775f196

What You Need to Know Before Trading Futures Tomorrow!

By Mark O’Brien, Senior Broker

At-a-Glance Levels

Instrument S2 S1 Pivot R1 R2

Gold (GC)

— Dec (GCZ5)

3861.93 3910.07 3978.13 4026.27 4094.33

Silver (SI)

— Dec (SIZ5)

46.01 46.69 47.60 48.28 49.19

Crude Oil (CL)

— Dec (CLZ5)

59.02 59.67 60.34 60.99 61.66

 Dec. Bonds (ZB)

— Dec (ZBZ5)

117 7/32 117 20/32 118 13/32 118 26/32 119 19/32

interest

Interest Rates

It wasn’t even apparent during Chair Jerome Powell’s post-announcement news conference what triggered the price jolts in several of the futures markets this afternoon – including a ±50-point decline in the E-mini S&P 500 and a ±200-point decline in the E-mini Nasdaq in the span of eight minutes, or the ±$40 sell-off in gold in the span of two minutes.

Regardless of the cause, they served as the latest real-world examples of why it’s so important for traders of all types to assess the risks of their trades – before you enter into them – and have a plan to manage that risk. Day traders and position traders alike should be aware of important planned events – just like FOMC announcements and press conferences – and anticipate the potential risks to those events (these days it’s wise to include occasions when the U.S. president speaks, considering his ongoing involvement and influence in global trade relations).

These events certainly create opportunities for traders – outsize moves can also result in outsize favorable outcomes – but the most important aspect to trading – is always to manage risk.

General – Interest Rates:

Day 29 of the U.S Government shut-down, now the second-longest on record.

The Federal Reserve cut interest rates by a quarter of a percentage point today – its second consecutive rate cut, lowering the Fed’s benchmark interest rate to a range of 3.75 to 4 percent, its lowest level in three years.

Stock Index Futures:

We’re amidst earning season for the third quarter. Moving into full swing, all eyes were on Microsoft, Google-parent Alphabet and Facebook-owner Meta today– all releasing their latest earnings results after the closing bell.

Tomorrow:

Apple and Amazon

eedd6ceb 177c 4281 a073 6422fe004207

December Cotton

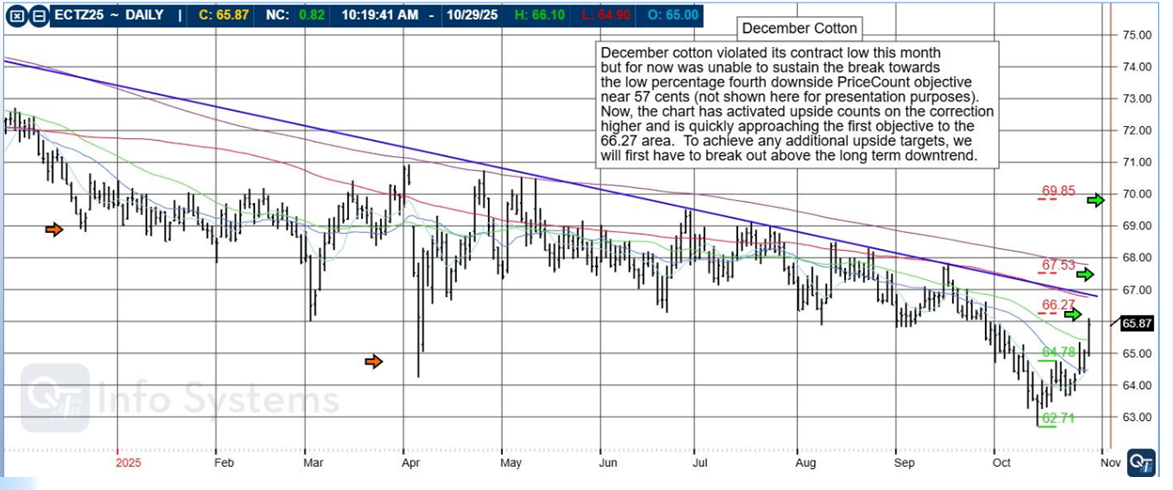
December cotton violated its contract low this month but for now was unable to sustain the break towards the low percentage drawn downside PriceCount objective near 57 cents not shown here for presentation purposes. The new chart has activated upside counts on the correction higher and is quickly approaching the first objective to the 66.27 area. To achieve any additional upside targets, we will first have to break out above the long-term downtrend

9ce7dfa6 6d50 42e2 9710 3fd1664febc6

The PriceCount study is a tool that can help to project the distance of a move in price. The counts are not intended to be an ‘exact’ science but rather offer a target area for the four objectives which are based off the first leg of a move with each subsequent count having a smaller percentage of being achieved.

It is normal for the chart to react by correcting or consolidating at an objective and then either resuming its move or reversing trend. Best utilized in conjunction with other technical tools, PriceCounts offer one more way to analyze charts and help to manage your positions and risk. Learn more at www.qtchartoftheday.com

Trading in futures, options, securities, derivatives or OTC products entails significant risks which must be understood prior to trading and may not be appropriate for all investors. Past performance of actual trades or strategies is not necessarily indicative of future results.

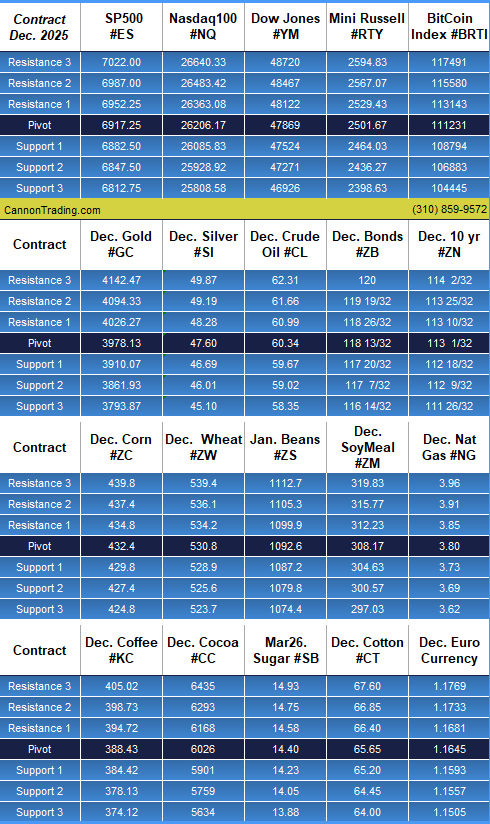
Daily Levels for Oct. 30th, 2025

92e0c1e9 f423 4e88 bff9 33ca99e54707

Want to feature our updated trading levels on your website? Simply paste a small code, and they’ll update automatically every day! 

Click here for quick and easy instructions.

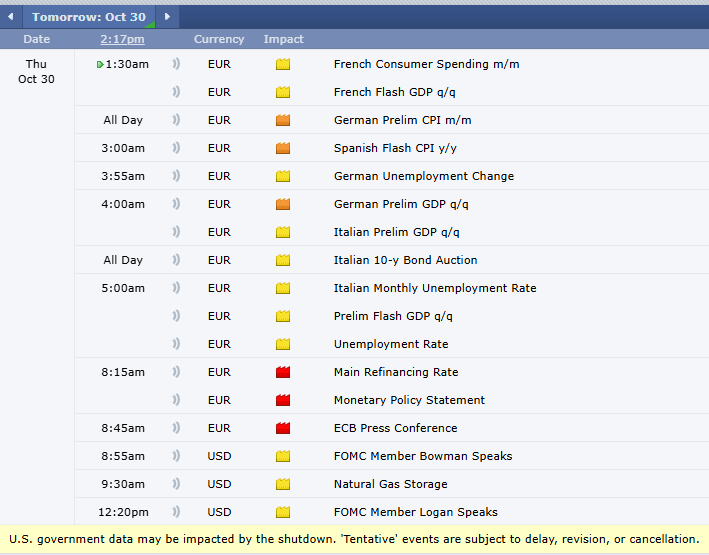
Economic Reports

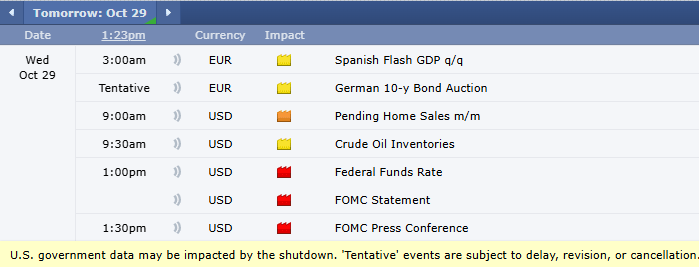
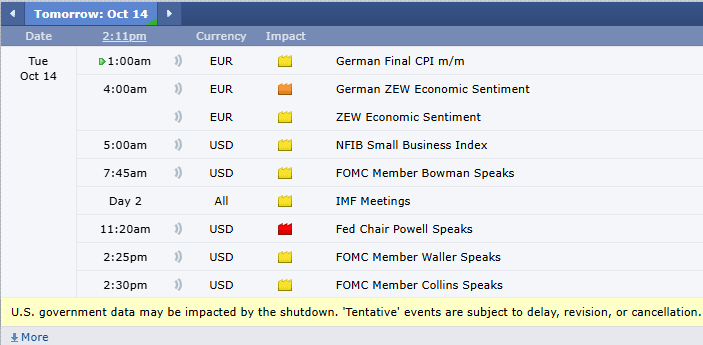
 U.S. government data may be impacted by the shutdown. ‘Tentative’ events are subject to delay, revision, or cancellation

provided by: ForexFactory.com

All times are Central Time ( Chicago)

8dc91c71 6291 4a52 93ec dc302d65a300

Find us on Trustpilot

stars

Trading Futures, Options on Futures, and retail off-exchange foreign currency transactions involves substantial risk of loss and is not suitable for all investors. You should carefully consider whether trading is suitable for you in light of your circumstances, knowledge, and financial resources. You may lose all or more of your initial investment. Opinions, market data, and recommendations are subject to change at any time.

Join our Private Facebook group

Subscribe to our YouTube Channel

Listen to our podcast: Subscribe on AppleSpotify, Amazon

or wherever you listen to podcasts!

S
Facebook  Instagram  LinkedIn
S
ef3ab1c9 8d6d 4e60 a3f1 af5d9d4ecbb3
Services
Software
Tools
Community
Contact

FOMC Tomorrow, December Live Cattle, Levels, Reports; Your 4 Important Need-To-Knows for Trading Futures on October 29th, 2025

9dc1e02e d5f7 4ff4 abf7 1df60775f196

FOMC Tomorrow

By John Thorpe, Senior Broker

At-a-Glance Levels

Instrument S2 S1 Pivot R1 R2

Gold (GC)

— Dec (GCZ5)

3837.43 3906.47 3970.33 4039.37 4103.23

Silver (SI)

— Dec (SIZ5)

44.83 46.01 46.69 47.88 48.56

Crude Oil (CL)

— Nov (CLX5)

58.65 59.28 60.39 61.02 62.13

 Dec. Bonds (ZB)

118 18/32 118 27/32 119 1/32 119 10/32 119 16/32
fomc
 

October 29th, Tomorrow, is the 96th anniversary (seems like the term “anniversary” should be celebratory rather than marking a day of dread for the nation) Black Tuesday: when the US Stock Market crashes, ending the Great Bull Market of the 1920s and eventually contributing to the Great Depression. While we don’t expect this current Great Bull Market will crash tomorrow, yet anytime soon, it is not a novel idea to manage risk, it’s imperative.

Tomorrow is also the release of the expected 2nd to last in a series of Fed Rate cuts while Chairman Jerome Powell will read a statement and will avail himself to the Press Corps. Expectations are for .25 reduction to the 3.75-4.00 range. Although surprises do occur, the only surprise tomorrow would be in the language used to massage future rate cuts, rather than the cut itself. Big Earnings after the close tomorrow as Microsoft, Google and Meta.

Previously in this blog I have included some option strategies, for both high volatility markets and low volatility markets. Measures of volatility are important to understand more holistically your risk management requirements when implementing your option strategy. I am including some basic definitions of the “Greeks” used to measure the impact of volatility on Option Premiums. In trading futures options, they help traders assess risk and manage their portfolios. Below are the definitions of the primary Greeks, tailored to futures options:

·        Delta: Measures the rate of change in an option’s price for a $1 change in the underlying futures contract’s price. It ranges from 0 to 1 for calls and -1 to 0 for puts. For example, a delta of 0.5 means the option’s price moves $0.50 for every $1 move in the futures price. Delta also approximates the probability the option will expire in-the-money.

·        Gamma: Measures the rate of change in delta for a $1 change in the underlying futures price. It reflects the acceleration of the option’s price movement. High gamma indicates delta is highly sensitive to price changes, which is common for at-the-money options near expiration.

·        Theta: Measures the rate of change in an option’s price due to the passage of time, often called time decay. It’s typically negative, as options lose value as expiration approaches. For example, a theta of -0.05 means the option loses $0.05 per day, all else equal.

·        Vega: Measures the sensitivity of an option’s price to a 1% change in the implied volatility of the underlying futures contract. For example, a Vega of 0.10 means the option’s price increases by $0.10 if implied volatility rises by 1%. Vega is higher for longer-dated options.

·        Rho: Measures the sensitivity of an option’s price to a 1% change in interest rates. For futures options, Rho is often less significant due to typically short maturities and stable interest rates, but it still indicates how much the option price changes with shifts in the risk-free rate.

These Greeks are critical for understanding how factors like price movements, time, volatility, and interest rates impact futures options pricing and risk. If you’d like, I can dive deeper into any specific Greek or provide examples of their application in trading strategies.

 Instant Viewing/Download: Commitment of Traders Report – How to Use?

S
59a24b78 44ed 43f8 b14f 0b4be945165c

December Live Cattle

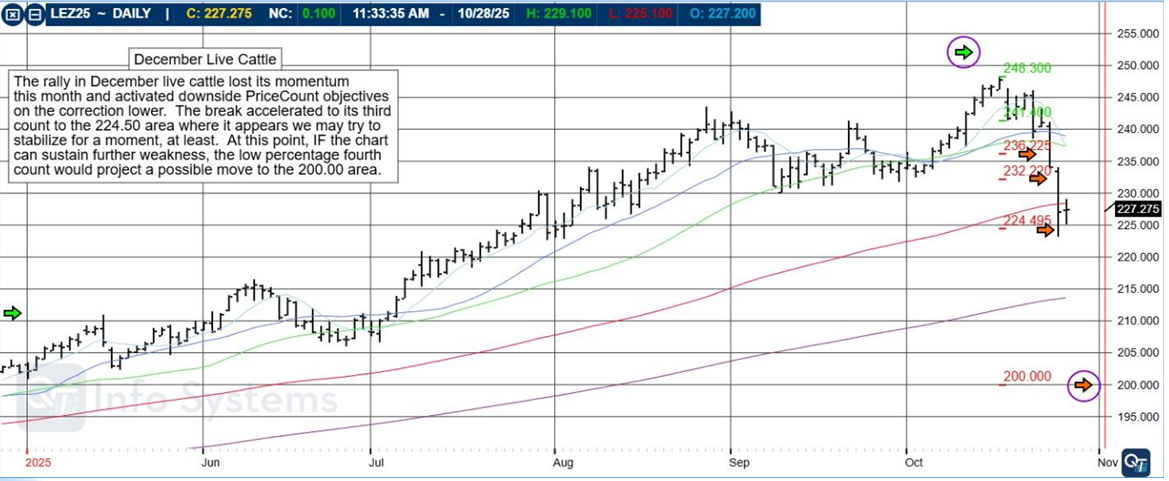
The rally in December live cattle lost its momentum this month and activated downside PriceCount objectives on the correction lower. The break accelerated to its third count to the 224.50 area where it appears we may try to stabilize for a moment, at least. At this point, IF the chart can sustain further weakness, the low percentage fourth count would project a possible move to the 200.00 area.

43b2fa10 2a35 4003 bdcc 632b9fdcca5e

The PriceCount study is a tool that can help to project the distance of a move in price. The counts are not intended to be an ‘exact’ science but rather offer a target area for the four objectives which are based off the first leg of a move with each subsequent count having a smaller percentage of being achieved.

It is normal for the chart to react by correcting or consolidating at an objective and then either resuming its move or reversing trend. Best utilized in conjunction with other technical tools, PriceCounts offer one more way to analyze charts and help to manage your positions and risk. Learn more at www.qtchartoftheday.com

Trading in futures, options, securities, derivatives or OTC products entails significant risks which must be understood prior to trading and may not be appropriate for all investors. Past performance of actual trades or strategies is not necessarily indicative of future results.

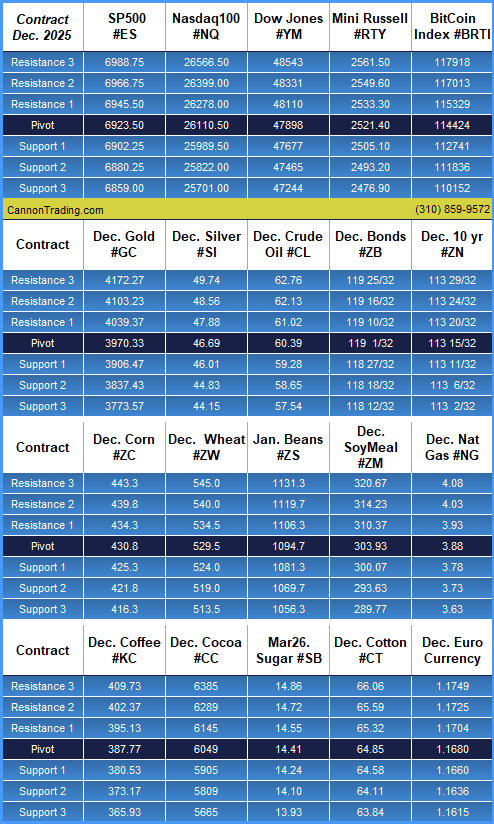
Daily Levels for Oct. 29th, 2025

ef30fe20 a632 49d0 9845 56785a5df235

Want to feature our updated trading levels on your website? Simply paste a small code, and they’ll update automatically every day! 

Click here for quick and easy instructions.

Economic Reports

 U.S. government data may be impacted by the shutdown. ‘Tentative’ events are subject to delay, revision, or cancellation

provided by: ForexFactory.com

All times are Central Time ( Chicago)

ef00758d b25c 4cf9 b8b9 bddb312cea80

Find us on Trustpilot

stars

Trading Futures, Options on Futures, and retail off-exchange foreign currency transactions involves substantial risk of loss and is not suitable for all investors. You should carefully consider whether trading is suitable for you in light of your circumstances, knowledge, and financial resources. You may lose all or more of your initial investment. Opinions, market data, and recommendations are subject to change at any time.

Join our Private Facebook group

Subscribe to our YouTube Channel

Listen to our podcast: Subscribe on AppleSpotify, Amazon

or wherever you listen to podcasts!

S
Facebook  Instagram  LinkedIn
S
ef3ab1c9 8d6d 4e60 a3f1 af5d9d4ecbb3
Services
Software
Tools
Community
Contact

January Beans, Why Many Traders Lose Money Trading Futures (WITH CAN’T MISS VIDEO!!!!), Levels, Reports; Your 4 Need-To-Knows for Trading Futures on October 28th, 2025

9dc1e02e d5f7 4ff4 abf7 1df60775f196

Where is the Edge?

At-a-Glance Levels

Instrument S2 S1 Pivot R1 R2
Gold (GC) — Dec (GCZ5) 3900.53 3953.07 4038.43 4090.97 4176.33
Silver (SI) — Dec (SIZ5) 44.59 45.67 47.13 48.21 49.67
Crude Oil (CL) — Nov (CLX5) 59.92 60.68 61.42 62.18 62.92
 Dec. Bonds (ZB) 117 15/32 118 6/32 118 17/32 119 8/32 119 19/32

beans

Why do Many Traders Lose Money Trading Futures? See presentation below!

thumbnail?url=https%3A%2F%2Fi.vimeocdn
S

January Soybeans

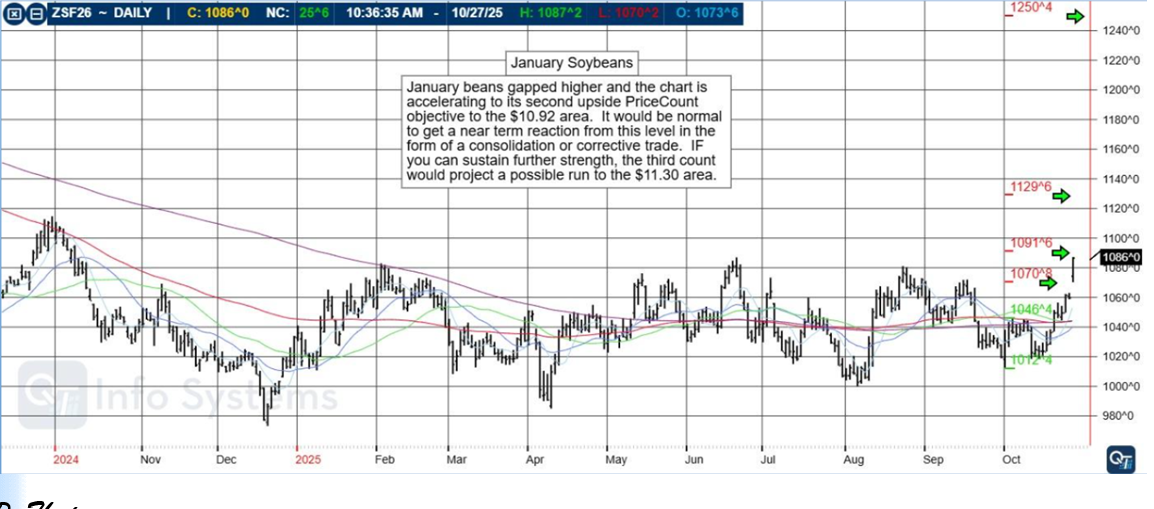
January beans gapped higher and the chart is accelerating to its second upside PriceCount objective to the $10.92 area. It would be normal to get a near term reaction from this level in the form of a consolidation or corrective trade. IF you can sustain further strength, the third count would project a possible run to the $11.30 area.

d44a350e 1c4c 4e07 9b04 ed74d4f4c8ac

The PriceCount study is a tool that can help to project the distance of a move in price. The counts are not intended to be an ‘exact’ science but rather offer a target area for the four objectives which are based off the first leg of a move with each subsequent count having a smaller percentage of being achieved.

It is normal for the chart to react by correcting or consolidating at an objective and then either resuming its move or reversing trend. Best utilized in conjunction with other technical tools, PriceCounts offer one more way to analyze charts and help to manage your positions and risk. Learn more at www.qtchartoftheday.com

Trading in futures, options, securities, derivatives or OTC products entails significant risks which must be understood prior to trading and may not be appropriate for all investors. Past performance of actual trades or strategies is not necessarily indicative of future results.

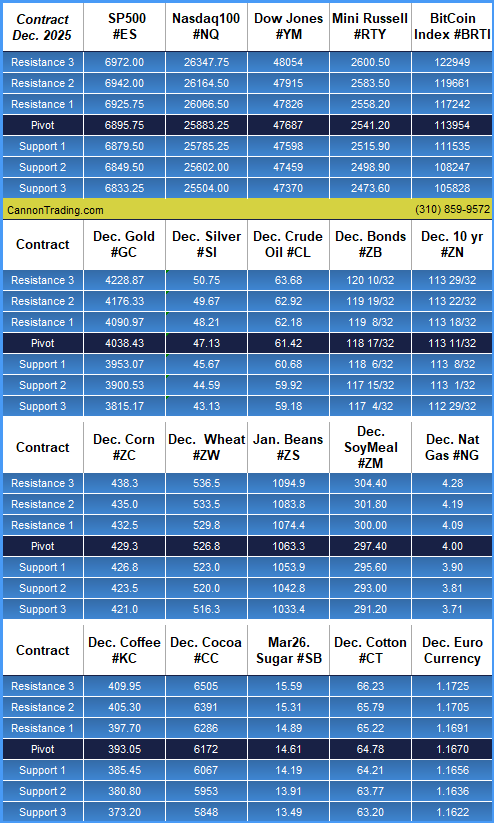
Daily Levels for Oct. 28th, 2025

42866c3e 773b 4a86 b492 26db00f04b78

Want to feature our updated trading levels on your website? Simply paste a small code, and they’ll update automatically every day! 

Click here for quick and easy instructions.

Economic Reports

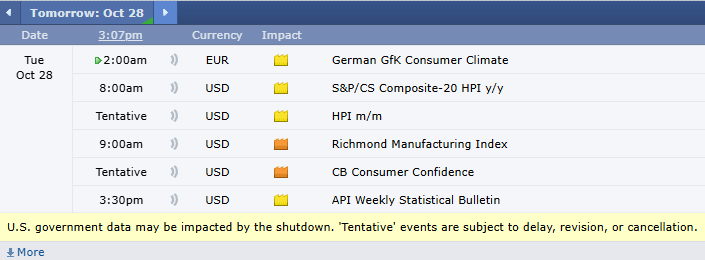
 U.S. government data may be impacted by the shutdown. ‘Tentative’ events are subject to delay, revision, or cancellation

provided by: ForexFactory.com

All times are Central Time ( Chicago)

b0659cfb 4851 4155 9626 6f60f6585105

Find us on Trustpilot

stars

Trading Futures, Options on Futures, and retail off-exchange foreign currency transactions involves substantial risk of loss and is not suitable for all investors. You should carefully consider whether trading is suitable for you in light of your circumstances, knowledge, and financial resources. You may lose all or more of your initial investment. Opinions, market data, and recommendations are subject to change at any time.

Join our Private Facebook group

Subscribe to our YouTube Channel

Listen to our podcast: Subscribe on AppleSpotify, Amazon

or wherever you listen to podcasts!

S
Facebook  Instagram  LinkedIn
S
ef3ab1c9 8d6d 4e60 a3f1 af5d9d4ecbb3
Services
Software
Tools
Community
Contact

Overnight Edge, December Mini Dow, Levels, Reports; Your 4 Important Need-To-Knows for Trading Futures on October 21st, 2025

9dc1e02e d5f7 4ff4 abf7 1df60775f196

Where is the Edge?

edge

At-a-Glance Levels

Instrument S2 S1 Pivot R1 R2
Gold (GC) — Dec (GCZ5) 4173.40 4285.40 4341.70 4453.70 4510.00
Silver (SI) — Dec (SIZ5) 49.49 50.65 51.24 52.40 52.99
Crude Oil (CL) — Nov (CLX5) 55.32 56.16 56.79 57.63 58.26
 Dow Jones (YM) — Dec 2025 46087 46503 46733 47149 47379

Over the past few months, and especially in recent weeks, we’ve seen unusually large overnight moves. Some moves appear random, others reverse quickly, and some are driven by headlines such as tariff news. These dynamics have increased gap risk, reduced overnight liquidity, and produced frequent open-time dislocations.

Common question

Where is the edge?

Short answer

  • Trade the first 30 minutes and focus on short-term gap-fill or rejection setups.
  • Use same-day options when you expect a large directional move to limit tail risk and avoid being stopped out only to see the market move in your favor.
  • Trade spreads when relative strength diverges across instruments (for example, gold vs silver or mini-Dow vs ES).

Extended answer

I want to focus on the practical elements of trading like pre-market context, move behavior, market news correlation, liquidity, options limits, and whether to use mean reversion or momentum. I’ll also want to highlight key parts like risk management, stop placement, and position sizing. Planning should be direct with a simple checklist and no more than six sections. I should also consider using a relevant citation about tariff-related movements, but just one, and make sure it’s only placed where necessary. No framing or extra explanations.

Futures day-trading edge

You find edge by matching a repeatable hypothesis to the current market regime, then executing it with strict risk and execution rules.

Regime diagnosis (what the market is doing now)

  • Volatility regime: large overnight gaps and erratic premarket prints mean the market is in a news-driven, headline-sensitive volatility regime.
  • Catalyst profile: moves are often tied to macro headlines and tariff noise; those headlines create directional gaps that either persist into the session or sharply reverse at the open.
  • Liquidity profile: overnight liquidity is thin and fragmented, increasing slippage and fake outs at the open.

Reliable, tradeable edges you can use

  • Pre-open directional bias with size filter. Trade opens when overnight gap exceeds a threshold (e.g., 0.5% or X ticks) and pre-market order flow confirms (sustained prints, not one-off sweep).
  • Use reduced size and wider stops for gaps caused by headline noise.
  • Fade headline gap into first 30 minutes when structure is weakIf gap lacks follow-through volume and price fails to make a clean microstructure breakout, favor mean reversion to the first-tail or VWAP.
  • Trend-follow breakouts in high conviction regimeWhen overnight move is accompanied by aligned macro flow (rates, FX, commodities) and volume ramps into the open, follow momentum with a continuation plan.
  • Volatility arbitrage playsUse options or calendar spreads where available to sell realized volatility after spikes and buy protection around known headline windows.
  • Session-timing edgeTrade smaller and tighter in the first 15–30 minutes after the open; increase size after the market establishes structure (first clean high/low and confirmation).
  • Microstructure edge: limit vs market tacticsUse passive limit entries near structural levels and aggressive exits into liquidity. Avoid market entries into thin pre-open auction prints.

Concrete execution rules (checklist)

  • Pre-market checklist: identify gap size, top 3 headlines, correlated markets (bonds, FX, oil), and pre-open volume trend.
  • Entry rules: require either structural confirmation (higher high / lower low) or a mean-reversion setup with defined edge-to-risk ratio ≥ 2:1.
  • Sizing: reduce notional by 25–50% on headline-driven nights; increase only after two clean consecutive edges are realized.
  • Stops and targets: place stop where edge invalidates (clearly definable price level); scale out at predefined targets; never trade without a stop.
  • Slippage buffer: add tick buffer to stops and profit targets during thin liquidity opens.

How to test and keep the edge

  • Backtest regime-specific rules: label historical sessions by overnight gap size and headline events, test mean-reversion vs momentum rules separately.
  • Forward-test with small capital: run a two-week rolling simulator and log slippage, win rate, and expectancy.
  • Adaptive rules: codify a volatility threshold that switches you between momentum and fade strategies automatically.

Brief trade plan template

  • Hypothesis: (e.g., “Overnight tariff headline caused a 0.7% gap that lacks confirmatory volume; first 20 minutes will mean-revert to VWAP.”)
  • Entry: limit at VWAP + X ticks or on 1-minute reversal candle.
  • Stop: invalidation beyond the overnight high/low + slippage buffer.
  • Target: partial at VWAP, final at first structure level.
  • Size: 50% normal when gap driver = headline; full size only when macro alignment confirmed.

Be systematic: diagnose regime, pick the strategy that historically wins in that regime, enforce execution and risk rules, and iterate from measured data.

Important: Trading commodity futures and options involves a substantial risk of loss.  

The recommendations contained in this blog are of opinion only and do not guarantee any profits.  

Past performances are not necessarily indicative of future results.

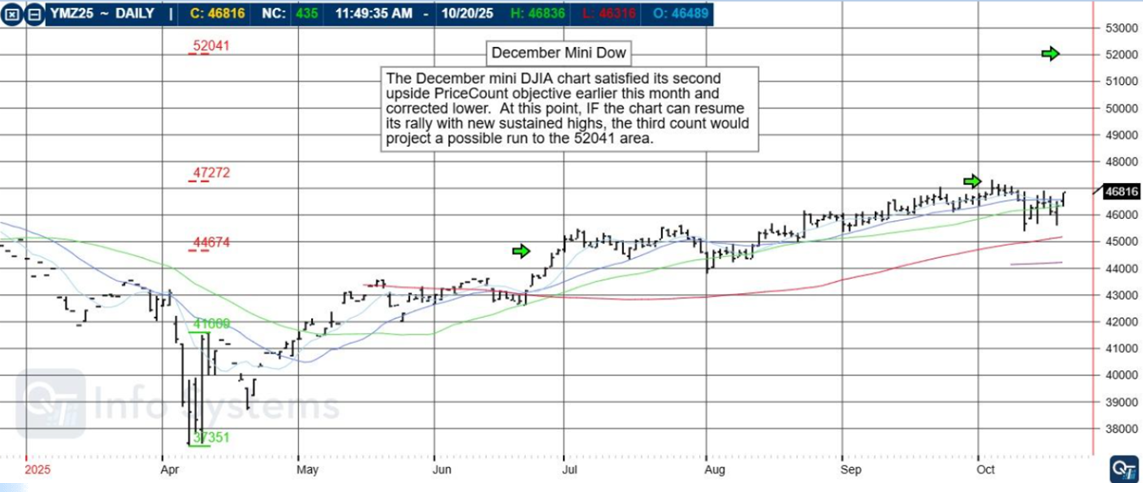
December Mini DOW

The December mini DJIA chart satisfied its second upside PriceCount objective earlier this month and corrected lower. At this point, IF the chart can resume its rally with new sustained highs, the third count would project a possible run to the 52041 area.

ae992987 2d47 4be3 a8d7 b9228ddcdb34

The PriceCount study is a tool that can help to project the distance of a move in price. The counts are not intended to be an ‘exact’ science but rather offer a target area for the four objectives which are based off the first leg of a move with each subsequent count having a smaller percentage of being achieved.

It is normal for the chart to react by correcting or consolidating at an objective and then either resuming its move or reversing trend. Best utilized in conjunction with other technical tools, PriceCounts offer one more way to analyze charts and help to manage your positions and risk. Learn more at www.qtchartoftheday.com

Trading in futures, options, securities, derivatives or OTC products entails significant risks which must be understood prior to trading and may not be appropriate for all investors. Past performance of actual trades or strategies is not necessarily indicative of future results.

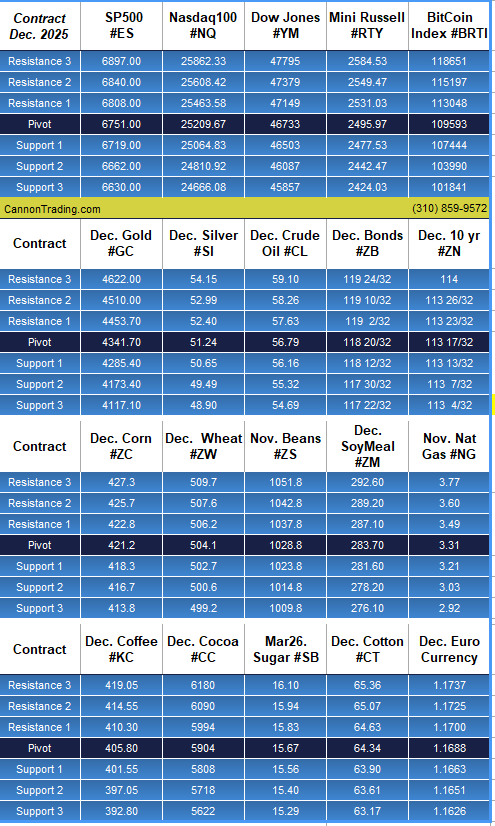
Daily Levels for Oct. 21st, 2025

29a2db9b 5496 4c1a 90af 7b5a30e75999

Want to feature our updated trading levels on your website? Simply paste a small code, and they’ll update automatically every day! 

Click here for quick and easy instructions.

Economic Reports

 U.S. government data may be impacted by the shutdown. ‘Tentative’ events are subject to delay, revision, or cancellation

provided by: ForexFactory.com

All times are Central Time ( Chicago)

584def4f 193c 48ef 8762 24bbb1449316

Find us on Trustpilot

stars

Trading Futures, Options on Futures, and retail off-exchange foreign currency transactions involves substantial risk of loss and is not suitable for all investors. You should carefully consider whether trading is suitable for you in light of your circumstances, knowledge, and financial resources. You may lose all or more of your initial investment. Opinions, market data, and recommendations are subject to change at any time.

Join our Private Facebook group

Subscribe to our YouTube Channel

Listen to our podcast: Subscribe on AppleSpotify, Amazon

or wherever you listen to podcasts!

S
Facebook  Instagram  LinkedIn
S
ef3ab1c9 8d6d 4e60 a3f1 af5d9d4ecbb3
Services
Software
Tools
Community
Contact

Price Extremes: Gold, Silver, Crude Oil; December KC Wheat, Levels, Reports; Your 4 Important Must-Knows for Trading Futures on October 16th, 2025

9dc1e02e d5f7 4ff4 abf7 1df60775f196

Price Extremes

By Mark O’Brien, Senior Broker

price

General:

Day 15 of the U.S Government shutdown.

Stock Index Futures:

Dec. stock index futures returned to solid gains late today as markets remained alert over US-China trade tensions and amid hopes for interest rate cuts and strong quarterly earnings results from Wall Street banks. Traders have cemented bets on a rate cut later this month, and odds of a rate cut in December have jumped in recent days to around 96% according to the CME Group FedWatch tool:

Prices Metals:

It’s the broken record metals report. Dec. gold futures rose to new all-time highs today – its 47th new record of the year – trading up to $4,235.80/ounce intraday.

Alongside gold, Dec. silver rocketed up nearly $2.00/oz. today to set its own all-time record high, trading intraday up to $52.55/ounce. This after yesterday when the contract took out a 45-year-old record closing price of $48.70/ounce, during the time when the Hunt brothers tried to corner the market.

Prices Energies:

November crude oil futures have remained on their lows this week – with a new multi-month intraday low of $58.20/barrel on continued concerns about oversupply and the possible impact on demand of rekindled U.S.-China trade tensions – its fourth day in a row closing below $60/barrel.

Livestock:

Dec. live cattle and Jan. feeder cattle both closed little changed today and within pennies of their own all-time record high closing prices at the close of trading yesterday. Tight supplies and strong feeder markets pushed cash cattle higher and the futures markets followed suit. The supply of cattle has lingered at a near 75-year low, with the closure of the US-Mexico border to Mexican cattle imports further constraining an already tight supply.

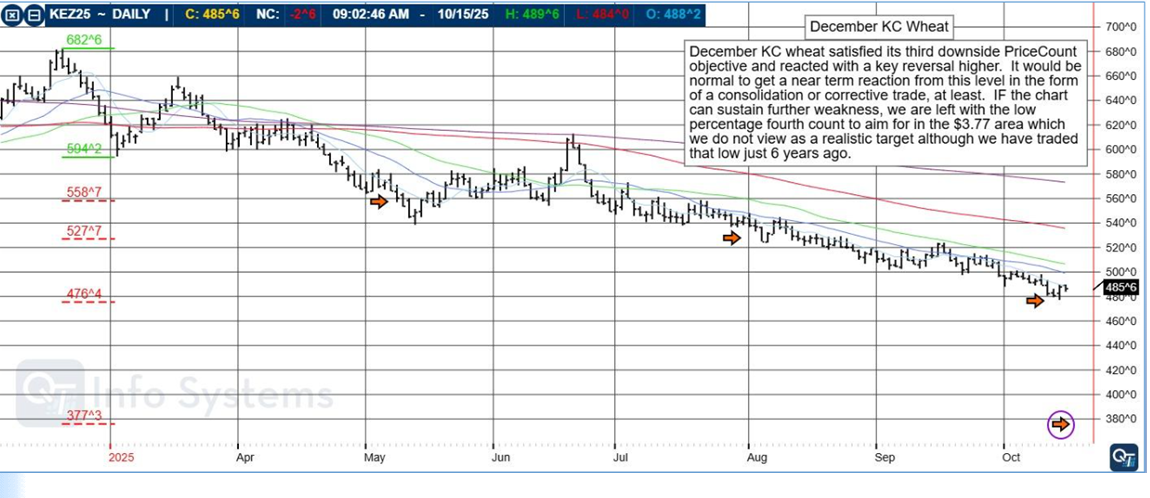
December KC Wheat

December KC wheat satisfied its third downside PriceCount objective and reacted with a key reversal higher. It would be normal to get a mean reversion from this level in the form of a consolidation or corrective phase, at least. If the chart can sustain further weakness, we are left with the low percentage fourth count to aim for in the $4.37 area. That we trade down to this level is a realistic target although we have traded that low just 5 years ago.
1c13b4e3 2017 45b8 95b1 d6fa33b970f3

The PriceCount study is a tool that can help to project the distance of a move in price. The counts are not intended to be an ‘exact’ science but rather offer a target area for the four objectives which are based off the first leg of a move with each subsequent count having a smaller percentage of being achieved.

It is normal for the chart to react by correcting or consolidating at an objective and then either resuming its move or reversing trend. Best utilized in conjunction with other technical tools, PriceCounts offer one more way to analyze charts and help to manage your positions and risk. Learn more at www.qtchartoftheday.com

Trading in futures, options, securities, derivatives or OTC products entails significant risks which must be understood prior to trading and may not be appropriate for all investors. Past performance of actual trades or strategies is not necessarily indicative of future results.

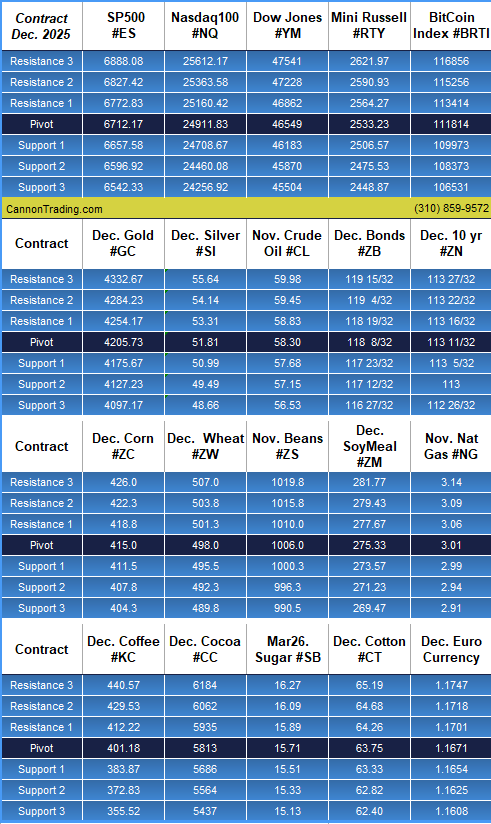
Daily Levels for Oct. 16th, 2025

e61dfc9c d657 475c a0a4 a04e2f557b54

Want to feature our updated trading levels on your website? Simply paste a small code, and they’ll update automatically every day! 

Click here for quick and easy instructions.

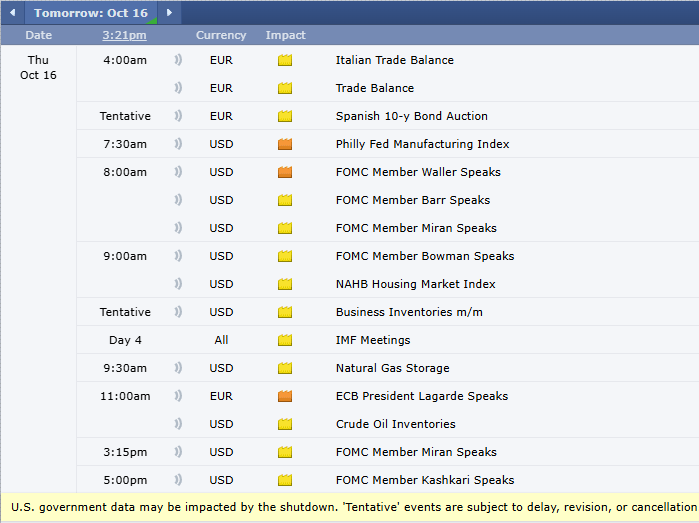
Economic Reports

 U.S. government data may be impacted by the shutdown. ‘Tentative’ events are subject to delay, revision, or cancellation

provided by: ForexFactory.com

All times are Central Time ( Chicago)

fa8ff153 1a04 4f4e af5c 453004f6ed84

Find us on Trustpilot

stars

Trading Futures, Options on Futures, and retail off-exchange foreign currency transactions involves substantial risk of loss and is not suitable for all investors. You should carefully consider whether trading is suitable for you in light of your circumstances, knowledge, and financial resources. You may lose all or more of your initial investment. Opinions, market data, and recommendations are subject to change at any time.

Join our Private Facebook group

Subscribe to our YouTube Channel

Listen to our podcast: Subscribe on AppleSpotify, Amazon

or wherever you listen to podcasts!

S
Facebook  Instagram  LinkedIn
S
ef3ab1c9 8d6d 4e60 a3f1 af5d9d4ecbb3
Services
Software
Tools
Community
Contact


Volatility Tuesday! All-time Highs on Gold, December Cocoa, Levels, Reports; Your 5 Important Must-Knows for Trading Futures on October 14th, 2025

9dc1e02e d5f7 4ff4 abf7 1df60775f196

Volatility – New All Time High on Gold!

volatility

The last few trading sessions we saw tremendous volatility across many markets.

What we witnessed last night and during today’s session reminded me of the markets when COVID first broke out and we saw limit moves across the board.

The moves down Friday on equities, metals and other markets and then the HUGE GAP open yesterday on the Sunday afternoon re-open were a bit SCARY to be honest but also present some large potentials as well.

New All-time highs on gold!!

Here are some ideas to explore during times like these:

1.      You don’t have a crystal ball.

To think you can buy an ES contract in this volatility and use a 2 point stop in hopes of making 20 points profit is a very low probability event…you would need to buy it at the PEREFECT time for this to happen. Point is, with higher volatility you need to use WIDER stops to give yourself a chance. That may mean using SMALLER trade size.

2.      If you are able to,

share your read with another trader,

it may provide you with a better perspective just by sharing.

3.      If you think there is room for a big move or what we call a “runner” –

be prepared to for the pullbacks.

Use multiple time frames to gain a better perspective and hang in there for the big move, if this is what you think can happen.

4.      If you have enough risk capital, try to use multiple contracts, example buying 2 rather than 1. Taking profit on the first part of the position will help you relax and look at what the market is really telling you rather than what you would like it to say. It helps reduce both the fear and the greed.

5. “Plan your trade, trade your plan”.

Again, these are just some short pointers, written quickly after today’s session in hopes of helping you when you face a similar situation.

S
0d2eda99 dc22 4a53 a1e3 b347a3c01bf5

December Cocoa

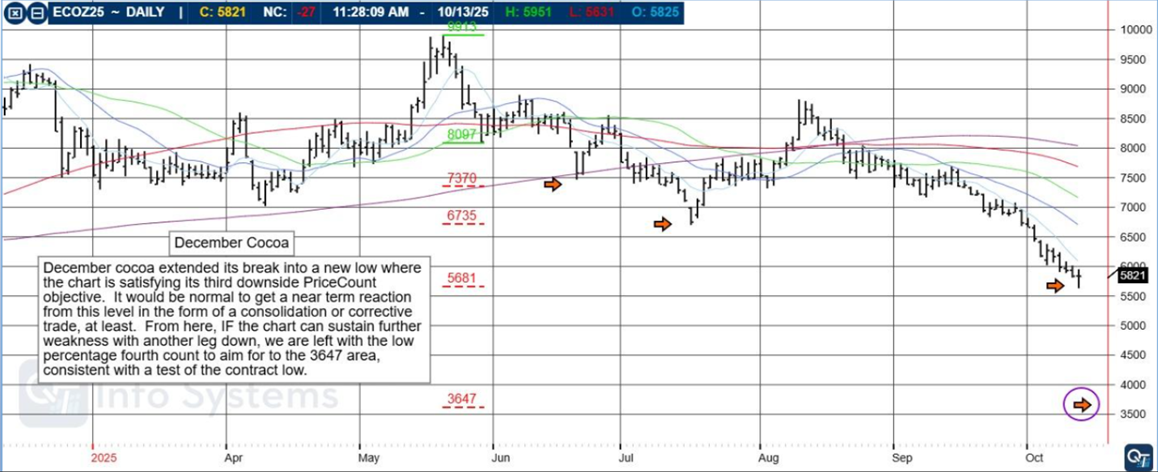
December cocoa extended its break into a new low where the chart is satisfying its third downside PriceCount objective. It would be normal to get a near term reaction from this level in the form of a consolidation or corrective trade, at least. From here, IF the chart can sustain further weakness with another leg down, we are left with the low percentage fourth count to aim for to the 3647 area, consistent with a test of the contract low.

4fc16cdb 3311 451c 9d9c fc0e3d018be3

The PriceCount study is a tool that can help to project the distance of a move in price. The counts are not intended to be an ‘exact’ science but rather offer a target area for the four objectives which are based off the first leg of a move with each subsequent count having a smaller percentage of being achieved.

It is normal for the chart to react by correcting or consolidating at an objective and then either resuming its move or reversing trend. Best utilized in conjunction with other technical tools, PriceCounts offer one more way to analyze charts and help to manage your positions and risk. Learn more at www.qtchartoftheday.com

Trading in futures, options, securities, derivatives or OTC products entails significant risks which must be understood prior to trading and may not be appropriate for all investors. Past performance of actual trades or strategies is not necessarily indicative of future results.

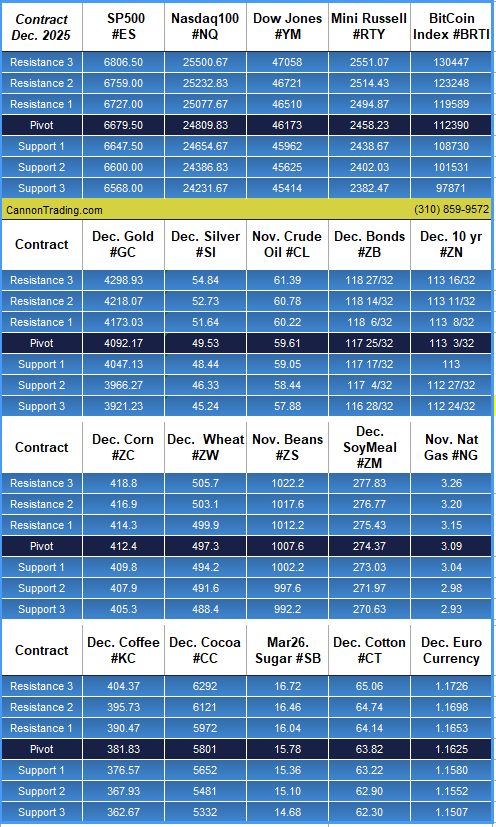
Daily Levels for Oct. 14th, 2025

939b9f3f 2148 41e4 90b0 dd5ff662f77b

Want to feature our updated trading levels on your website? Simply paste a small code, and they’ll update automatically every day! 

Click here for quick and easy instructions.

Economic Reports

 U.S. government data may be impacted by the shutdown. ‘Tentative’ events are subject to delay, revision, or cancellation

provided by: ForexFactory.com

All times are Central Time ( Chicago)

7a3ff6ce 575a 4e51 86ec fada6469142b

Find us on Trustpilot

stars

Trading Futures, Options on Futures, and retail off-exchange foreign currency transactions involves substantial risk of loss and is not suitable for all investors. You should carefully consider whether trading is suitable for you in light of your circumstances, knowledge, and financial resources. You may lose all or more of your initial investment. Opinions, market data, and recommendations are subject to change at any time.

Join our Private Facebook group

Subscribe to our YouTube Channel

Listen to our podcast: Subscribe on AppleSpotify, Amazon

or wherever you listen to podcasts!

S
Facebook  Instagram  LinkedIn
S
ef3ab1c9 8d6d 4e60 a3f1 af5d9d4ecbb3
Services
Software
Tools
Community
Contact

Gold continues its Breakout Amid Potential Gov. Shutdown, December Bean Oil, Hedging Strategies, Levels, Reports – The Important Must-Knows for Trading Futures on September 24th, 2025

9dc1e02e d5f7 4ff4 abf7 1df60775f196

Movers and Shakers: Gold Breakout Meets Shutdown Risk: Hedging Strategies Explained

By John Thorpe, Senior Broker

gold

The U.S Governments’ fiscal year concludes at the end of the third quarter. Expect more volatility as we wait to see how traders bet on whether or not Congress can pass appropriations bills to keep the U.S. Government open for business. The Government, in the past, shut down most recently in 2018. Prior to that? 2013, 1995 and 1994. Gold prices rallied during the shutdowns in the past. But what if there is no shutdown?

Gold has been on the move since we had a breakup! (breakout to the upside) from the 5-month rangebound trade, ($3200-$3500) basis the December gold contract. Since September 2nd, gold has rallied in 3 weeks over $300 per troy oz. to $3810.00, if your crystal ball had you long Gold and you want to protect your current gains, what follows are a few Ideas you can implement using futures options. Consult with your Cannon Trading broker (800 454 9572 or 310 859 9572) for clarity.

Calculate the size you will be hedging: Calculate the number of contracts as (Portfolio Value / Gold Price × 100 oz)). For a $760,000 long position at $3,800/oz, use ~2 contracts.

Strategy 1: Protective Put (Straightforward Downside Insurance)

Buy put options on gold futures to gain if gold prices fall, offsetting losses in your long position. This is ideal for strong bullish views but with short-term downside concerns.

Steps to Implement:

  1. Assess Exposure: Determine your long position’s value.
  2. Choose Strike and Expiration: Out-of-the-money (OTM) puts (e.g., 5-10% below current price, like $3,600 strike at $3,800 spot) for cheaper premiums; at-the-money (ATM) for fuller protection. Use 1-3 month expirations for flexibility.
  3. Execute: Buy puts via a futures-approved broker (e.g., Cannon Trading). Premium: ~1-5% of notional (e.g., $500-$2,000 per contract at 20% implied vol).

Example:

  • Gold at $3,800; buy $3,600 put expiring in 2 months for $150/oz premium ($15,000/contract).
  • If gold drops to $3,400: Put worth ~$200/oz (intrinsic value), hedging $20,000 loss per contract in your long position.
  • If gold rises: Lose only the premium, but keep gains.

Pros: Retains unlimited upside; simple. Cons: Premium decays over time (theta); costly in low-vol environments.

Strategy 2: Collar (Low-Cost or Zero-Cost Hedge)

Buy a protective put and sell an OTM call to finance it. This caps upside but provides free/cheap downside protection—suitable for neutral to mildly bullish outlooks in volatile markets.

Steps to Implement:

  1. Buy Put: OTM (e.g., $3,600 strike).
  2. Sell Call: OTM above spot (e.g., $4,000 strike) with same expiration.
  3. Match Sizing: Same number of contracts as your exposure.
  4. Execute: Net premium near zero if call income matches put cost (adjust strikes for balance).

Example:

  • Buy $3,600 put ($150/oz premium); sell $4,000 call (collect $150/oz).
  • Net cost: $0.
  • Protection below $3,600; upside capped at $4,000 (may need to close if called away) Pros: Minimizes upfront cost; effective in sideways markets. Cons:                                   Limits gains; potential assignment on calls.

Strategy 3: Bear Put Spread (Defined-Risk, Lower-Cost Protection)

Buy a higher-strike put and sell a lower-strike put for partial hedge at reduced cost. Best for moderate downside expectations without full insurance.

Steps to Implement:

  1. Select Strikes: Buy ATM/OTM put (e.g., $3,800); sell further OTM (e.g., $3,400).
  2. Expiration: 1-6 months.
  3. Contracts: Match exposure.
  4. Execute: Net debit = Long put cost minus short put premium (e.g., $200/oz debit = $20,000/contract).

Example:

  • Buy $3,800 put ($250/oz); sell $3,400 put (collect $50/oz). Net: $200/oz.
  • Max hedge benefit: $400/oz spread minus debit ($200/oz profit if gold < $3,400).
  • Limited protection to spread width.
  • Pros: Cheaper than naked puts; caps max loss. Cons: No protection below short strike; less flexible.
S

December Bean Oil

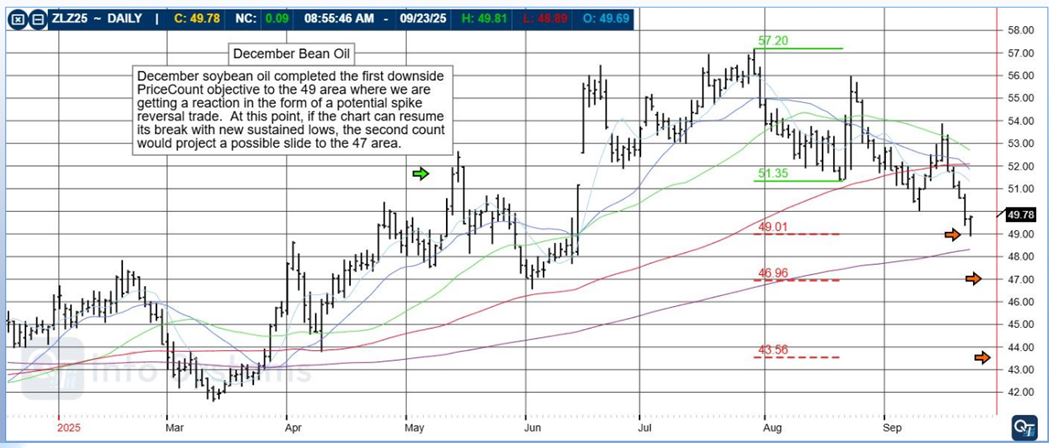
December soybean oil completed the first downside PriceCount objective to the 49 area where we are getting a reaction in the form of a potential spike reversal trade. At the point, if the chart can resume its break with the new sustained lows, the second count would project a possible slide in the 47 area.

a16f8be8 983d 4222 b93a da8292fae4bc

The PriceCount study is a tool that can help to project the distance of a move in price. The counts are not intended to be an ‘exact’ science but rather offer a target area for the four objectives which are based off the first leg of a move with each subsequent count having a smaller percentage of being achieved.

It is normal for the chart to react by correcting or consolidating at an objective and then either resuming its move or reversing trend. Best utilized in conjunction with other technical tools, PriceCounts offer one more way to analyze charts and help to manage your positions and risk. Learn more at www.qtchartoftheday.com

Trading in futures, options, securities, derivatives or OTC products entails significant risks which must be understood prior to trading and may not be appropriate for all investors.

Past performance of actual trades or strategies is not necessarily indicative of future results.

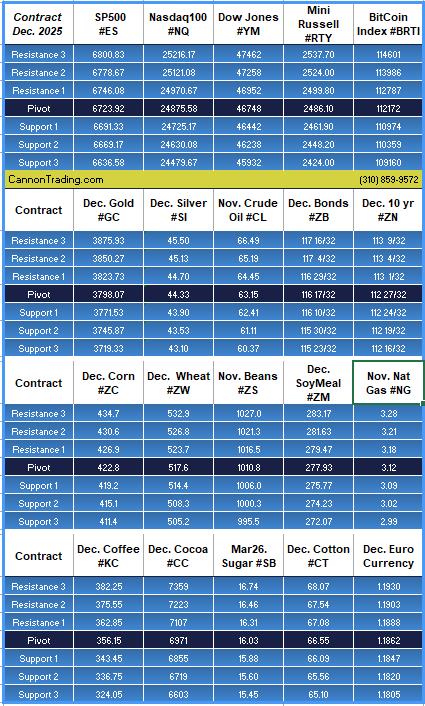
Daily Levels for Sept. 24th, 2025

a2779173 7e4f 490e a6cd 34da1dd9c9b1

Want to feature our updated trading levels on your website? Simply paste a small code, and they’ll update automatically every day! 

Click here for quick and easy instructions.

Economic Reports

provided by: ForexFactory.com

All times are Eastern Time ( New York)

f782807a 39ee 4ffc b8f2 1cfec7744d0b

Find us on Trustpilot

stars

Trading Futures, Options on Futures, and retail off-exchange foreign currency transactions involves substantial risk of loss and is not suitable for all investors. You should carefully consider whether trading is suitable for you in light of your circumstances, knowledge, and financial resources. You may lose all or more of your initial investment. Opinions, market data, and recommendations are subject to change at any time.

Join our Private Facebook group

Subscribe to our YouTube Channel

Listen to our podcast: Subscribe on AppleSpotify, Amazon

or wherever you listen to podcasts!

S
Facebook  Instagram  LinkedIn
S
ef3ab1c9 8d6d 4e60 a3f1 af5d9d4ecbb3
Services
Software
Tools
Community
Contact

Thinking Your Trading Through, Dec. Bean Oil, Levels, Reports; Your 4 Important Must-Knows for Trading Futures on September 11th, 2025

9dc1e02e d5f7 4ff4 abf7 1df60775f196

Take an Extra Second When Trading

by Senior Broker, Mark O’Brien


trading

General:

It was suggested that for today’s blog I throw out a piece of trade advice and one straightforward yet essential one quickly came to mind: make sure the trade you want to place is the trade you’re about to place. Trade errors often occur when you intend to place an order you’ve placed time and time again only to realize this time you missed something.

You wanted to buy and instead you sold; you wanted to place a stop order and instead you placed a limit order – and got filled; you wanted to buy a spread – options or futures – and instead you sold – and now you’ve erred twice.

If they’re orders you’ve placed time and time again there’s typically a sense of self-assurance that this time is no different than your past successfully placed orders. It’s habitual; it’s almost automatic. Don’t let that reasoning creep into your trading. Instead – for every order – engage a small amount of time and brain power to review what you’re about to do.

The basics include: are you trading the right month? How soon are the dates on the calendar when you need to be out of the contract. For day traders, are you entering the market or exiting? Are you adding to your position or reducing it? Do you have other orders from a prior trade that need cancelling? Should the order be a day order or a good-‘til-cancelled?

Often orders placed in error are recognized quickly and can be corrected quickly with little or no fallout, but it’s a far better trader who is engaged with their trading at the order entry. It’s at this point – for every order – when you can review and evaluate your order for accuracy.

S
c063cc4f c499 48f5 a7d3 8b226e13a1c0

Dec. Bean Oil

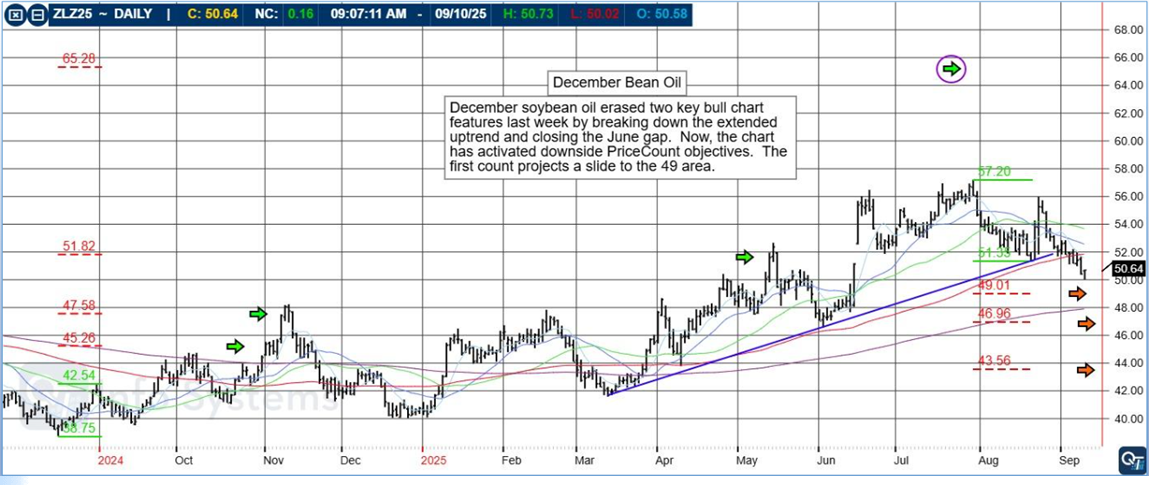
December soybean oil erased two key bull chart features last week by breaking down the extended uptrend and closing the June gap. Now, the hcart has activated downside PriceCount objectives. The first count projects a slide to the 49 area.

9dcaf869 a6d8 46e2 973f ee0bcb7730a8

The PriceCount study is a tool that can help to project the distance of a move in price. The counts are not intended to be an ‘exact’ science but rather offer a target area for the four objectives which are based off the first leg of a move with each subsequent count having a smaller percentage of being achieved.

It is normal for the chart to react by correcting or consolidating at an objective and then either resuming its move or reversing trend. Best utilized in conjunction with other technical tools, PriceCounts offer one more way to analyze charts and help to manage your positions and risk. Learn more at www.qtchartoftheday.com

Trading in futures, options, securities, derivatives or OTC products entails significant risks which must be understood prior to trading and may not be appropriate for all investors. Past performance of actual trades or strategies is not necessarily indicative of future results.

Daily Levels for Sept. 11th, 2025

f61fcf87 4936 49ee a217 5d0dd4cdb218

Want to feature our updated trading levels on your website? Simply paste a small code, and they’ll update automatically every day! 

Click here for quick and easy instructions.

1b504f34 4240 4608 ac41 00d25ef52c4f

Economic Reports

provided by: ForexFactory.com

All times are Eastern Time ( New York)

02bd0396 4f6a 41e8 8c36 bbe8db7272b1

Find us on Trustpilot

stars

Trading Futures, Options on Futures, and retail off-exchange foreign currency transactions involves substantial risk of loss and is not suitable for all investors. You should carefully consider whether trading is suitable for you in light of your circumstances, knowledge, and financial resources. You may lose all or more of your initial investment. Opinions, market data, and recommendations are subject to change at any time.

Join our Private Facebook group

Subscribe to our YouTube Channel

Listen to our podcast: Subscribe on AppleSpotify, Amazon

or wherever you listen to podcasts!

S
Facebook  Instagram  LinkedIn
S
ef3ab1c9 8d6d 4e60 a3f1 af5d9d4ecbb3
Services
Software
Tools
Community
Contact

Cattle, Crude Oil, Levels, Reports, Highlights; Your 5 Important Need-To-Knows for Trading Futures on August 28th, 2025

9dc1e02e d5f7 4ff4 abf7 1df60775f196

Bullet Points, Highlights, Announcements

Cattle

By Mark O’ Brien, Senior Broker

cattle

General:

Within the last 12 months the futures markets have seen an impressive list of bullish moves up to all-time record highs:

Stock indexes, i.e., YM (Aug.): ±45,840

Gold (April): ±3,485/oz.

Copper (July): ±$5.89/lb.

Coffee (Feb.): ±$4.40/lb.

Bitcoin: (Aug.) ±$125,200

Cocoa (Dec. ’24) ±$12,931/metric ton

Orange juice (Sept. ’24): ± $5.89/lb.

Yet maybe the most dynamic futures market moves to all-time record highs – traded up to that level just today – can be seen in the Live Cattle and Feeder Cattle futures contracts. Since the first of the year, the two current front month futures contracts – Aug. – have made ±30% and ±26% price gains representing ±$23K and ±$48K per contract moves, respectively.

On the fundamental front, U.S. cattle inventories have plunged to their lowest levels since the early 1950s. As of this year, inventories are at or near 86 million head – the lowest in over 70 years. It has also been exceptionally dry across the heartland in recent years which has limited grazing acreage for cattle. Adding to these conditions, there is currently a ban on all cattle imports from Mexico due to the spread in that country of a devastating livestock pest called New World screwworm. Mexico is a leading source of cattle imports to meet U.S. beef demand, along with Canada.

There seems to be no real signs of stopping. Herd rebuilding takes years, not months and with herd sizes hitting multi-decade lows and producers cautious, supply won’t rebound quicky. Even if pasture conditions improve and ranchers begin to retain heifers to rebuild herds, analysts expect tight supply conditions will persist for several years.

S
c063cc4f c499 48f5 a7d3 8b226e13a1c0
eb23d89b a6ee 494c a74a 38b5f4e886e7

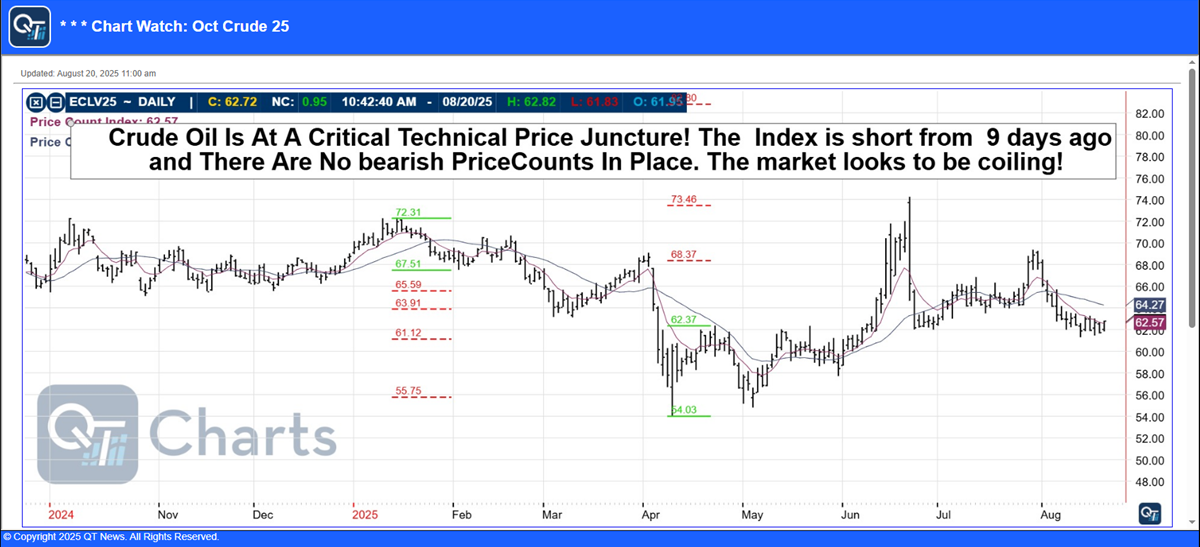
Chart Watch: Oct Crude 25

“Crude Oil Is at a Critical Technical Price Juncture! The Index is short from 9 days ago and There Are No bearish PriceCounts in Place. The market looks to be coiling!”

ad2ac0ce d30e 4d97 bf1f c28453fbaba3

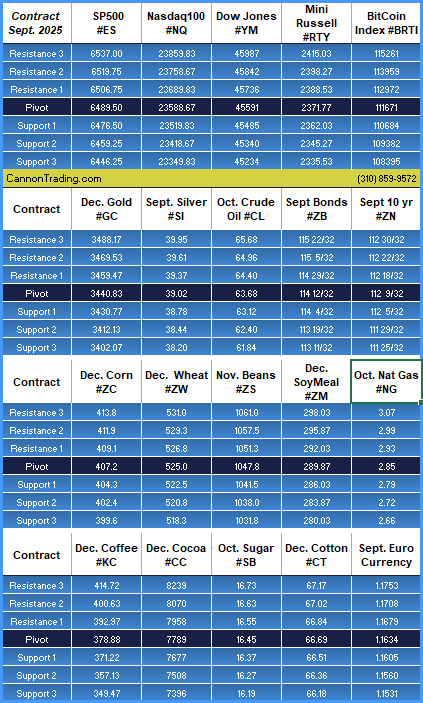
Daily Levels for Aug. 28th, 2025

aa455ea8 8bfc 4a7e b44f 77407c32cd34

Want to feature our updated trading levels on your website? Simply paste a small code, and they’ll update automatically every day! 

Click here for quick and easy instructions.

Economic Reports

provided by: ForexFactory.com

All times are Eastern Time ( New York)

ab608954 d4a7 45ac a353 eb9beae33549

Find us on Trustpilot

stars

Trading Futures, Options on Futures, and retail off-exchange foreign currency transactions involves substantial risk of loss and is not suitable for all investors. You should carefully consider whether trading is suitable for you in light of your circumstances, knowledge, and financial resources. You may lose all or more of your initial investment. Opinions, market data, and recommendations are subject to change at any time.

Join our Private Facebook group

Subscribe to our YouTube Channel

Listen to our podcast: Subscribe on AppleSpotify, Amazon

or wherever you listen to podcasts!

S
Facebook  Instagram  LinkedIn
S
ef3ab1c9 8d6d 4e60 a3f1 af5d9d4ecbb3
Services
Software
Tools
Community
Contact

Volatility, December Oats, Levels, Reports; Your 4 Important Need-To-Knows for Trading Futures on August 19th, 2025

9dc1e02e d5f7 4ff4 abf7 1df60775f196

Volatility

Quiet Start to the Week—Volatility Ahead with Powell & PMI

volatility

️ Monday Market Brief – August 18, 2025

Low Volume, Calm Waters… Before the Storm?

Today’s trading session opened with notably light volume across major asset classes—a familiar rhythm for an August Monday. With many market participants still in vacation mode and key macro events on the horizon, it’s no surprise we’re seeing range-bound price action and muted volatility.

That calm won’t last long. By Thursday, the tempo is expected to shift dramatically as a wave of economic data hits the tape. PMI reports and the Philadelphia Fed survey will headline the day, offering fresh clues on growth and inflation trends. Then on Friday, all eyes will turn to Fed Chair Jerome Powell’s remarks following the Jackson Hole symposium—a moment that often sets the tone for monetary policy heading into Q4.

 Trading Insight

Recognizing the type of day ahead—like today’s low-volatility, sideways grind—can dramatically improve your tactical edge. In environments like this, fading the extremes of volume or volatility bands (buying the lows, selling the highs) tends to outperform breakout strategies. Of course, it’s always easier to see the ideal play in hindsight—but developing that intraday awareness is a skill worth sharpening.

Stay nimble, stay curious, and keep your powder dry for the back half of the week.

S
Joseph Easton, breaks down trading options in ten easy steps.

December Oats

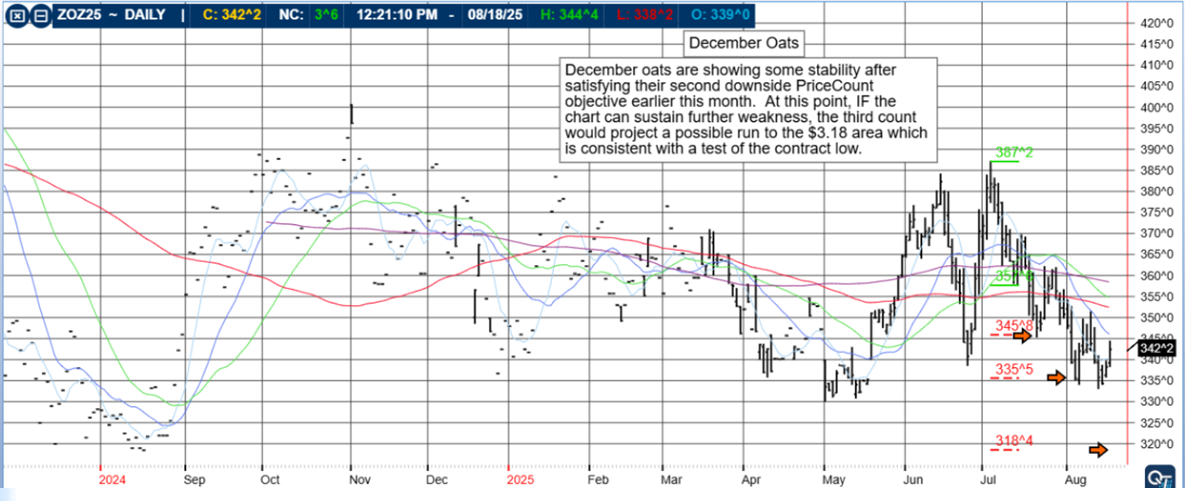
December oats are showing some stability after satisfying their second downside PriceCount objective earlier this month. At this point, IF the chart can sustain further weakness, the third count would project a possible run to the $3.18 area which is consistent with a test of the contract low.

And that’s December Oats for you, Traders! Make it a great trading week!

0fb2d20d 2755 49dd 84c8 8296825f4d76

The PriceCount study is a tool that can help to project the distance of a move in price. The counts are not intended to be an ‘exact’ science but rather offer a target area for the four objectives which are based off the first leg of a move with each subsequent count having a smaller percentage of being achieved.

It is normal for the chart to react by correcting or consolidating at an objective and then either resuming its move or reversing trend. Best utilized in conjunction with other technical tools, PriceCounts offer one more way to analyze charts and help to manage your positions and risk. Learn more at www.qtchartoftheday.com

Trading in futures, options, securities, derivatives or OTC products entails significant risks which must be understood prior to trading and may not be appropriate for all investors.

Past performance of actual trades or strategies is not necessarily indicative of future results.

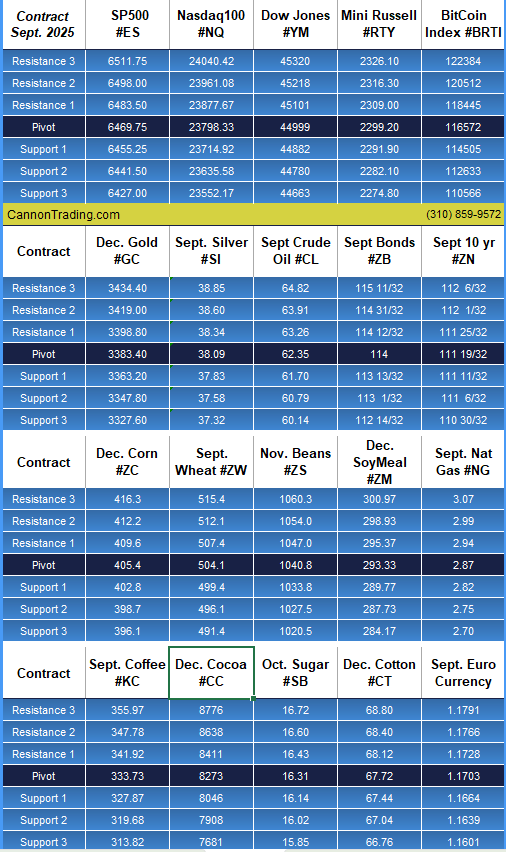
Daily Levels for Aug 19th, 2025

0c7cb067 41e4 43bf b704 38bd1fa23649

Want to feature our updated trading levels on your website? Simply paste a small code, and they’ll update automatically every day! 

Click here for quick and easy instructions.

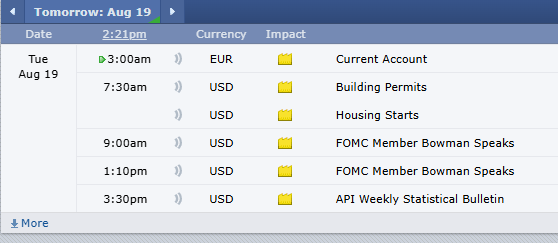
Economic Reports

provided by: ForexFactory.com

All times are Eastern Time ( New York)

4d575084 c4b8 4aec b18b 6cffc353e757

Find us on Trustpilot

stars

Trading Futures, Options on Futures, and retail off-exchange foreign currency transactions involves substantial risk of loss and is not suitable for all investors. You should carefully consider whether trading is suitable for you in light of your circumstances, knowledge, and financial resources. You may lose all or more of your initial investment. Opinions, market data, and recommendations are subject to change at any time.

Join our Private Facebook group

Subscribe to our YouTube Channel

Listen to our podcast: Subscribe on AppleSpotify, Amazon

or wherever you listen to podcasts!

S
Facebook  Instagram  LinkedIn
S
ef3ab1c9 8d6d 4e60 a3f1 af5d9d4ecbb3
Services
Software
Tools
Community
Contact