Why Use Tick & Volume Charts, Mini NQ Review and Support & Resistance Levels 2.23.2021

_________________________________________________

Voted #1 Blog and #1 Brokerage Services on TraderPlanet for 2016!!  

_________________________________________________

Dear Traders,

Like us on FaceBook!
Get Real Time updates and market alerts on Twitter!
Why I like to use tick and volume charts for scalping
Today I decided to touch more on an educational feature rather than provide a certain market outlook.
Many of my clients and blog readers know that when it comes to short term trading I am a fan of using volume charts, tick charts, range bar charts and Renko charts rather than the traditional time charts like the 1 minutes, 5 minutes etc.
My rule of thumb is that if you as a trader make decisions based on charts that are less than 15 minutes time frame, it may be worth your time to research, back test and do some homework as to potentially using other type of charts like volume charts , Range charts etc.
Volume charts will draw a new bar once a user defined number of contracts traded. Example mini SP 10,000 volume chart will draw a new bar once 10,000 contracts traded.
Range bar charts will draw new charts once price action has exceeded a user pre define price or ticks range. Example might be an 18 ticks range bar chart on crude oil.
While the volume charts rely ONLY on volume, the range bar charts rely ONLY on price action.
Their main advantage over traditional time charts is twofold in my opinion:
1. If the market is moving fast, reports came out or there is heavy volume in the market, the traditional 5 minute chart will need 5 minutes to complete the next bar before it provides you with a signal…if you day traded futures before you will know what 5 minutes can do….The volume charts or range bar charts in this case will complete the bars MUCH faster because there is strong price action and strong volume and will be able to provide a signal faster than the time charts.
2. On the flip side, there are times when the market is dead…low volume, sideways, choppy action. If you are using the 3 minute chart and a moving avg. cross over, you may get a signal simple because time has passed and the moving averages crossed even though the market is pretty dead….If you are using a volume chart and the market is slow…it will take a while for the bars to complete and hence it may filter out some “noise” in the market.
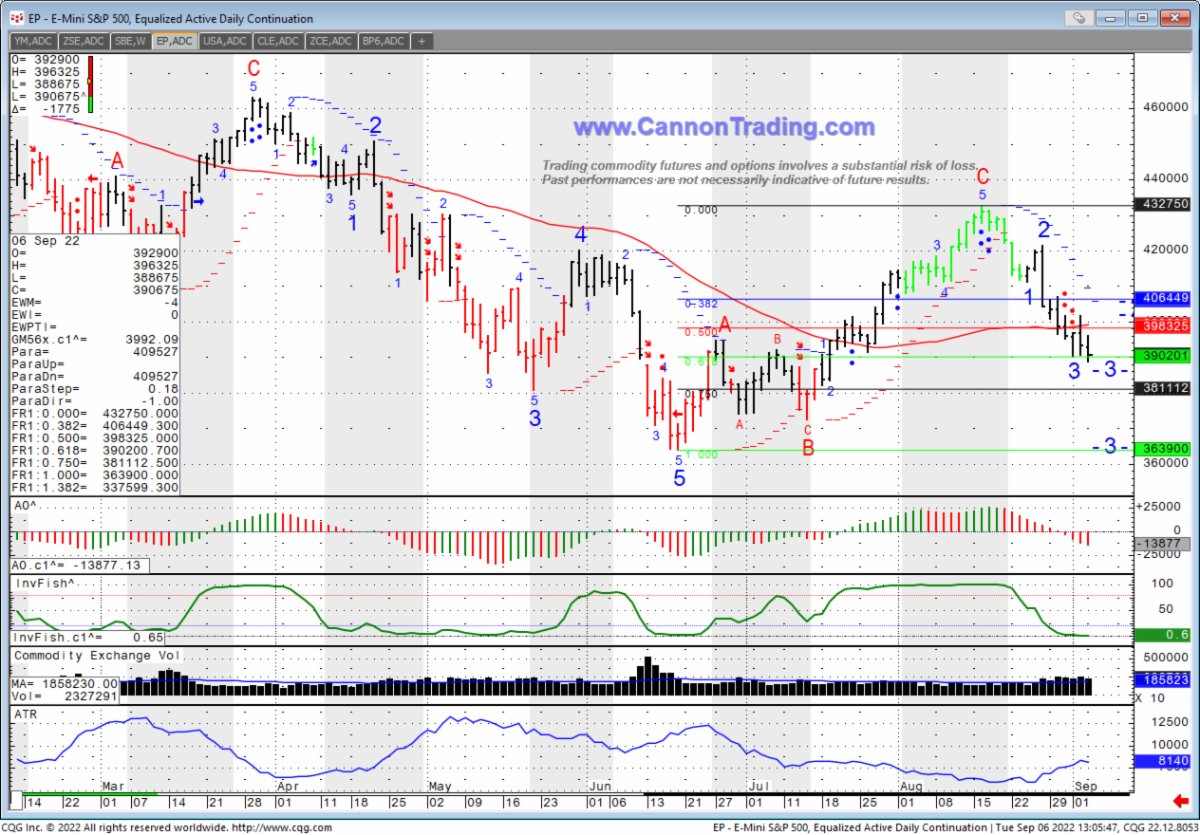
Below is a 5,000 CVB ( constant volume Bar) of the NQ. If you like a free trial to the “turning points indicators” highlighted in the charts below or to discuss more in depth different charts and strategies, feel free to visit us!
Mini NQ Volume Bar Chart
Mini Nasdaq Futures Volume Bar Chart

Good Trading

Trading Futures, Options on Futures, and retail off-exchange foreign currency transactions involves substantial risk of loss and is not suitable for all investors.  You should carefully consider whether trading is suitable for you in light of your circumstances, knowledge, and financial resources. You may lose all or more of your initial investment. Opinions, market data, and recommendations are subject to change at any time when it comes to Futures Trading.


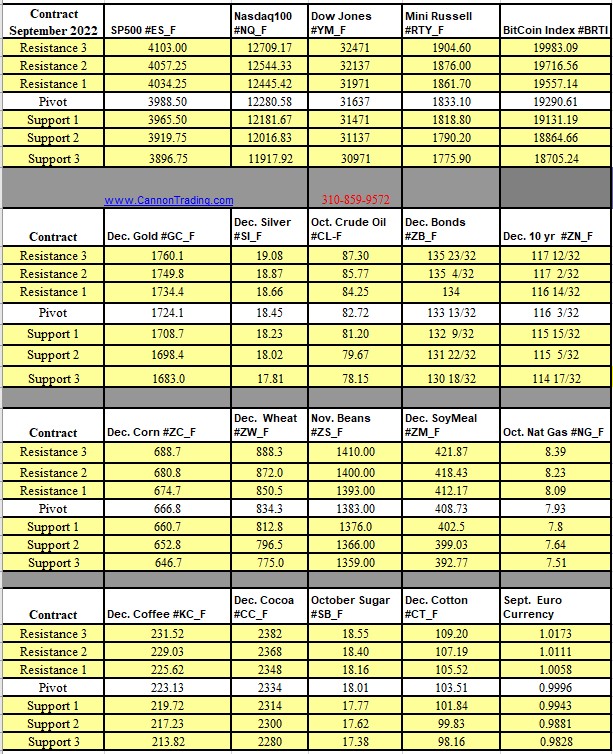
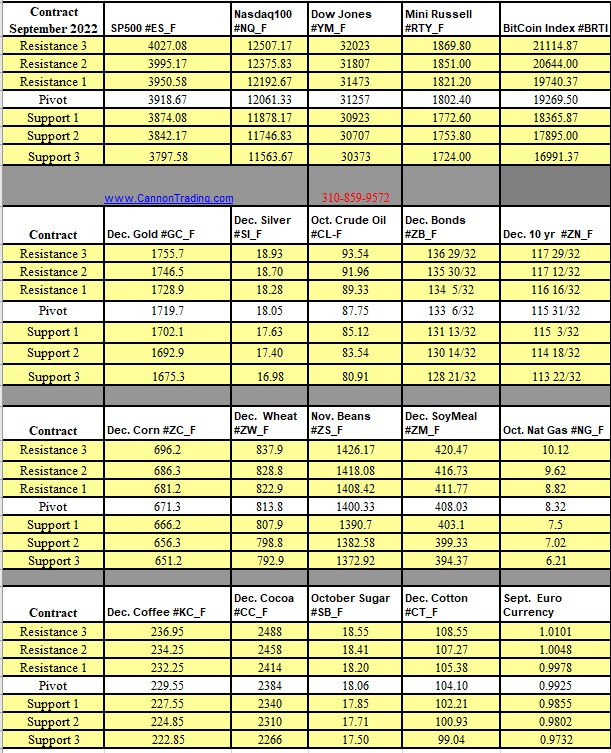
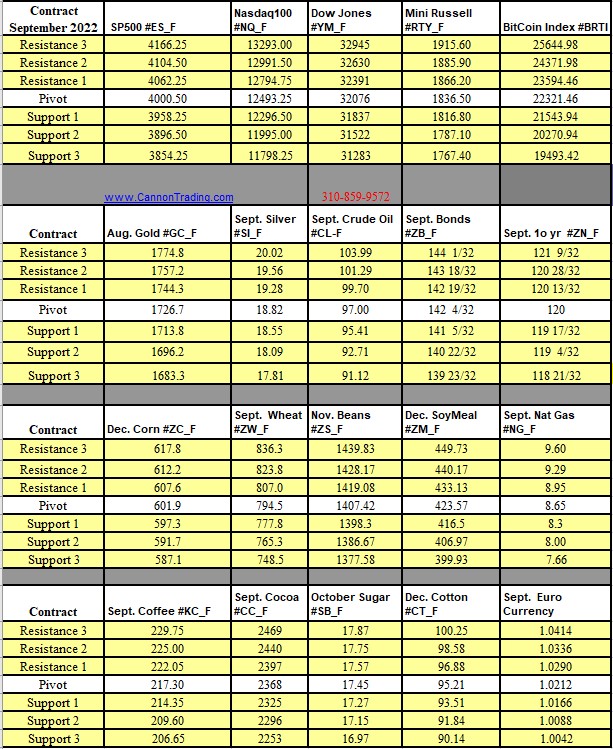
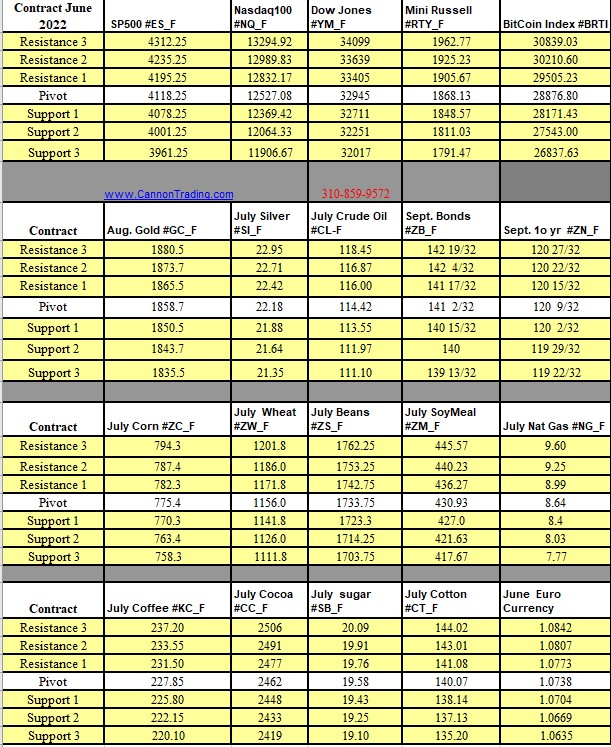
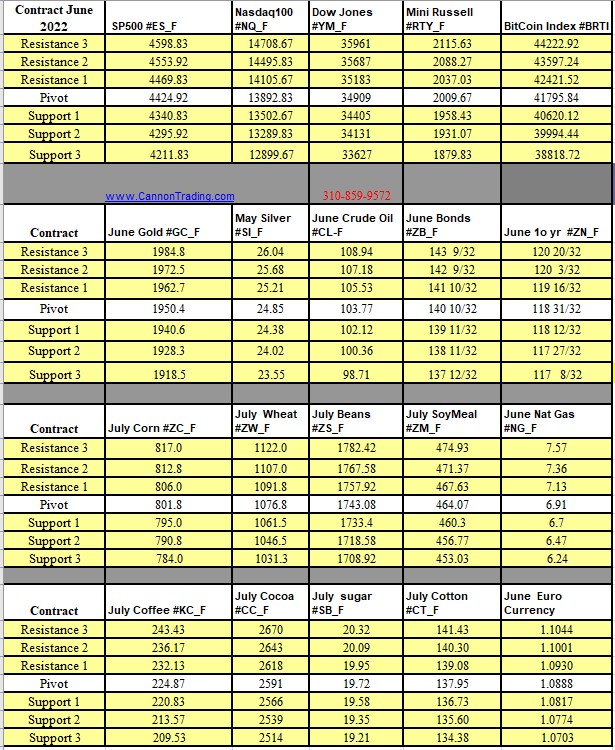
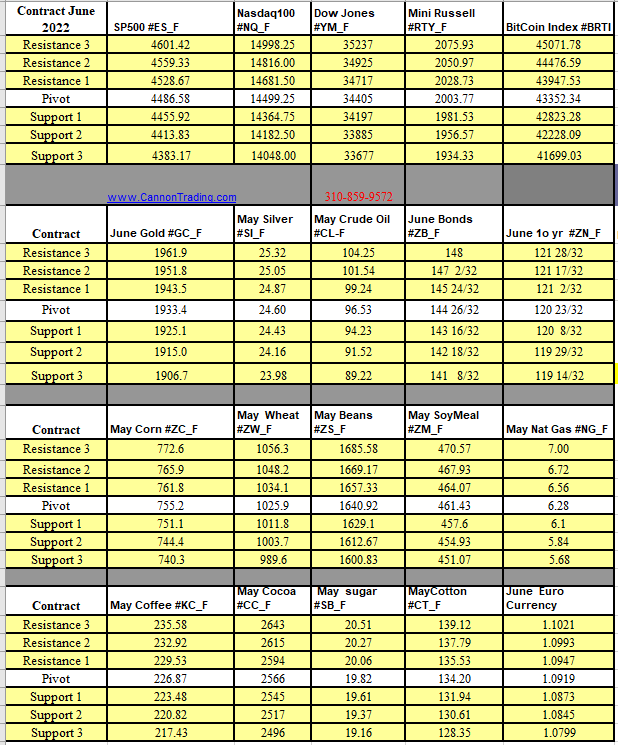
Futures Trading Levels

2-24-2021

f4b7cc34 1ecb 4b52 b324 fcd3fd525f35

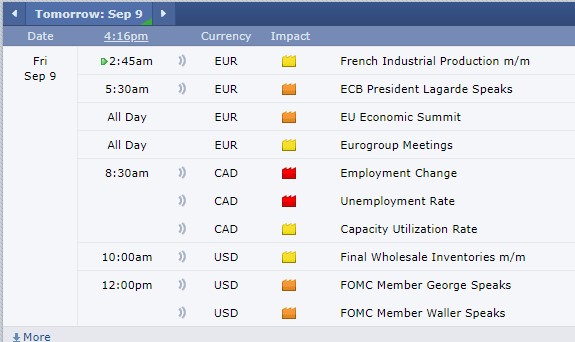
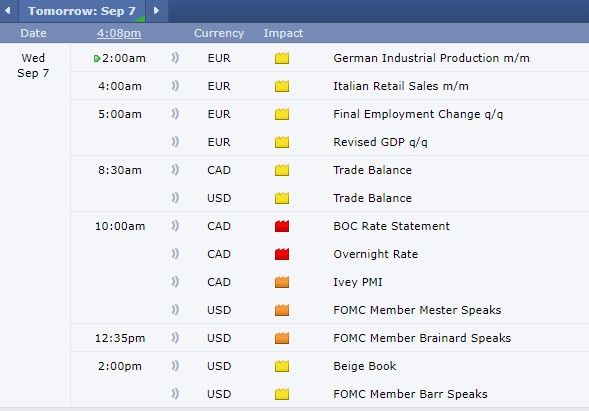
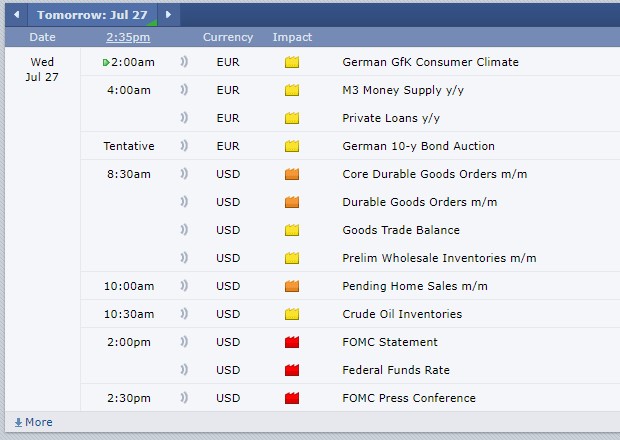
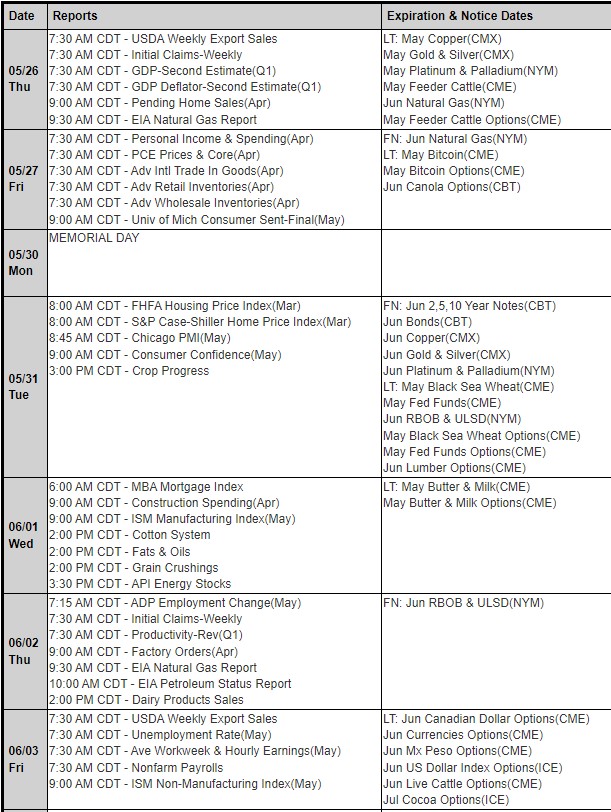
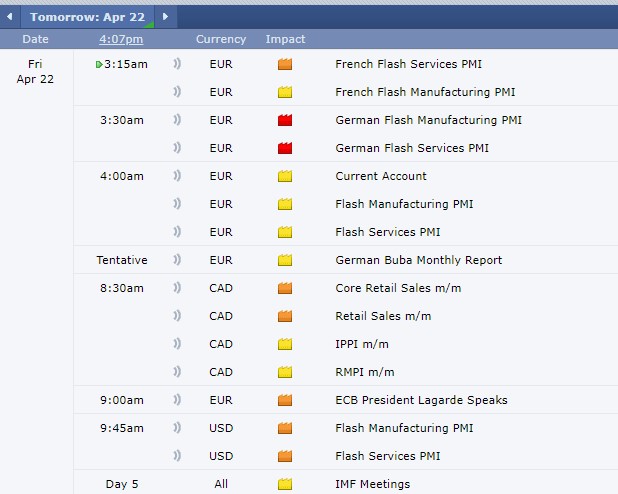
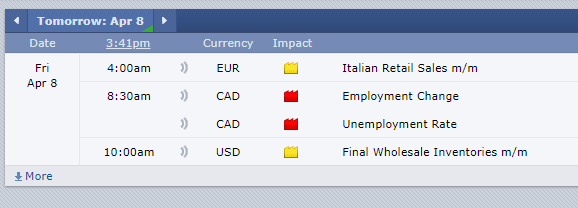
Economic Reports, source: 

 www.BetterTrader.co

90c5d5aa 63c4 42e3 a44f f644d66c5805


This is not a solicitation of any order to buy or sell, but a current market view provided by Cannon Trading Inc. Any statement of facts here in contained are derived from sources believed to be reliable, but are not guaranteed as to accuracy, nor they purport to be complete. No responsibility is assumed with respect to any such statement or with respect to any expression of opinion herein contained. Readers are urged to exercise their own judgement in trading.

Futures Trading Levels for January 5th, 2021

_________________________________________________

Voted #1 Blog and #1 Brokerage Services on TraderPlanet for 2016!!  

_________________________________________________

Dear Traders,

Like us on FaceBook!
Get Real Time updates and market alerts on Twitter!
If the first trading day of 2021 is any indication of the year to come….Better fasten your seatbelts!!
Thank you for choosing Cannon during this challenging year. We look forward to continuing to provide you with excellent service in 2021 and wish you a healthy, successful year ahead
mini russell 2000 chart
RTY chart for January 5th 2021
RTY = Mini Russell 2000 has been a leading indicator in my opinion for direction of stock index futures past few months.
Will be interesting to see if the sell off today was a start of a trend reversal or just risk hedging ahead of Georgia tomorrow. As usual in trading, few hours/ few days will tell the story….
If you like access to the ALGOS shown in the chart, click here.
Good Trading

Trading Futures, Options on Futures, and retail off-exchange foreign currency transactions involves substantial risk of loss and is not suitable for all investors.  You should carefully consider whether trading is suitable for you in light of your circumstances, knowledge, and financial resources. You may lose all or more of your initial investment. Opinions, market data, and recommendations are subject to change at any time when it comes to Futures Trading.


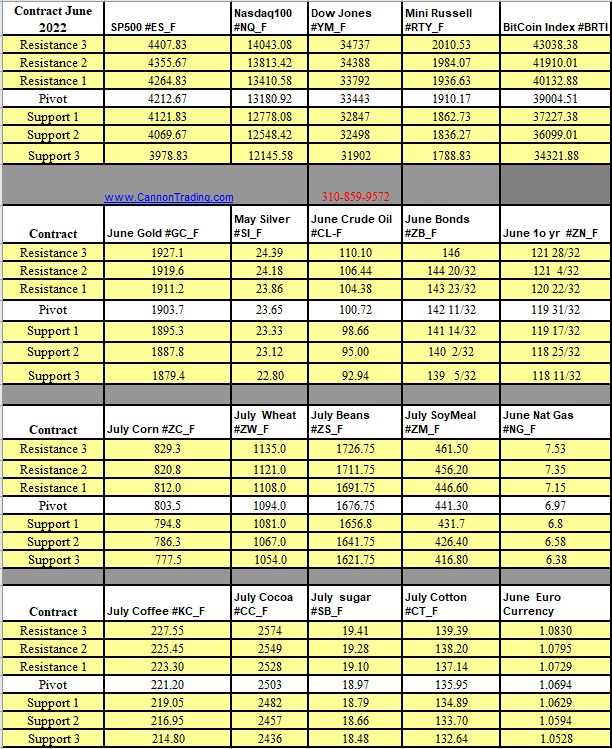
Futures Trading Levels

January 5th 2021

12c3de39 6722 49e2 8f79 4802ce9891dc

Did you know?
Cannon offers over 10 TRADING PLATFORMS CLICK HERE for a demo
Cannon offers FX trading. Try FX Pro demo free and see why it’s called PRO

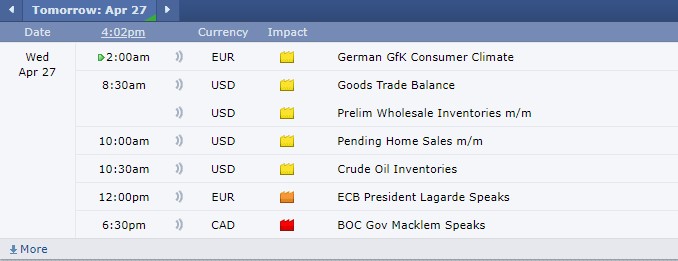
Economic Reports, source: 

 www.BetterTrader.co

1af5722a cf99 41db 974f 9c37df15d593


This is not a solicitation of any order to buy or sell, but a current market view provided by Cannon Trading Inc. Any statement of facts here in contained are derived from sources believed to be reliable, but are not guaranteed as to accuracy, nor they purport to be complete. No responsibility is assumed with respect to any such statement or with respect to any expression of opinion herein contained. Readers are urged to exercise their own judgement in trading.

Daily NQ Chart & Support and Resistance Levels 6.05.2019

____________________________________________________________________

Voted #1 Blog and #1 Brokerage Services on TraderPlanet for 2016!!  

____________________________________________________________________

Dear Traders,

Like us on FaceBook!
Get Real Time updates and market alerts on Twitter!
Trading 101: Free, Interactive Futures Trading Tutorial
An interactive tutorial on the basics ( and a little more) of futures trading.
Regardless if you traded before or new to the futures markets, this tutorial is nicely put together by our regulators and the CME and touches on a variety of sub topics that go into trading futures and options.
Browse through the tutorial at your leisure and at your own pace. Please call us if you have any questions about implementing your strategy or requesting a live demo or have feedback.
7b0fc19f b5eb 42c1 9fff 0da0109a7e5e
bdf6db09 7692 48a4 8450 9a8d7d5f2d31

Good Trading

Trading Futures, Options on Futures, and retail off-exchange foreign currency transactions involves substantial risk of loss and is not suitable for all investors.  You should carefully consider whether trading is suitable for you in light of your circumstances, knowledge, and financial resources. You may lose all or more of your initial investment. Opinions, market data, and recommendations are subject to change at any time.


Futures Trading Levels

06-06-2019

ee77b883 1b88 425d 8d9c 7c6588f6b7db


Economic Reports, source: 

bettertrader.co

c38d27ef 4cd2 4107 8d67 2fd62ca1e1a4


This is not a solicitation of any order to buy or sell, but a current market view provided by Cannon Trading Inc. Any statement of facts here in contained are derived from sources believed to be reliable, but are not guaranteed as to accuracy, nor they purport to be complete. No responsibility is assumed with respect to any such statement or with respect to any expression of opinion herein contained. Readers are urged to exercise their own judgement in trading.

Volatile Markets – Be Careful!! 2.13.2018

____________________________________________________________________

Voted #1 Blog and #1 Brokerage Services on  TraderPlanet   for 2016!!

____________________________________________________________________

Stock index futures seemed a bit more “relaxed” today with lower intra-day volatility and swings but still a pretty large upside moves.

Be careful and make sure you control your emotions, these are not the days for “revenge trading” and “double down” etc…( actually no day is good for that but with this type of volatility, you can get punished very quickly and pretty hard).

Continue reading “Volatile Markets – Be Careful!! 2.13.2018”

Volatile Markets – Be Careful!! Grains Weather Updates…. 2.09.2018

____________________________________________________________________

Voted #1 Blog and #1 Brokerage Services on  TraderPlanet   for 2016!!

____________________________________________________________________

Dryness Extensive Across Southern Plains Wheat Belt

Moisture levels have remained very low across the majority of the hard red wheat belt in the central Plains throughout the winter, with moderate drought now widespread across eastern Colorado into central Oklahoma, and severe to extreme drought located in southern Kansas, Oklahoma, and much of central and northwestern Texas (see map below).

The outlook for the next few weeks shows an upturn in moisture across the northern Plains, with Colorado and Nebraska likely to see some notable improvements in moisture in the form of snowfall. Meanwhile, moisture receipts will likely remain below normal across south central Kansas into west central Oklahoma and northwestern Texas. While moisture needs this time of year are very low for wheat as it remains in dormancy, an upturn in moisture will be critical for these areas once it emerges from dormancy.

However, a drier pattern is expected to continue across the majority of the region in March, which will likely result in some significant stress as spring crop growth resumes. An upturn in rains is possible across the heart of the hard red wheat belt in April, though, which should begin to improve moisture supplies and crop conditions. The rains will be critical to prevent substantial yield reductions for the wheat crop.

By: Don Keeney
Senior Ag Meteorologist
Radiant Solutions  Read More with charts and other data at: http://pages.cmegroup.com/index.php/email/emailWebview

Continue reading “Volatile Markets – Be Careful!! Grains Weather Updates…. 2.09.2018”

CME Raises Margins on Stock Indices 2.08.2018

____________________________________________________________________

Voted #1 Blog and #1 Brokerage Services on  TraderPlanet   for 2016!!

____________________________________________________________________

With the recent volatility the CME have raised some of the overnight margins for stock index futures.

Most of our clients enjoy $500 daytrading margins for the contracts below, depending on the platform and in rare cases market conditions. Few of the trading platforms will use % of overnight margins and/or  if you plan on holding positions more than intraday than note below:

ES was $5,555 –> now $6,105

NQ, $5,720 –> $6,380

YM, $4,620 –> $5,280

RTY, $3,245 –> $3,630

NKD, $4,565 –> $5,280

BE CAREFUL!! THESE ARE NOT “REGULAR OR NORMAL TIMES”

Plan your trade, trade your plan and ALWAYS try to asses the risk/ reward ratio you are about to trade.

Continue reading “CME Raises Margins on Stock Indices 2.08.2018”

Big Volatility in Stock Index Futures Last Two Days – Levels for 09.13.16

Connect with Us! Use Our Futures Trading Levels and Economic Reports RSS Feed.

Like us on FacebookFollow us on TwitterView our profile on LinkedInFind us on Google+Cannon Trading Futures Trading Resistance & Support Levels and Economic ReportsFind us on Yelp

1. Market Commentary
2. Futures Support and Resistance Levels – S&P, Nasdaq, Dow Jones, Russell 2000, Dollar Index
3. Commodities Support and Resistance Levels – Gold, Euro, Crude Oil, T-Bonds
4. Commodities Support and Resistance Levels – Corn, Wheat, Beans, Silver
5. Futures Economic Reports for Friday September 9, 2016

Greetings!

Front month for stock indices is December!!

I looked for some news that may explain the large sell off Friday and almost the same level of bounce today….I saw a few things but must admit none made sense to me, so my clients who are “conspiracy theory believers” may have won this one…..

I saw something about Fed officials speaking today “infused confidence back”, saw another thing that Friday was due to North Korea nuclear tests…yet another explanation spoke about rollover. Another news flash spoke about possibly removing some of the stocks from the financial segment of the SP500, specifically “good performing real estate stocks from the financial/ banking sector…..not to mention the “9/11” effect….and more and more etc. etc…..

My guess is the FED once again too concerned with keeping stock market prices higher than the paying attention to the rest of the economy…..I feel that QE in general and other FED action created artificially higher stock market prices which will one day explode in a violent way. But that is a topic for a whole new discussion.

Bottom line is I have no explanation but here is what the hourly and daily charts look like:

DAILY

S&P 500 Futures Daily Chart
Hourly
S&P 500 Futures Hourly Chart

Continue reading “Big Volatility in Stock Index Futures Last Two Days – Levels for 09.13.16”

Rollover Notice for Stock Index Futures 9.09.2016

Connect with Us! Use Our Futures Trading Levels and Economic Reports RSS Feed.

Like us on FacebookFollow us on TwitterView our profile on LinkedInFind us on Google+Cannon Trading Futures Trading Resistance & Support Levels and Economic ReportsFind us on Yelp

1. Market Commentary
2. Futures Support and Resistance Levels – S&P, Nasdaq, Dow Jones, Russell 2000, Dollar Index
3. Commodities Support and Resistance Levels – Gold, Euro, Crude Oil, T-Bonds
4. Commodities Support and Resistance Levels – Corn, Wheat, Beans, Silver
5. Futures Economic Reports for Friday September 9, 2016

Greetings!

Rollover is here again….The quarterly event is upon us once more, so read below and adjust!

Rollover Notice for Stock Index Futures

Important notice: For those of you trading any stock index futures contracts, i.e., the E-mini S&P, E-mini NASDAQ, E-mini Dow Jones, the “Big” pit-traded S&P 500, etc., it is extremely important to remember that tomorrow, Thursday, Sept.8th, is rollover day.

Starting Sept. 8th, the December 2016 futures contracts will be the front month contracts. It is recommended that all new positions be placed in the December 2016 contract as of Sept. 8th. Volume in the Sept. contracts will begin to drop off until its expiration on Friday September 16th.

The month code for December is Z6.

Traders with electronic trading software should make sure that defaults reflect the proper contract as of Thursday morning.

Please close any open September Currency positions by the close on Friday the 16th.

Should you have any further question please contact your broker.

Continue reading “Rollover Notice for Stock Index Futures 9.09.2016”

Russell 2000 Futures Chart & Economic Reports 9.18.2015

Connect with Us! Use Our Futures Trading Levels and Economic Reports RSS Feed.

Like us on FacebookFollow us on TwitterView our profile on LinkedInFind us on Google+Cannon Trading Futures Trading Resistance & Support Levels and Economic ReportsFind us on Yelp

1. Market Commentary
2. Futures Support and Resistance Levels – S&P, Nasdaq, Dow Jones, Russell 2000, Dollar Index
3. Commodities Support and Resistance Levels – Gold, Euro, Crude Oil, T-Bonds
4. Commodities Support and Resistance Levels – Corn, Wheat, Beans, Silver
5. Futures Economic Reports for Friday September 18, 2015


Hello Traders,

For 2015 I would like to wish all of you discipline and patience in your trading!

This much anticipated FOMC lived up to expectations….tremendous volatility for sure. I hope some of you read my tips YESTERDAY about lowering trading quantities and widening stops etc.

That’s history but one thing I recommend, is write down notes from today. market behavior, your behavior etc. Keep it as part of your trading journal. Might help you the next FOMC…..What’s next? To be honest I am not sure at this point.

Here is my daily chart for the mini Russell 2000. Confused market in my opinion.

PS:
1. Many times the big move happens the DAY AFTER FOMC
2. Tomorrow is quadruple witching….

TFE - Russell 2000 Index Mini, Equalized Active Daily Continuation : Heikin-Ashi
TFE – Russell 2000 Index Mini, Equalized Active Daily Continuation : Heikin-Ashi

Mini Russell 2000 Heikin-Ashi & Economic Reports 7.11.2015

Connect with Us! Use Our Futures Trading Levels and Economic Reports RSS Feed.

Like us on FacebookFollow us on TwitterView our profile on LinkedInFind us on Google+Cannon Trading Futures Trading Resistance & Support Levels and Economic ReportsFind us on Yelp

1. Market Commentary
2. Futures Support and Resistance Levels – S&P, Nasdaq, Dow Jones, Russell 2000, Dollar Index
3. Commodities Support and Resistance Levels – Gold, Euro, Crude Oil, T-Bonds
4. Commodities Support and Resistance Levels – Corn, Wheat, Beans, Silver
5. Futures Economic Reports for Friday July 10, 2015

Hello Traders,

For 2015 I would like to wish all of you discipline and patience in your trading!

Hello Traders,

Trying to predict movement on stock indices from one day to another has not been easy to say the least….

One thing that i personally like is that the intraday ranges are wider, volatility is higher and I personally prefer this type of day-trading environment. Main thing to remember if you are a day-trader, as volatility increases, you need to adjust your stops and targets accordingly, perhaps consider LOWERING your trading size so you can afford more room on stops and hold on for larger targets. Continue reading “Mini Russell 2000 Heikin-Ashi & Economic Reports 7.11.2015”