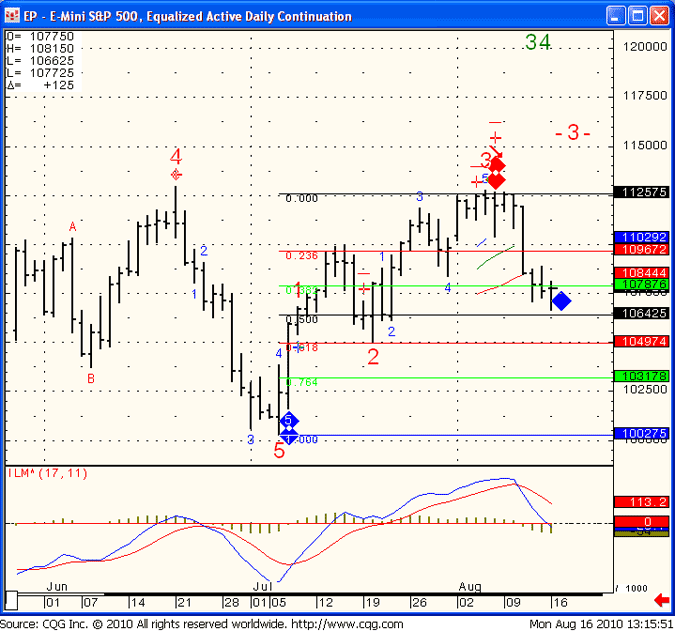
Summer Futures Trading Resistance Levels August 3rd 2010

“Today’s session was classic example of a Summer Trading Session”

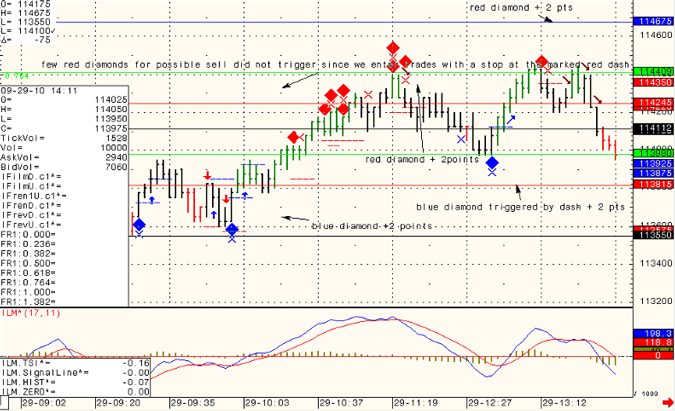
Fairly boring trading day on the futures market. Low volume and overall not many set ups after initial move up. It is what it is. As a futures trader, know what market environment you are in and don’t try to force trades if you don’t have the set ups you are looking for. Some days, the market provides better opportunities than others, sometimes it provides many more risks. Patience is key. No trade is better than a bad trade.

Continue reading “Summer Futures Trading Resistance Levels August 3rd 2010”

Online Trading and Futures Market Resistance Levels August 2nd 2010

“GOOD TRADING!”

Wishing all of you a great trading month during August 2010! Enjoy the weekend, clear your mind from trading emotions and recharge for the new week / month.

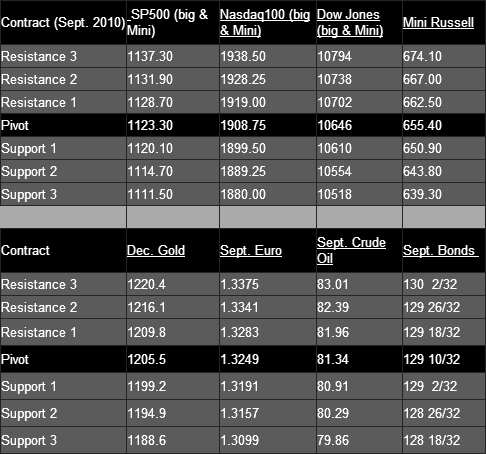
Futures & Commodity Trading Levels (Potential Support/Resistance):

Futures & Commodity Trading Levels (Potential Support/Resistance):

Continue reading “Online Trading and Futures Market Resistance Levels August 2nd 2010”

Best Trading Practices: Always Ask Your Futures Broker July 30th 2010

“Last Trading day of the month tomorrow.”

At any time traders, especially self directed futures traders, must be aware of first notice day, last trading, economic reports etc.

Tomorrow is first notice day for August Gold futures contract – As your futures and commodity broker we try our best to keep many of you informed via this daily blog but always make sure you contact your futures broker with any questions you may have.

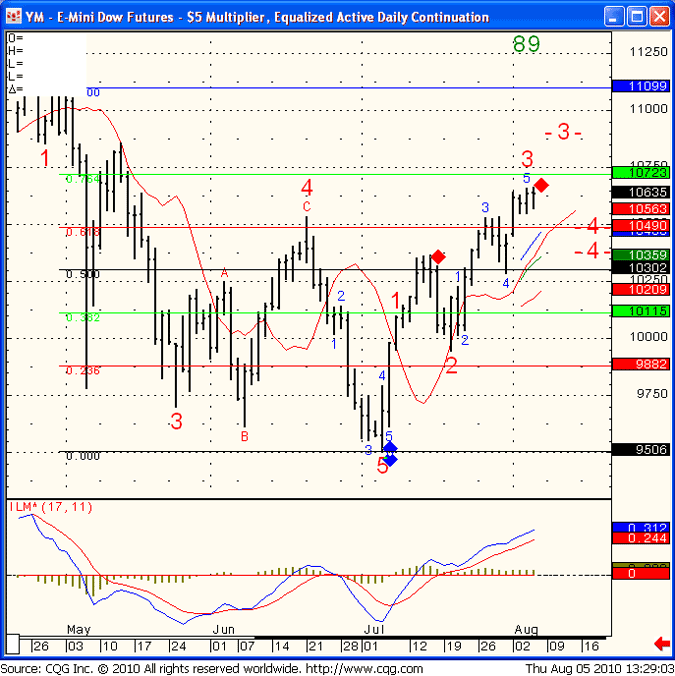
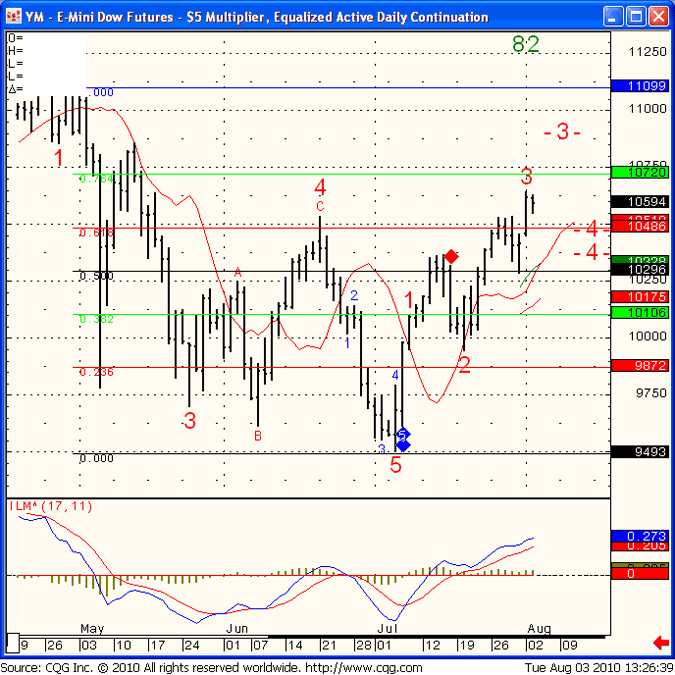
Daily chart of September e-mini Dow Jones below for review. I am not sure about direction to be honest. Both bulls and bears have a case and at this point we are trading in a band between 10293 and 10536, which is a wide trading range.

YM - E-Mini Dow Futures - $5 Multiplier, Equalized Active Daily Continuation
YM – E-Mini Dow Futures – $5 Multiplier, Equalized Active Daily Continuation

Continue reading “Best Trading Practices: Always Ask Your Futures Broker July 30th 2010”

EMini S&P 500 Charts, Day Trading Tips & Resistance Levels July 27th 2010

“Today’s Futures Trading session was lower volume”

Well like I said before, each day-trading session in the commodities and futures markets can wear a different dress. Today’s trading session was lower volume, indecisive to start with but with enough intra-day swings in price action to provide some trading set ups.

I mentioned before in this blog as well as in my day-trading webinar that if a trader can get an early sense to the type of trading day that is about to unfold, he/ she can really increase their chances by using methods/ indicators and set ups that work better for the different trading days ( trending, choppy, volatility on both sides etc.)

In between, below you will see a daily chart of the mini SP 500 with what may be some resistance levels on the way up and possible support levels if we decide to turn around and head back south ( last week we had more than a few changes in market direction)

Continue reading “EMini S&P 500 Charts, Day Trading Tips & Resistance Levels July 27th 2010”

Futures Trading Levels & Economic Reports for July 21st 2010

Nice bounce after touching some FIB levels during overnight session/early morning. FIBONACCI levels been providing good support/ resistance levels so far when applied over multiple time frames. ( daily, hourly, 15 minutes etc. )

Below is a daily chart of the E Mini S&P 500 futures contract with FIBONACCI levels drawn.
Notice todays lows and highs.

We are closing against highs and some momentum during the night session can help this market visit 1099. Failure against the 1081 level and we are back to range bound trading.

EP - E Mini Standard & Poor's 500 (S&P), Equalized Active Daily Continuation
EP – E Mini Standard & Poor’s 500 (S&P), Equalized Active Daily Continuation

Continue reading “Futures Trading Levels & Economic Reports for July 21st 2010”

Futures Trading Levels & Economic Reports for July 20th 2010

A quick look at mini Russell 2000 daily chart, as I view the mini Russell as being the leader in price action amongst different indices over past few months.

Daily chart below shows how we’ve been making lower highs and lower lows.

If the pattern continues, I see us visiting the 553-556 area over next few days. On the flip side we need to see a break above 650 in order to provide the bulls with more courage.

TFE - Russell 2000 Index Mini (S100) (ICE), Equalized Active Daily Continuation
TFE – Russell 2000 Index Mini (S100) (ICE), Equalized Active Daily Continuation

Continue reading “Futures Trading Levels & Economic Reports for July 20th 2010”

Futures Trading Levels & Economic Reports for July 16th 2010

Interesting action today! Not sure what to make of it, there is a case for the bulls and a case for the bears. I am thinking that as a swing trader, one can try to short the market with a stop slightly above the recent highs ( recent high was around 1100 ). Taking the approach that while chances of getting stopped out are higher than normal, the relative risk is smaller than the relative potential reward. On the other hand, bulls may get more confidence going long if market breaks above 1103 or so..

Daily chart for review below.

EP - E Mini Standard & Poor's 500 (S&P), Equalized Active Daily Continuation
EP – E Mini Standard & Poor’s 500 (S&P), Equalized Active Daily Continuation

Continue reading “Futures Trading Levels & Economic Reports for July 16th 2010”

Futures Trading Levels & Economic Reports for July 7th 2010

The futures markets in general had some “futures trading to make up” after the long weekend and we some strong moves and bit more volatility in variety of commodity and futures markets.

I mentioned on Friday blog:
“Stock indices are getting a bit oversold and I suspect that sometime next week we should see a good, short covering rally. However, i don’t try to predict when it will happen but rather use price action with support/resistance lines to get a confirmation. Daily chart of the e mini Russell 2000 for your review below. A break above 613 would give me more confidence in taking a trade from the long side, until then the trend is still pointing lower.”

Well.. today we did see a nice rally that peaked at 612.20 on Sept. mini Russell and headed south afterwards.

In today’s chart I decided to share the popular and followed Dow Jones index. Same analysis from Friday still holds. While indices may be oversold, I would like to see more follow through on the buy side instead of price failure like we saw in today’s session. 9913 is my level to watch on the Dow Jones cash index.

SP 500 Day Trading for July 6th 2010

Continue reading “Futures Trading Levels & Economic Reports for July 7th 2010”

Futures Trading Levels & Economic Reports for July 6th 2010

Wishing you a great 4th of July weekend! ( Our office is closed Monday )

Stock indices are getting a bit oversold and I suspect that sometime next week we should see a good, short covering rally. However, i don’t try to predict when it will happen but rather use price action with support/resistance lines to get a confirmation.

Daily chart of the e mini Russell 2000 for your review below. A break above 613 would give me more confidence in taking a trade from the long side, until then the trend is still pointing lower.

TFE - Russell 2000 Index Mini (S100) (ICE), Equalized Active Daily Continuation
TFE – Russell 2000 Index Mini (S100) (ICE), Equalized Active Daily Continuation

Continue reading “Futures Trading Levels & Economic Reports for July 6th 2010”