Big Dip in the Stock Indices 11.13.2015

Connect with Us! Use Our Futures Trading Levels and Economic Reports RSS Feed.

Like us on FacebookFollow us on TwitterView our profile on LinkedInFind us on Google+Cannon Trading Futures Trading Resistance & Support Levels and Economic ReportsFind us on Yelp

1. Market Commentary
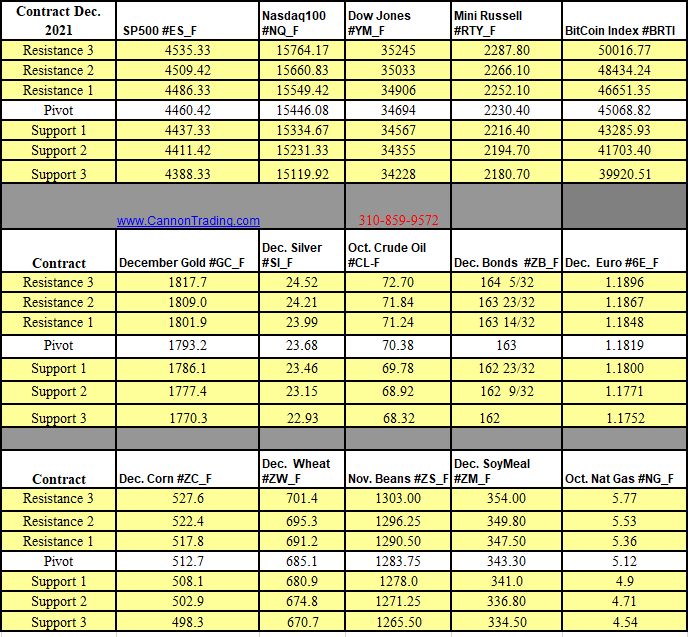
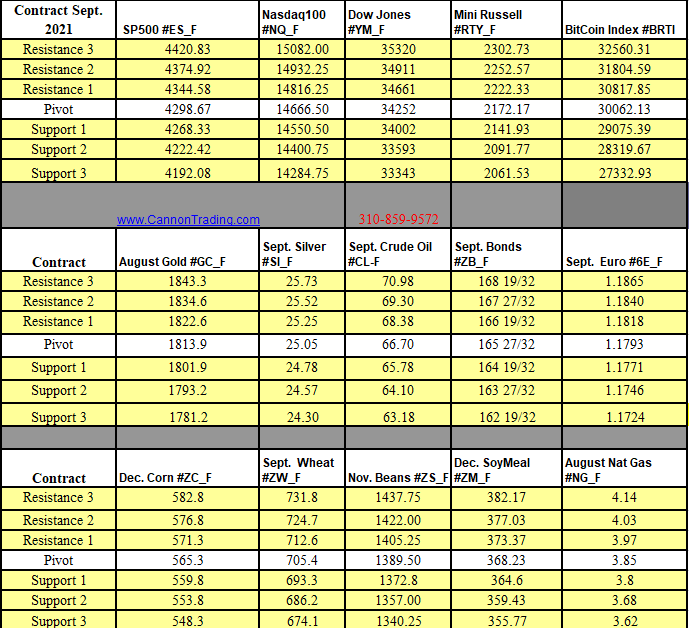
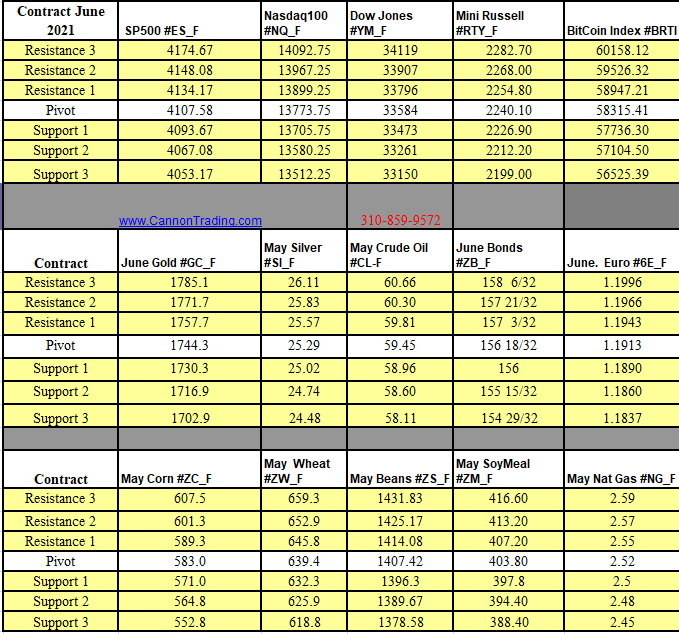
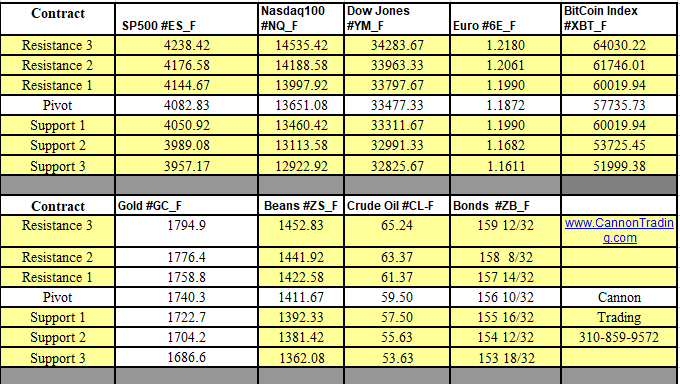
2. Futures Support and Resistance Levels – S&P, Nasdaq, Dow Jones, Russell 2000, Dollar Index
3. Commodities Support and Resistance Levels – Gold, Euro, Crude Oil, T-Bonds
4. Commodities Support and Resistance Levels – Corn, Wheat, Beans, Silver
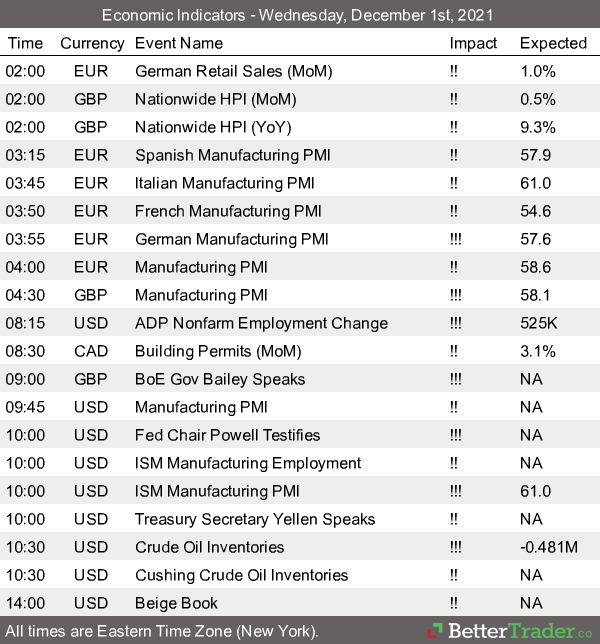
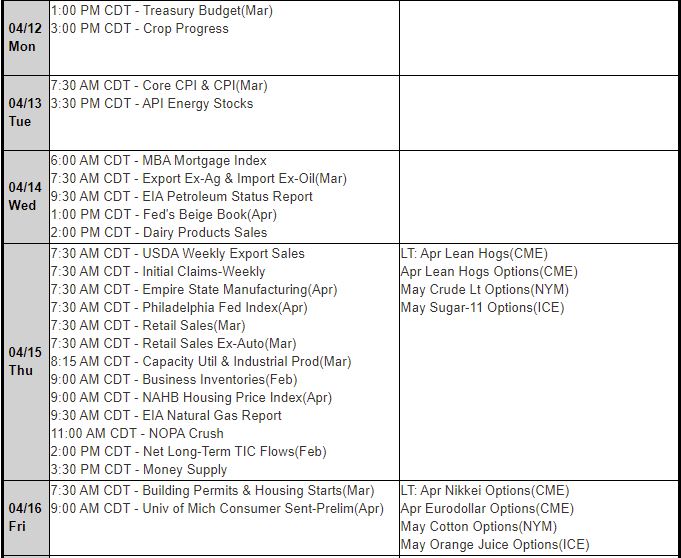
5. Futures Economic Reports for Friday November 13, 2015

Hello Traders,

For 2015 I would like to wish all of you discipline and patience in your trading!

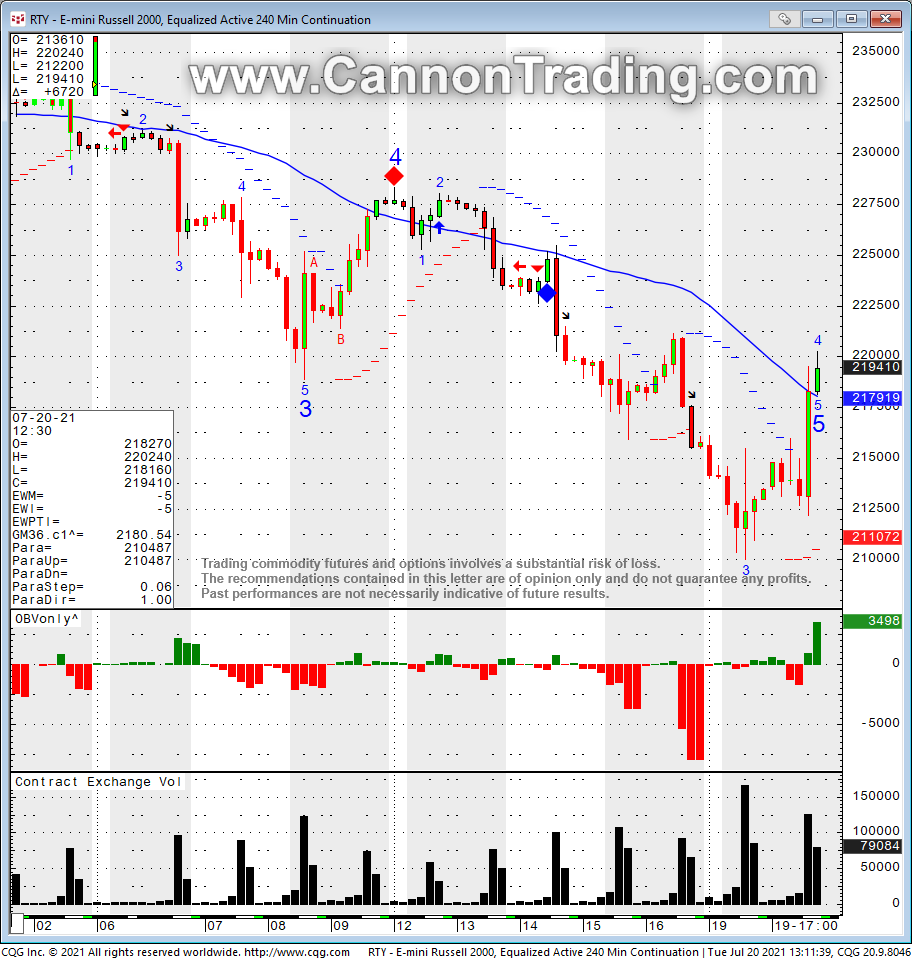
Big drop today on stock indices, almost 2% on the Russell 2000.

To have a look at bigger picture I am sharing my weekly mini Dow chart.

PS: Friday the 13th is tomorrow……

756930fb f60b 4949 ac0a e68a8db8f62b

Heikin-Ashi Mini S&P Chart & Economic Reports 10.09.2015

Connect with Us! Use Our Futures Trading Levels and Economic Reports RSS Feed.

Like us on FacebookFollow us on TwitterView our profile on LinkedInFind us on Google+Cannon Trading Futures Trading Resistance & Support Levels and Economic ReportsFind us on Yelp

1. Market Commentary
2. Futures Support and Resistance Levels – S&P, Nasdaq, Dow Jones, Russell 2000, Dollar Index
3. Commodities Support and Resistance Levels – Gold, Euro, Crude Oil, T-Bonds
4. Commodities Support and Resistance Levels – Corn, Wheat, Beans, Silver
5. Futures Economic Reports for Friday October 9, 2015

Hello Traders,

For 2015 I would like to wish all of you discipline and patience in your trading!

Earnings season is under way. Make sure you are aware of major earning announcements.
Another good source for earnings reports by MorningStar. I would have not guessed that we would retrace all the way back after the major sell off/ flash crash we had back in Aug 21st.
EP - E-Mini S&P 500, Equalired Active Daily Continuation : Heikin-Ashi
EP – E-Mini S&P 500, Equalired Active Daily Continuation : Heikin-Ashi

Daily chart of the mini SP 500 for your review below:

Continue reading “Heikin-Ashi Mini S&P Chart & Economic Reports 10.09.2015”

Heikin-Ashi Mini S&P Chart & Economic Reports 10.06.2015

Connect with Us! Use Our Futures Trading Levels and Economic Reports RSS Feed.

Like us on FacebookFollow us on TwitterView our profile on LinkedInFind us on Google+Cannon Trading Futures Trading Resistance & Support Levels and Economic ReportsFind us on Yelp

1. Market Commentary
2. Futures Support and Resistance Levels – S&P, Nasdaq, Dow Jones, Russell 2000, Dollar Index
3. Commodities Support and Resistance Levels – Gold, Euro, Crude Oil, T-Bonds
4. Commodities Support and Resistance Levels – Corn, Wheat, Beans, Silver
5. Futures Economic Reports for Tuesday October 6, 2015

Hello Traders,

For 2015 I would like to wish all of you discipline and patience in your trading!

The move we saw from Friday morning right after job numbers to today was a very powerful, vertical up move.
The question, big question is:

Is this a vicious bear market rally, possibly an opportunity to sell?

Did market participants decided that rates will be at zero for foreseeable future ( ZIRP) and market just finished a healthy 10% correction and heading back to an all time high?
Big questions….I am not sure which way to lean but here my daily chart of the mini SP 500 with some levels to watch. We are right against key resistance, possible right shoulder in the head and shoulder formation.

EP - E-Mini S&P 500, Equalized Active Daily Continution : Heikin-Ashi
EP – E-Mini S&P 500, Equalized Active Daily Continution : Heikin-Ashi

Did you know Cannon offers FOREX trading including the MT4 platformCheck out our Trading Systems/ALGO Trading and Managed Accounts section!

Many ways to trade any market, many ways to lose money in any market and only very few ways to lock in gainsIf you need help creating a trading plan, visit our broker assist services.

GOOD TRADING

Trading Futures, Options on Futures, and retail off-exchange foreign currency transactions involves substantial risk of loss and is not suitable for all investors. You should carefully consider whether trading is suitable for you in light of your circumstances, knowledge, and financial resources. You may lose all or more of your initial investment. Opinions, market data, and recommendations are subject to change at any time.

If you like Our Futures Trading Daily Support and Resistance Levels, Please share!

Futures Trading Levels

Contract Dec. 2015 SP500 Nasdaq100 Dow Jones Mini Russell Dollar Index
Resistance 3 2033.33 4422.42 17154 1175.43 97.23
Resistance 2 2006.67 4376.08 16924 1156.87 96.76
Resistance 1 1990.58 4343.17 16788 1146.13 96.49
Pivot 1963.92 4296.83 16558 1127.57 96.02
Support 1 1947.83 4263.92 16422 1116.83 95.74
Support 2 1921.17 4217.58 16192 1098.27 95.27
Support 3 1905.08 4184.67 16056 1087.53 95.00
Contract Dec. Gold Dec. Silver Nov. Crude Oil Dec. Bonds Dec.   Euro
Resistance 3 1153.3 16.50 48.85 160 21/32 1.1386
Resistance 2 1147.4 16.12 47.89 159 29/32 1.1343
Resistance 1 1141.3 15.87 47.12 158 20/32 1.1270
Pivot 1135.4 15.49 46.16 157 28/32 1.1227
Support 1 1129.3 15.24 45.39 156 19/32 1.1154
Support 2 1123.4 14.86 44.43 155 27/32 1.1111
Support 3 1117.3 14.61 43.66 154 18/32 1.1038
Contract Dec. Corn Dec. Wheat Nov Beans Dec. SoyMeal Nov. Nat Gas
Resistance 3 399.8 528.7 896.83 309.37 2.56
Resistance 2 396.7 523.3 891.42 307.13 2.52
Resistance 1 395.1 519.4 887.83 305.47 2.50
Pivot 391.9 514.1 882.42 303.23 2.45
Support 1 390.3 510.2 878.8 301.6 2.4
Support 2 387.2 504.8 873.42 299.33 2.38
Support 3 385.6 500.9 869.83 297.67 2.36
Economic Reports

source:http://www.forexfactory.com/calendar.php

All times are Eastern time Zone (EST)

Date 4:07pm Currency Impact Detail Actual Forecast Previous Graph
TueOct 6  2:00am EUR German Factory Orders m/m 0.5% -1.4%
4:10am EUR Retail PMI 51.4
All Day EUR ECOFIN Meetings
Day 2 EUR Eurogroup Meetings
8:30am USD Trade Balance -47.6B -41.9B
10:00am USD IBD/TIPP Economic Optimism 44.6 42.0
1:00pm EUR ECB President Draghi Speaks
5:30pm USD FOMC Member Williams Speaks

This is not a solicitation of any order to buy or sell, but a current market view provided by Cannon Trading Inc. Any statement of facts here in contained are derived from sources believed to be reliable, but are not guaranteed as to accuracy, nor they purport to be complete. No responsibility is assumed with respect to any such statement or with respect to any expression of opinion herein contained. Readers are urged to exercise their own judgment in trading.
 

Heikin-Ashi Mini S&P Chart & Economic Reports 9.25.2015

Connect with Us! Use Our Futures Trading Levels and Economic Reports RSS Feed.

Like us on FacebookFollow us on TwitterView our profile on LinkedInFind us on Google+Cannon Trading Futures Trading Resistance & Support Levels and Economic ReportsFind us on Yelp

1. Market Commentary
2. Futures Support and Resistance Levels – S&P, Nasdaq, Dow Jones, Russell 2000, Dollar Index
3. Commodities Support and Resistance Levels – Gold, Euro, Crude Oil, T-Bonds
4. Commodities Support and Resistance Levels – Corn, Wheat, Beans, Silver
5. Futures Economic Reports for Friday September 25, 2015


Hello Traders,

For 2015 I would like to wish all of you discipline and patience in your trading!

EP - E-Mini S&P 500, Equalized Active Daily Continution : Heikin-Ashi
EP – E-Mini S&P 500, Equalized Active Daily Continution : Heikin-Ashi

Been out due to rotator cuff surgery and back with limited typing ability….

Market is acting like a bear market. Lower lows, lower highs BUT still need to take out 1891 support level as seen below in the daily Heikin-Ashi chart of Dec. mini SP 500

Continue reading “Heikin-Ashi Mini S&P Chart & Economic Reports 9.25.2015”

Russell 2000 Futures Chart & Economic Reports 9.18.2015

Connect with Us! Use Our Futures Trading Levels and Economic Reports RSS Feed.

Like us on FacebookFollow us on TwitterView our profile on LinkedInFind us on Google+Cannon Trading Futures Trading Resistance & Support Levels and Economic ReportsFind us on Yelp

1. Market Commentary
2. Futures Support and Resistance Levels – S&P, Nasdaq, Dow Jones, Russell 2000, Dollar Index
3. Commodities Support and Resistance Levels – Gold, Euro, Crude Oil, T-Bonds
4. Commodities Support and Resistance Levels – Corn, Wheat, Beans, Silver
5. Futures Economic Reports for Friday September 18, 2015


Hello Traders,

For 2015 I would like to wish all of you discipline and patience in your trading!

This much anticipated FOMC lived up to expectations….tremendous volatility for sure. I hope some of you read my tips YESTERDAY about lowering trading quantities and widening stops etc.

That’s history but one thing I recommend, is write down notes from today. market behavior, your behavior etc. Keep it as part of your trading journal. Might help you the next FOMC…..What’s next? To be honest I am not sure at this point.

Here is my daily chart for the mini Russell 2000. Confused market in my opinion.

PS:
1. Many times the big move happens the DAY AFTER FOMC
2. Tomorrow is quadruple witching….

TFE - Russell 2000 Index Mini, Equalized Active Daily Continuation : Heikin-Ashi
TFE – Russell 2000 Index Mini, Equalized Active Daily Continuation : Heikin-Ashi

Rollover Notice for Stock Index Futures 9.10.2015

Connect with Us! Use Our Futures Trading Levels and Economic Reports RSS Feed.

Like us on FacebookFollow us on TwitterView our profile on LinkedInFind us on Google+Cannon Trading Futures Trading Resistance & Support Levels and Economic ReportsFind us on Yelp

1. Market Commentary
2. Futures Support and Resistance Levels – S&P, Nasdaq, Dow Jones, Russell 2000, Dollar Index
3. Commodities Support and Resistance Levels – Gold, Euro, Crude Oil, T-Bonds
4. Commodities Support and Resistance Levels – Corn, Wheat, Beans, Silver
5. Futures Economic Reports for Thursday September 10, 2015

Hello Traders,

For 2015 I would like to wish all of you discipline and patience in your trading!

Greetings! 

I personally start trading the December mini SP this Friday but most traders will rollover tomorrow:
Rollover Notice for Stock Index Futures
Important notice: For those of you trading any stock index futures contracts, i.e., the E-mini S&P, E-mini NASDAQ, E-mini Dow Jones, the “Big” pit-traded S&P 500, etc., it is extremely important to remember that tomorrow, Thursday, September 10th, at 8:30 am CDT  Time is rollover day.
Starting September 10th, the December 2015 futures contracts will be the front month contracts. It is recommended that all new positions be placed in the December 2015 contract as of September 10th. Volume in the September 2015 contracts will begin to drop off until its expiration on Friday Sept. 18th.
The month code for December is Z5.
Traders with electronic trading software should make sure that defaults reflect the proper contract as of Thursday morning.

Mini S&P Daily Chart & Economic Reports 9.04.2015

Connect with Us! Use Our Futures Trading Levels and Economic Reports RSS Feed.

Like us on FacebookFollow us on TwitterView our profile on LinkedInFind us on Google+Cannon Trading Futures Trading Resistance & Support Levels and Economic ReportsFind us on Yelp

1. Market Commentary
2. Futures Support and Resistance Levels – S&P, Nasdaq, Dow Jones, Russell 2000, Dollar Index
3. Commodities Support and Resistance Levels – Gold, Euro, Crude Oil, T-Bonds
4. Commodities Support and Resistance Levels – Corn, Wheat, Beans, Silver
5. Futures Economic Reports for Friday September 4, 2015

Hello Traders,

For 2015 I would like to wish all of you discipline and patience in your trading!

Greetings! 

From my colleague John Thorpe below:

The market structure has changed if you hadn’t noticed.

Does this change create more or less volatility?

ESUS-Daily(Default):6Hours 3minites 49 seconds
The past few weeks of volatility in the equity and bond markets have been absent of major players from previous market volatility.
Major banks, National banks (other than certain limited-purpose trust banks), federal savings associations, and federal branches and agencies of foreign banks (collectively, banks) are required to fully conform their activities and investments to the requirements of the final regulations by the end of the conformance period, which the FRB has extended to July 21, 2015 (please see footnote below)

Russell 2000 Heikin – Ashi Chart & Economic Reports 9.02.2015

Connect with Us! Use Our Futures Trading Levels and Economic Reports RSS Feed.

Like us on FacebookFollow us on TwitterView our profile on LinkedInFind us on Google+Cannon Trading Futures Trading Resistance & Support Levels and Economic ReportsFind us on Yelp

1. Market Commentary
2. Futures Support and Resistance Levels – S&P, Nasdaq, Dow Jones, Russell 2000, Dollar Index
3. Commodities Support and Resistance Levels – Gold, Euro, Crude Oil, T-Bonds
4. Commodities Support and Resistance Levels – Corn, Wheat, Beans, Silver
5. Futures Economic Reports for Wednesday September 2, 2015

Hello Traders,

For 2015 I would like to wish all of you discipline and patience in your trading!

Greetings! My lesson for today was something I actually mentioned in previous posts.

Twice I was in the right direction ( short the mini Russell) and twice I got stopped out only to see the market makes the move I anticipated.Should have implemented my own advice and WIDENED the stop based on recent volatility.

Better late than never, my new stop settings are in place for tomorrow!

Continue reading “Russell 2000 Heikin – Ashi Chart & Economic Reports 9.02.2015”

Heiken Ashi Dow Jones Chart & Economic Reports 9.01.2015

Connect with Us! Use Our Futures Trading Levels and Economic Reports RSS Feed.

Like us on FacebookFollow us on TwitterView our profile on LinkedInFind us on Google+Cannon Trading Futures Trading Resistance & Support Levels and Economic ReportsFind us on Yelp

1. Market Commentary
2. Futures Support and Resistance Levels – S&P, Nasdaq, Dow Jones, Russell 2000, Dollar Index
3. Commodities Support and Resistance Levels – Gold, Euro, Crude Oil, T-Bonds
4. Commodities Support and Resistance Levels – Corn, Wheat, Beans, Silver
5. Futures Economic Reports for Tuesday September 1, 2015

Hello Traders,

For 2015 I would like to wish all of you discipline and patience in your trading!

That was an historic week!

Few things to keep in mind:

* Some of the biggest one day rallies usually take place in bear markets.

* “Death Cross” occured in the Dow Jones, where the 50 days moving average crosses below the 200 day moving average. See chart below. This has not happened, yet, for the other 3 major indices ( NASDAQ, Russell 2000 and SP 500)
* In my opinion, unless you buy some longer term options and you are right on the direction and the timing, it does not really matter if you are right on the market direction..it is more important how you manage you position size, money management. In short try to take the emotions out of it and I think you will see things much clearer….

Summary from our friends at TradeTheNews.com below the daily chart of the Dow Jones Cash Index below.

This September has the potential of being one of the most volatile trading months in history…will know for sure by Sept. 30th….

Wishing you a great trading month ahead!! 

DJI - DJ Industrial Average, Daily: Heikin - Ashi
TradeTheNews.com Weekly Market Update: Volatility Shakes Up Complacent Markets

After China refrained from expected stimulus moves over the weekend, global markets went into hysterics on Monday morning. Chinese stocks went negative on the year, helping to trigger a mini flash on at the New York open, sending the S&P 500 into its first correction in three years. China fears hit emerging markets again, exacerbating tensions in the market that were already on edge about the uncertainties surrounding an impending Fed rate hike. Chinese stimulus finally materialized after the Shanghai market closed on Tuesday, helping to reverse US stocks that morning though they retested the Monday lows by the end of the session. The fever broke on Wednesday as Chinese stocks stabilized, and bargain hunters began pouring in, sending most global equity markets higher through the back half of the week. Trading volumes remained very heavy during what is normally a quiet late August week and currency and commodity markets experienced wild volatility spikes as well. By the end of a week that shook complacent markets, the DJIA ended with a 1.1% gain, the S&P500 was up 0.9%, and the Nasdaq added 2.6%.

With markets on fire, all eyes were on Beijing to do something (chatter favored a big, meaty RRR reserve ratio cut) before the open of trade on Monday to stop the bleeding. China’s policy response did not impress: regulators said China’s national pension fund was now authorized to invest in the stock market, and the stock slide continued unabated. The action was so bad that Apple CEO Cook was compelled to release a statement to help calm markets saying the company was seeing strong growth in China in July and August, with iPhone activations up over recent weeks. No further extraordinary Chinese actions arrived during the Asia session on Tuesday and the Shanghai tanked another 7.6%. With the smell of fear everywhere, the PBoC finally stepped in with a 50 basis point RRR cut and lowered key deposit and lending rates, in a move that seemed to be timed to trap the short sellers that the government has been railing against.

Continue reading “Heiken Ashi Dow Jones Chart & Economic Reports 9.01.2015”

Futures Trading Levels & Economic Report 8.21.2015

Connect with Us! Use Our Futures Trading Levels and Economic Reports RSS Feed.

Like us on FacebookFollow us on TwitterView our profile on LinkedInFind us on Google+Cannon Trading Futures Trading Resistance & Support Levels and Economic ReportsFind us on Yelp

1. Market Commentary
2. Futures Support and Resistance Levels – S&P, Nasdaq, Dow Jones, Russell 2000, Dollar Index
3. Commodities Support and Resistance Levels – Gold, Euro, Crude Oil, T-Bonds
4. Commodities Support and Resistance Levels – Corn, Wheat, Beans, Silver
5. Futures Economic Reports for Tuesday August 11, 2015

Hello Traders,

For 2015 I would like to wish all of you discipline and patience in your trading!

I posted the following on FinanceMagnates.com back on August 5th about Dow Jones making lower highs and lower lows. Feel free to read that analysis at:

http://www.financemagnates.com/executives/insights/lower-highs-and-lower-lows-on-dow-jones-index/. And below you will see my updated chart of the same Dow Jones Cash Index, except that this time it is a weekly chart. Note we are right around major weekly support level ( 17035) and how we close tomorrow may provide important clues going forward:

DJI - DJ Industrial Average, Weekly:Heikin-Ashi
DJI – DJ Industrial Average, Weekly:Heikin-Ashi

Continue reading “Futures Trading Levels & Economic Report 8.21.2015”