Why Use Tick & Volume Charts, Mini NQ Review and Support & Resistance Levels 2.23.2021
Posted By:- Ilan Levy-Mayer Vice President, Cannon Trading Futures Blog
_________________________________________________
Voted #1 Blog and #1 Brokerage Services on TraderPlanet for 2016!!
_________________________________________________
Dear Traders,
Why I like to use tick and volume charts for scalping
Today I decided to touch more on an educational feature rather than provide a certain market outlook.
Many of my clients and
blog readers know that when it comes to short term trading I am a fan of using volume charts, tick charts, range bar charts and Renko charts rather than the traditional time charts like the 1 minutes, 5 minutes etc.
My rule of thumb is that if you as a trader make decisions based on charts that are less than 15 minutes time frame, it may be worth your time to research, back test and do some homework as to potentially using other type of charts like volume charts , Range charts etc.
Volume charts will draw a new bar once a user defined number of contracts traded. Example mini SP 10,000 volume chart will draw a new bar once 10,000 contracts traded.
Range bar charts will draw new charts once price action has exceeded a user pre define price or ticks range. Example might be an 18 ticks range bar chart on crude oil.
While the volume charts rely ONLY on volume, the range bar charts rely ONLY on price action.
Their main advantage over traditional time charts is twofold in my opinion:
1. If the market is moving fast, reports came out or there is heavy volume in the market, the traditional 5 minute chart will need 5 minutes to complete the next bar before it provides you with a signal…if you day traded futures before you will know what 5 minutes can do….The volume charts or range bar charts in this case will complete the bars MUCH faster because there is strong price action and strong volume and will be able to provide a signal faster than the time charts.
2. On the flip side, there are times when the market is dead…low volume, sideways, choppy action. If you are using the 3 minute chart and a moving avg. cross over, you may get a signal simple because time has passed and the moving averages crossed even though the market is pretty dead….If you are using a volume chart and the market is slow…it will take a while for the bars to complete and hence it may filter out some “noise” in the market.
Below is a 5,000 CVB ( constant volume Bar) of the NQ. If you like a free trial to the “turning points indicators” highlighted in the charts below or to discuss more in depth different charts and strategies,
feel free to visit us!

Mini Nasdaq Futures Volume Bar Chart
Good Trading
Trading Futures, Options on Futures, and retail off-exchange foreign currency transactions involves substantial risk of loss and is not suitable for all investors. You should carefully consider whether trading is suitable for you in light of your circumstances, knowledge, and financial resources. You may lose all or more of your initial investment. Opinions, market data, and recommendations are subject to change at any time when it comes to Futures Trading.
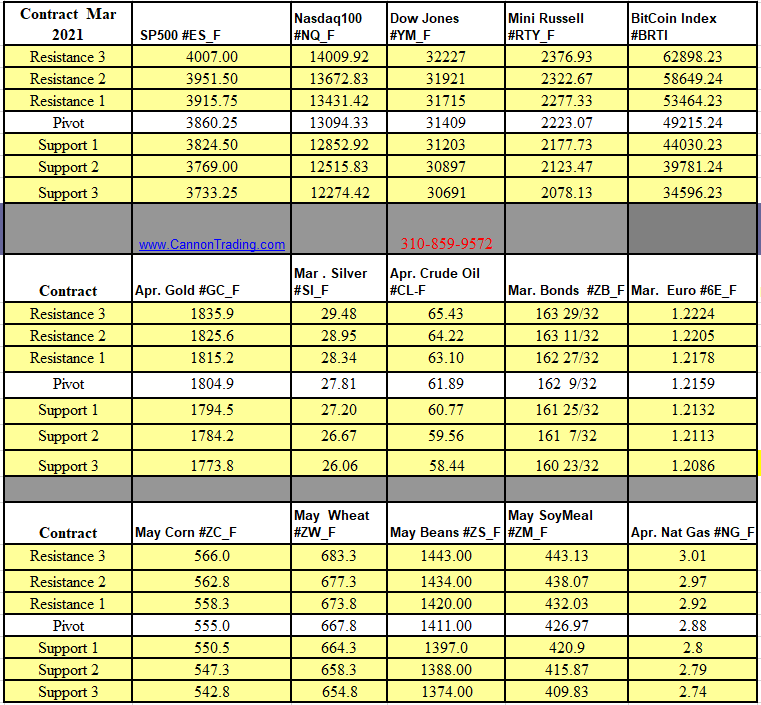
Futures Trading Levels
2-24-2021
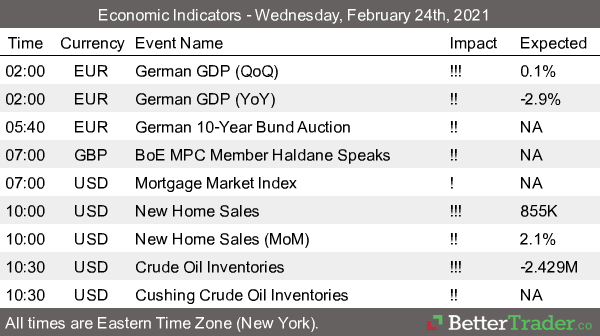
Economic Reports, source:
www.BetterTrader.co
This is not a solicitation of any order to buy or sell, but a current market view provided by Cannon Trading Inc. Any statement of facts here in contained are derived from sources believed to be reliable, but are not guaranteed as to accuracy, nor they purport to be complete. No responsibility is assumed with respect to any such statement or with respect to any expression of opinion herein contained. Readers are urged to exercise their own judgement in trading.
Posted in: Day Trading | Index Futures | Indices


