Important Notices – Israel, Iran, PCE Report & More
Futures 101 – The Role of Speculators in Futures Trading
Hot Market of the Week – July Coffee
Broker’s Trading System of the Week – NQ intraday System
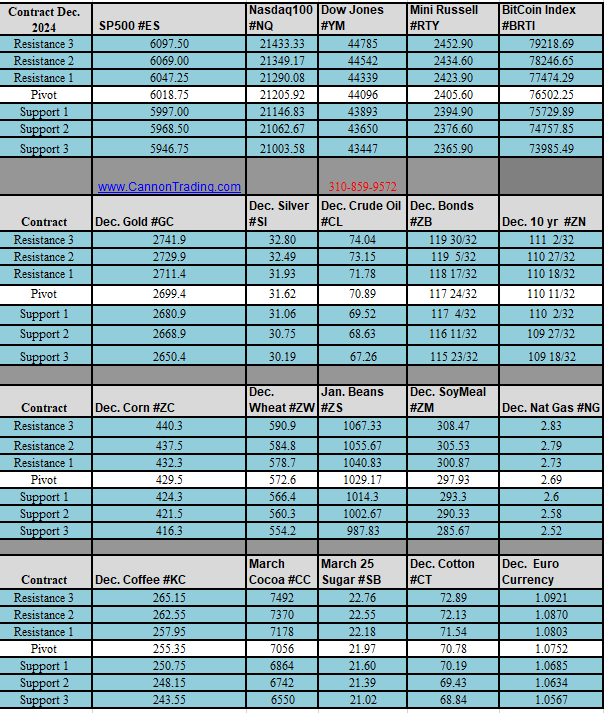
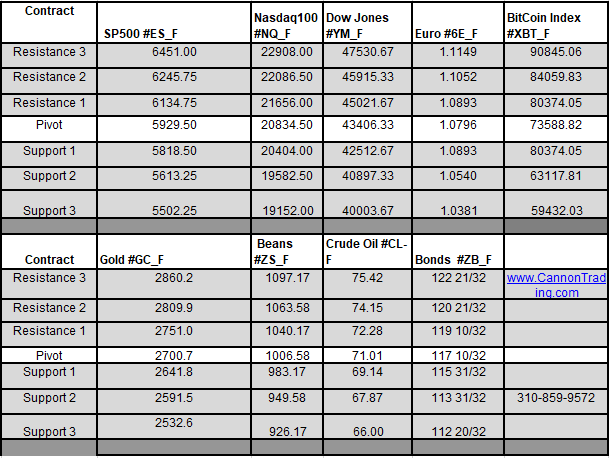
Trading Levels for Next Week
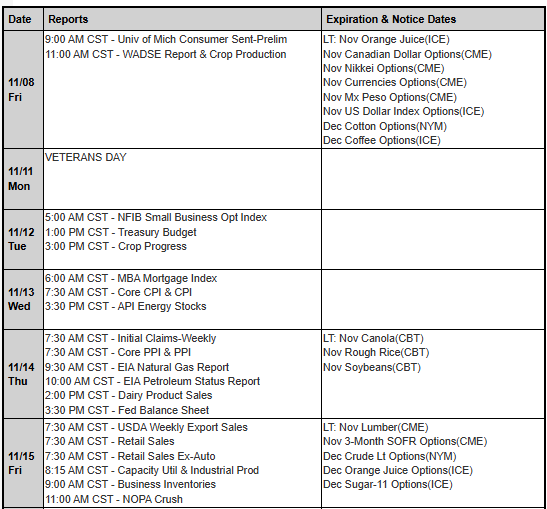
Trading Reports for Next Week
Important Notices –
The situation in the Middle East will loom over the markets next week. More on that below.
Keep an eye on these potential futures market movers:
It was hardly unexpected, but Israel’s missile strike on Iran Friday may foreshadow a dangerous series of tit-for-tat retaliation between the Middle East powers – and unsettle world markets. At the same time, the limited scale of the attack and Iran’s muted response appears so far to signal a successful effort by diplomats who have been working to avert all-out war.
At the outset of Israel’s offensive last night, volatility amplified in key futures markets – stock indexes (S&P 500, Dow, Nasdaq), currencies, energies (crude oil), metals (gold), financials (30-yr. bonds, 10-yr. notes). Into late evening and on into today, there has been a virtual across-the-board drop-off in the inflated price fluctuation seen when news broke of the military action.
GDP and PMI along with homes sales, durable goods and overall a packed week with economic reports.
PCE Friday will provide additional clues as to the future of interest rates
big earnings week MSFT, GOOG, META, XOM, Visa, TSLA
Volatility in Cocoa and Coffee continues. Copper broke higher.
Trading Resource of the Week: Understanding the Role of Speculators
What Are Speculators?
Speculators are primary participants in the futures market. A speculator is any individual or firm that accepts risk in order to make a profit. Speculators can achieve these profits by buying low and selling high. But in the case of the futures market, they could just as easily sell first and later buy at a lower price.
Obviously, this profit objective is easier said than done. Nonetheless, speculators aiming to profit in the futures market come in a variety of types. Speculators can be individual traders, proprietary trading firms, portfolio managers, hedge funds or market makers.
Individual Traders
For individuals trading their own funds, electronic trading has helped to level the playing field by improving access to price and trade information. The speed and ease of trade execution, combined with the application of modern risk management, gives the individual trader access to markets and strategies that were once reserved for institutions.
Proprietary Trading Firms
Proprietary trading firms, also known as prop shops, profit as a direct result of their traders’ activity in the marketplace. These firms supply their traders with the education and capital required to execute a large number of trades per day. By using the capital resources of the prop shop, traders gain access to more capital than they would if they were trading on their own account. They also may have access to the same type of research and strategies developed by larger institutions.
Portfolio or Investment Managers
A portfolio or investment manager is responsible for investing or hedging the assets of a mutual fund, exchange-traded fund or closed-end fund. The portfolio manager implements the fund’s investment strategy and manages the day-to-day trading. Futures markets are often used to increase or decrease the overall market exposure of a portfolio without disrupting the delicate balance of investments that may have taken a significant effort to build.
Hedge Funds
A hedge fund is a managed portfolio of investments that uses advanced investment strategies to maximize returns, either in an absolute sense or relative to a specified market benchmark. The name hedge fund is mostly historical, as the first hedge funds tried to hedge against the risk of a bear market by shorting the market. Today, hedge funds use hundreds of different strategies in an effort to maximize returns. The diverse and highly liquid futures marketplace offer hedge funds the ability to execute large transactions and either increase or decrease the market exposure of their portfolio.
Market Makers
Market makers are trading firms that have contractually agreed to provide liquidity to the markets, continually providing both bids and offers, usually in exchange for a reduction in trading fees. Market makers are important to the trading ecosystem as they help facilitate the movement of large transactions without effecting a substantial change in price. Market makers often profit from capturing the spread, the small difference between the bid and offer prices over a large number of transactions, or by trading related futures markets that they view as being priced to provide opportunity.
Conclusion
All types of speculators bring liquidity to the market place. Providing liquidity is a crucial market function that enables individuals to easily enter or exit the market. Though speculative trading activity generates considerable liquidity, all market players benefit. In contrast to speculators who aim to profit by assuming market risk, some buyers and sellers have a vested interest in the underlying asset of each contact. These market participants aim to offset or eliminate risk and are referred to as hedgers.
Hot Market of the Week – July Coffee
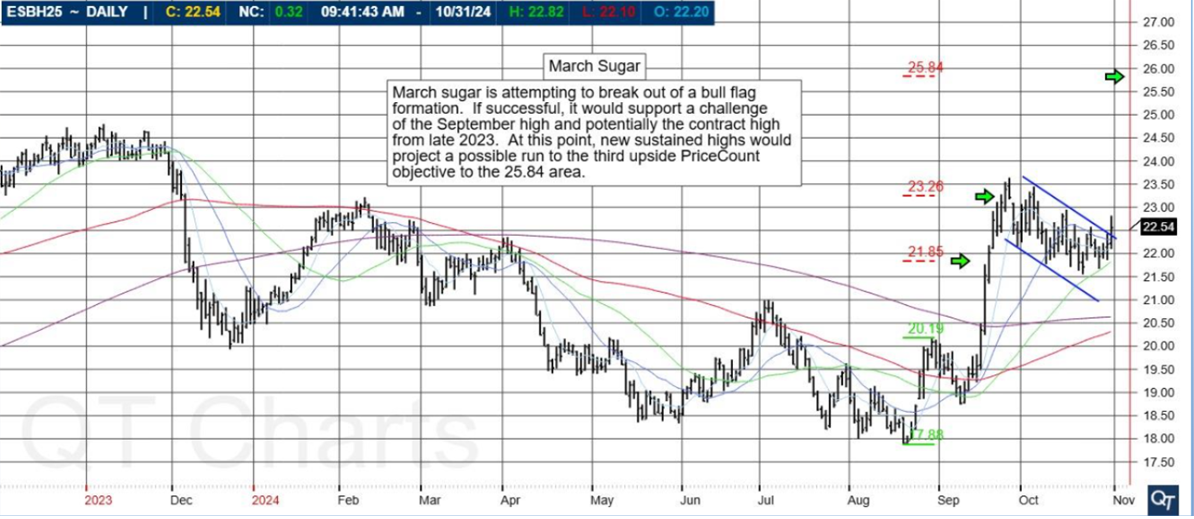
Hot market of the week is provided by QT Market Center, A Swiss army knife charting package that’s not just for Hedgers, Cooperatives and Farmers alike but also for Spread traders, Swing traders and shorter time frame application for intraday traders with a unique proprietary indicator that can be applied to your specific trading needs.
July Coffee satisfied its third upside PriceCount objective in where it would be normal to get a near term reaction in the form of a consolidation or corrective trade, at least. At this point, IF the chart can sustain additional upside we are left with thelow percentage fourth count to aim for just above $300.
PriceCounts – Not about where we’ve been , but where we might be going next!
The PriceCount study is a tool that can help to project the distance of a move in price. The counts are not intended to be an ‘exact’ science but rather offer a target area for the four objectives which are based off the first leg of a move with each subsequent count having a smaller percentage of being achieved. It is normal for the chart to react by correcting or consolidating at an objective and then either resuming its move or reversing trend. Best utilized in conjunction with other technical tools, PriceCounts offer one more way to analyze charts and help to manage your positions and risk. Learn more at www.qtchartoftheday.com
Trading in futures, options, securities, derivatives or OTC products entails significant risks which must be understood prior to trading and may not be appropriate for all investors. Past performance of actual trades or strategies is not necessarily indicative of future results.
Broker’s Trading System of the Week
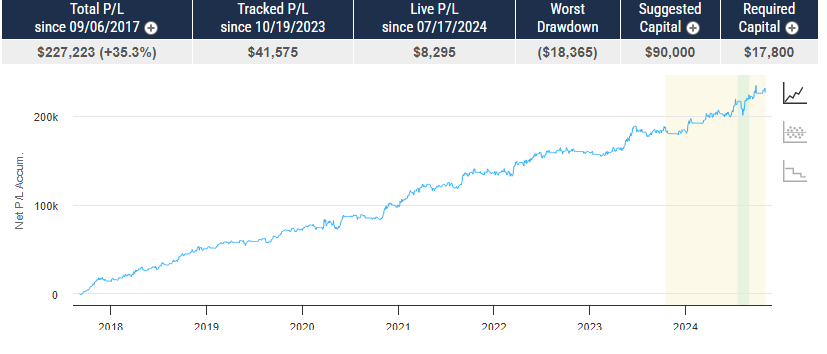
With algorithmic trading systems becoming more prevalent in portfolio diversification, the following system has been selected as the broker’s choice for this month.
The performance shown above is hypothetical in that the chart represents returns in a model account. The model account rises or falls by the average single contract profit and loss achieved by clients trading actual money pursuant to the listed system’s trading signals on the appropriate dates (client fills), or if no actual client profit or loss available – by the hypothetical single contract profit and loss of trades generated by the system’s trading signals on that day in real time (real‐time) less slippage, or if no real time profit or loss available – by the hypothetical single contract profit and loss of trades generated by running the system logic backwards on back adjusted data. Please read full disclaimer HERE.
Would you like to receive daily support & resistance levels?
* This is not a solicitation of any order to buy or sell, but a current market view provided by Cannon Trading Inc. Any statement of facts here in contained are derived from sources believed to be reliable, but are not guaranteed as to accuracy, nor they purport to be complete. No responsibility is assumed with respect to any such statement or with respect to any expression of opinion herein contained. Readers are urged to exercise their own judgement in trading.
For all of you index traders, you may have noticed the shrinking Open Interest and Volume in the March contracts. It’s that time when volume shifts to the next quarterly expiration contract. June! the symbol is M.
March volume will be drying up quickly, don’t get stuck Friday morning with a March contract at the crack of dawn when the carousel stops. Start trading the June contract today!
According to Bloomberg, the S&P 500 has averaged an 0.8% move on CPI days over the past six months
Today, stocks are sideways, the dollar and gold are both up marginally as investors nervously await tomorrows 7:30 a.m. CDT Consumer Price Index release.
Last Month, on Feb 13th stocks slid sharply following the release and Treasury yields surged higher when a surprise CPI number, an Increase of 0.3% in January, crossed the newswires. Housing costs accounted for much of the price rise.
Overall prices are expected to rise 0.4% percent after increasing 0.3% percent in January. Annual rates, which in January were 3.1% percent overall and 3.9% percent for the core, are expected at 3.1% and 3.7% percent respectively. Per econoday.
* This is not a solicitation of any order to buy or sell, but a current market view provided by Cannon Trading Inc. Any statement of facts here in contained are derived from sources believed to be reliable, but are not guaranteed as to accuracy, nor they purport to be complete. No responsibility is assumed with respect to any such statement or with respect to any expression of opinion herein contained. Readers are urged to exercise their own judgement in trading.
Watch an Example below using Sierra Charts from February 21st.
You will see the predicted TURNING POINTS marked on the ES intraday chart.
Hot Market of the Week – July Wheat
Hot market of the week is provided by QT Market Center, A Swiss army knife charting package that’s not just for Hedgers, Cooperatives and Farmers alike but also for Spread traders, Swing traders and shorter time frame application for intraday traders with a unique proprietary indicator that can be applied to your specific trading needs.
July wheat satisfied its third downside PriceCount objective and reacted with a key reversal with follow through to start today. At this point, IF the chart can resume its break with new sustained lows, we are left with only the low percentage fourth count to aim for in in the $4.62 area.
PriceCounts – Not about where we’ve been , but where we might be going next!
The PriceCount study is a tool that can help to project the distance of a move in price. The counts are not intended to be an ‘exact’ science but rather offer a target area for the four objectives which are based off the first leg of a move with each subsequent count having a smaller percentage of being achieved. It is normal for the chart to react by correcting or consolidating at an objective and then either resuming its move or reversing trend. Best utilized in conjunction with other technical tools, PriceCounts offer one more way to analyze charts and help to manage your positions and risk. Learn more at www.qtchartoftheday.com
Trading in futures, options, securities, derivatives or OTC products entails significant risks which must be understood prior to trading and may not be appropriate for all investors. Past performance of actual trades or strategies is not necessarily indicative of future results.
Broker’s Trading System of the Week
With algorithmic trading systems becoming more prevalent in portfolio diversification, the following system has been selected as the broker’s choice for this month.
The performance shown above is hypothetical in that the chart represents returns in a model account. The model account rises or falls by the average single contract profit and loss achieved by clients trading actual money pursuant to the listed system’s trading signals on the appropriate dates (client fills), or if no actual client profit or loss available – by the hypothetical single contract profit and loss of trades generated by the system’s trading signals on that day in real time (real‐time) less slippage, or if no real time profit or loss available – by the hypothetical single contract profit and loss of trades generated by running the system logic backwards on back adjusted data. Please read full disclaimer HERE.
Would you like to receive daily support & resistance levels?
* This is not a solicitation of any order to buy or sell, but a current market view provided by Cannon Trading Inc. Any statement of facts here in contained are derived from sources believed to be reliable, but are not guaranteed as to accuracy, nor they purport to be complete. No responsibility is assumed with respect to any such statement or with respect to any expression of opinion herein contained. Readers are urged to exercise their own judgement in trading.
Important Notices – 2024 World Cup Trading Championship
Trading Resource of the Week – FREE Trader’s Consultation
Hot Market of the Week – April Hogs
Broker’s Trading System of the Week – NQ Swing Trading System
Trading Levels for Next Week
Trading Reports for Next Week
Important Notices –
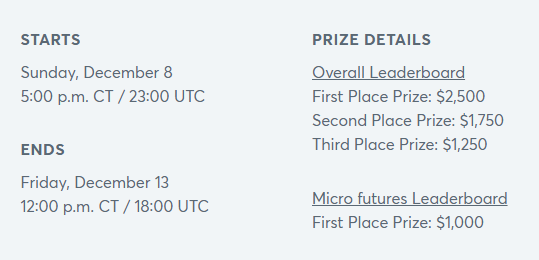
The 2024 World Cup Trading Championships® are just around the corner.
You are invited to enter the ultimate trading challenge, where some of the world’s best Futures and Forex traders compete.
The World Cup Trading Championships have been held since 1983 and are the most prestigious trading competitions in the industry. The winners of each division will prove that they are the best of the best.
The top profitable Entrants will be eligible to receive a magnificent pewter Bull and Bear trophy or a beautiful crystal Bull and Bear Trophy.
Real-money competitions based on net returns – no entry fee required.
Take on traders from across the globe to compete for coveted Bull & Bear trophies, glory, and new career opportunities.
Contact us at 1-310-859-9572 or Visit Us on the Web
Trading Resource of the Week : Book a Trading Consultation ( FREE, no obligation!)with a Cannon Trading Series 3 Broker
Available to both Clients and prospects!
Immediately increase your software and computer competence
Valuable order entry tips
Help create a personalized workspace
Compare multiple trading software
Get to know your Broker
Learning Options strategies
In this complimentary call or screen share session, which can last up to 30 minutes, you will have the opportunity to seek guidance and pose questions to our expert on a wide range of topics. These topics include, but are not limited to:
– Gaining insight into day trading margins.
– Assessing and reviewing various trading platforms and technologies.
Hot market of the week is provided by QT Market Center, A Swiss army knife charting package that’s not just for Hedgers, Cooperatives and Farmers alike but also for Spread traders, Swing traders and shorter time frame application for intraday traders with a unique proprietary indicator that can be applied to your specific trading needs.
April hogs stabilized their slide after completing the first downside PriceCount objective. Now, on the correction higher, the chart has activated upside counts and is taking aim at the first target in the 84.98 area.
PriceCounts – Not about where we’ve been , but where we might be going next!
The PriceCount study is a tool that can help to project the distance of a move in price. The counts are not intended to be an ‘exact’ science but rather offer a target area for the four objectives which are based off the first leg of a move with each subsequent count having a smaller percentage of being achieved. It is normal for the chart to react by correcting or consolidating at an objective and then either resuming its move or reversing trend. Best utilized in conjunction with other technical tools, PriceCounts offer one more way to analyze charts and help to manage your positions and risk. Learn more at www.qtchartoftheday.com
Trading in futures, options, securities, derivatives or OTC products entails significant risks which must be understood prior to trading and may not be appropriate for all investors. Past performance of actual trades or strategies is not necessarily indicative of future results.
Broker’s Trading System of the Week
With algorithmic trading systems becoming more prevalent in portfolio diversification, the following system has been selected as the broker’s choice for this month.
The performance shown above is hypothetical in that the chart represents returns in a model account. The model account rises or falls by the average single contract profit and loss achieved by clients trading actual money pursuant to the listed system’s trading signals on the appropriate dates (client fills), or if no actual client profit or loss available – by the hypothetical single contract profit and loss of trades generated by the system’s trading signals on that day in real time (real‐time) less slippage, or if no real time profit or loss available – by the hypothetical single contract profit and loss of trades generated by running the system logic backwards on back adjusted data. Please read full disclaimer HERE.
Would you like to receive daily support & resistance levels?
* This is not a solicitation of any order to buy or sell, but a current market view provided by Cannon Trading Inc. Any statement of facts here in contained are derived from sources believed to be reliable, but are not guaranteed as to accuracy, nor they purport to be complete. No responsibility is assumed with respect to any such statement or with respect to any expression of opinion herein contained. Readers are urged to exercise their own judgement in trading.
Over 1 Trillion $$ in Market Cap report Q4 ’23 earnings on Friday the 15th.
Those reporting: JPM(Chase), UNH (United Healthcare), BAC (Bank of America), WFC (Wells Fargo), C (Citibank), BLK (BlackRock)
In the Ag sector, what is touted as “the biggest USDA data dump of the year, presenting the opportunity for the most market-moving surprises” by Arlan Suderman StoneX lead Ag analyst.
USDA Supply/Demand and Annual Crop production numbers to be released @11:00 a.m. CST
Real Time Email Alerts
Directly to your Phone!
You will receive an email each time there is an entry or exit in a simple language along with the current price for that specific market.
A licensed series 3 broker at your fingertips
Email alerts available to US and Canada and Int’l clients
With algorithmic trading systems becoming more prevalent in portfolio diversification, the following system has been selected as the broker’s choice for this month.
The performance shown above is hypothetical in that the chart represents returns in a model account. The model account rises or falls by the average single contract profit and loss achieved by clients trading actual money pursuant to the listed system’s trading signals on the appropriate dates (client fills), or if no actual client profit or loss available – by the hypothetical single contract profit and loss of trades generated by the system’s trading signals on that day in real time (real‐time) less slippage, or if no real time profit or loss available – by the hypothetical single contract profit and loss of trades generated by running the system logic backwards on back adjusted data. Please read full disclaimer HERE.
Questions about the markets? trading? platforms? technology? trading systems? Get answers with a complimentary, confidential consultation with a Cannon Trading Company series 3 broker.
Would you like to receive daily support & resistance levels?
First Notice (FN), Last trading (LT) Days for the Week: www.mrci.com
This is not a solicitation of any order to buy or sell, but a current market view provided by Cannon Trading Inc. Any statement of facts herein contained are derived from sources believed to be reliable but are not guaranteed as to accuracy, nor they purport to be complete. No responsibility is assumed with respect to any such statement or with respect to any expression of opinion herein contained. Readers are urged to exercise their own judgment in trading.
Good Trading!
Trading Futures, Options on Futures, and retail off-exchange foreign currency transactions involves substantial risk of loss and is not suitable for all investors. You should carefully consider whether trading is suitable for you in light of your circumstances, knowledge, and financial resources. You may lose all or more of your initial investment. Opinions, market data, and recommendations are subject to change at any time.
Big NFP / unemployment report tomorrow an hour before the stock market opens.
This is a market moving report and indices, bonds, currencies, metals and other markets will see some large swings.
I personally like to be out before the report, wait a few minutes for the zig zag to relax and then look to re-enter.
Intraday day chart of the NQ from last month below for your review! Dec. 8th NFP report.
Over 100 points move in less than a minute!! that is approx. $2,000 per one contract of the NQ ( against you or in your favor…)
Emini Nasdaq 1 minute Chart
Trading Futures, Options on Futures, and retail off-exchange foreign currency transactions involves substantial risk of loss and is not suitable for all investors. You should carefully consider whether trading is suitable for you in light of your circumstances, knowledge, and financial resources. You may lose all or more of your initial investment. Opinions, market data, and recommendations are subject to change at any time when it comes to Futures Trading.
This is not a solicitation of any order to buy or sell, but a current market view provided by Cannon Trading Inc. Any statement of facts here in contained are derived from sources believed to be reliable, but are not guaranteed as to accuracy, nor they purport to be complete. No responsibility is assumed with respect to any such statement or with respect to any expression of opinion herein contained. Readers are urged to exercise their own judgement in trading.
We have a new futures contract. It started trading on Monday. This is the Micro Henry Hub Natural Gas futures contract and corresponding options.
To quote directly from the CME Group web site, “The introduction of Micro Henry Hub Natural Gas futures and options responds directly to customer demand for a smaller, more precise instrument for managing natural gas price exposure. At one-tenth the size of the benchmark Henry Hub (NG) contract, Micro Henry Hub Natural Gas futures and options offer more granularity and smaller margin requirements with the same robust transparency and price discovery of the larger Henry Hub contracts.”
Follow the link below to the contract’s full contract specifications on the CME Group web site:
Heads up: most FCM’s / clearing firms, including the five FCM’s Cannon Trading Co. partners with, will monitor a new futures contract for sufficient liquidity before making it available to its clients. Give Cannon Trading a call to find out the availability of the contract.
Energy:
Incidentally, natural gas (basis Dec.) dropped ±50 cents (a ±$5,000 move) over the last six trading sessions to ±$3.10 /mmBtu. down to new 2-year lows on forecasts for above-normal temps. across the U.S. for the next fifteen days and continental U.S. production remaining near all-time highs,”
Financials:
Stock index futures are struggling today to extend their longest winning streak in two years – clocking seven straight daily gains – as we approach the close of trading. At this typing, the E-mini S&P 500 is trading just a few ticks either side of unchanged, while the E-mini Dow Jones and E-mini Nasdaq are slightly off.
More energy:
Crude oil extended its more than 2-week sell-off to its lowest level in over three months. From an intraday high of $89.85 per barrel on Oct. 20, the front month traded through $75.00 per barrel this morning – a ±$15.00 per barrel / $15,000 per contract move.
DAILY CHART BELOW
News pushing prices south include global demand worries, record U.S. production and ebbing supply concerns surrounding the Gaza conflict.
Given its ability to create a ripple effect, the ±15% price decline dragged U.S. pump prices down to levels not seen since March. It has also helped rein in inflation expectations and worrisome bond yields.
While this paints a picture that fears are subsiding that a wider conflict could be emerging in the Middle East and disrupt supplies, traders should remain on high alert for signs to the contrary.
Trading Futures, Options on Futures, and retail off-exchange foreign currency transactions involves substantial risk of loss and is not suitable for all investors. You should carefully consider whether trading is suitable for you in light of your circumstances, knowledge, and financial resources. You may lose all or more of your initial investment. Opinions, market data, and recommendations are subject to change at any time when it comes to Futures Trading.
This is not a solicitation of any order to buy or sell, but a current market view provided by Cannon Trading Inc. Any statement of facts here in contained are derived from sources believed to be reliable, but are not guaranteed as to accuracy, nor they purport to be complete. No responsibility is assumed with respect to any such statement or with respect to any expression of opinion herein contained. Readers are urged to exercise their own judgement in trading.
What you need to know before the close of the trading week:
By Senior Broker, Mark O’Brien
General:
It will likely be challenging to predict the next stage of the Israel/Hamas war in terms of how broadly it draws in other participants. For now, diplomatic efforts – negotiating for the release of hostages, calls for a cease fire, bringing humanitarian aid to civilians in Gaza – have toned down the severity of the fighting. Concurrently, Israel is softening up the opposition by bombing of targets thought to be Hamas military strongholds and the markets are anticipating the launch of a ground war.
Even with the conflict entering its 20th day and seeing how commodities have already reacted in that time, the start of ground fighting and/or a broadening of participants would likely see sharper moves in particular futures contracts, i.e., gains in energies, flight-to-quality upward movement in gold and the Swiss franc and even food-related commodities like wheat. Conversely, equity index futures – U.S. and more broadly – will be vulnerable to draw-downs. Note that the E-mini Nasdaq already fell into correction territory on Wednesday following the latest tech earnings.
Financials:
One instrument at a potential cross-roads – it’s current 6-month / ±$11K per contract decline a dominant catalyst for dragging shares around the world to multi-month lows – is the 10-year T-note futures contract. Its correspondent benchmark yield is hovering at a 15-yr high of 5%. Already vulnerable to information on the pace of the U.S. economy, the conflict uncertainty poses a new agitator to the market.
Crypto:
After trading down to 3-year lows below 15,000 last October, on Tuesday, Bitcoin futures traded through 35,000, a 17-month high, a ±$10,000 move for a Micro Bitcoin futures contract (contract size: 1/50 Bitcoin), a ±$100,000 for the “adult” / Bitcoin futures contract (contract size: 5 Bitcoin).
Softs:
With new all-time highs being set all year – almost weekly – orange juice futures (basis Nov.) are poised to break through $4.00/lb. (contract size: 15,000 lbs, 1 cent = $150), more than double its ±$1.85 levels in January, a ±$32,000 per contract move. Florida orange growers harvested their smallest crop in nearly 90 years, the result of an ill-timed freeze, two hurricanes and the citrus psyllid, a tiny invasive winged insect that has spread citrus greening disease and is laying waste to Florida’s groves.
Trading Futures, Options on Futures, and retail off-exchange foreign currency transactions involves substantial risk of loss and is not suitable for all investors. You should carefully consider whether trading is suitable for you in light of your circumstances, knowledge, and financial resources. You may lose all or more of your initial investment. Opinions, market data, and recommendations are subject to change at any time when it comes to Futures Trading.
This is not a solicitation of any order to buy or sell, but a current market view provided by Cannon Trading Inc. Any statement of facts here in contained are derived from sources believed to be reliable, but are not guaranteed as to accuracy, nor they purport to be complete. No responsibility is assumed with respect to any such statement or with respect to any expression of opinion herein contained. Readers are urged to exercise their own judgement in trading.
Nasdaq 100 ( NQ and MNQ) sitting on decision levels in my opinion.
A break below 14720 can trigger a visit to the 14220 area. A close above 14930 can open the door for an oversold rally towards the 15300 area.
See daily chart below.
Trading Futures, Options on Futures, and retail off-exchange foreign currency transactions involves substantial risk of loss and is not suitable for all investors. You should carefully consider whether trading is suitable for you in light of your circumstances, knowledge, and financial resources. You may lose all or more of your initial investment. Opinions, market data, and recommendations are subject to change at any time when it comes to Futures Trading.
This is not a solicitation of any order to buy or sell, but a current market view provided by Cannon Trading Inc. Any statement of facts here in contained are derived from sources believed to be reliable, but are not guaranteed as to accuracy, nor they purport to be complete. No responsibility is assumed with respect to any such statement or with respect to any expression of opinion herein contained. Readers are urged to exercise their own judgement in trading.
RISK DISCLOSURE: Past results are not necessarily indicative of future results. The risk of loss in futures trading can be substantial, carefully consider the inherent risks of such an investment in light of your financial condition.