Weekly Newsletter: FOMC next Week, Bonds Outlook & Trading Levels for April 29th

Get Real Time updates and more by joining our Private Facebook Group!
Subscribe to our YouTube Channel

C47

Cannon Futures Weekly Letter Issue # 1191

In this issue:
  • Important Notices – FOMC & NFP Next Week
  • Futures 101 – Understanding Volume
  • Hot Market of the Week – June Bonds
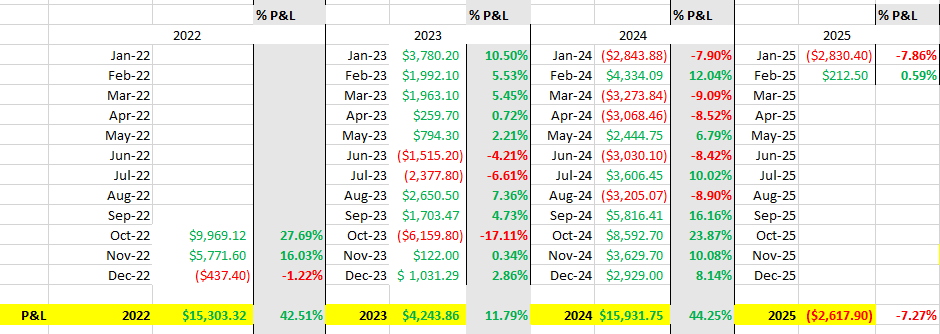
  • Broker’s Trading System of the Week – ES intraday System
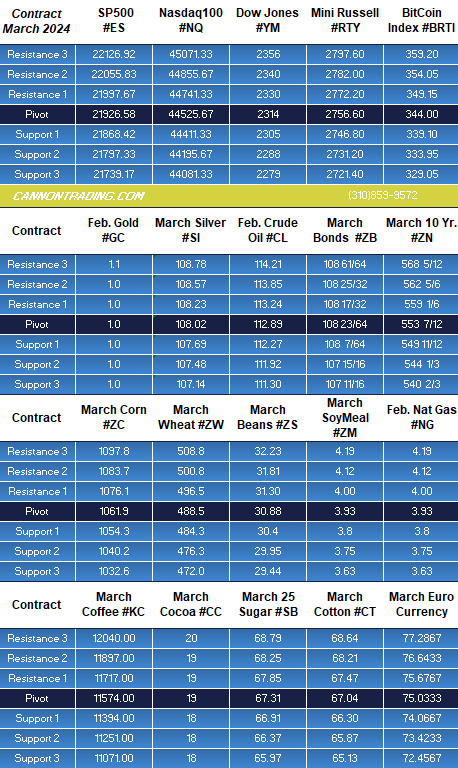
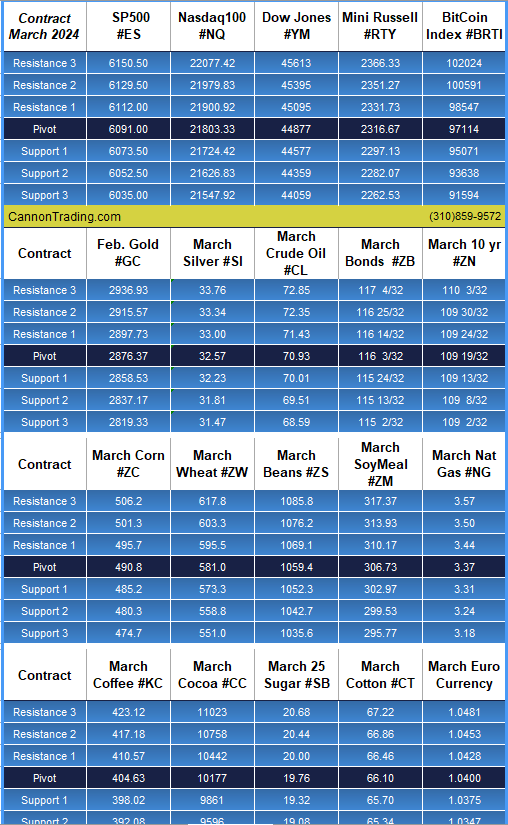
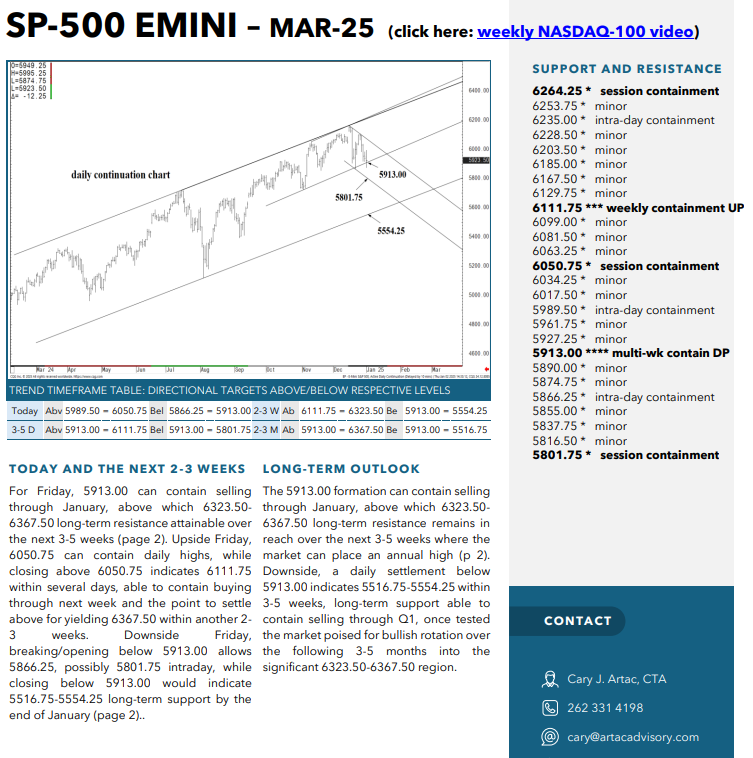
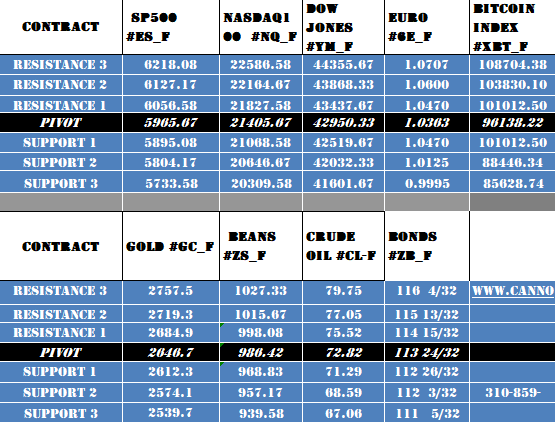
  • Trading Levels for Next Week
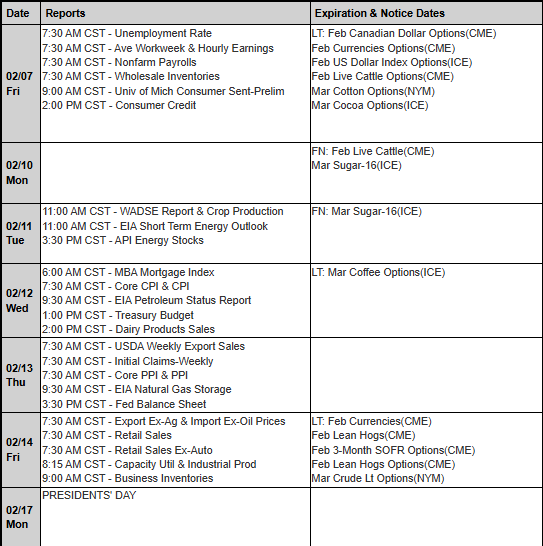
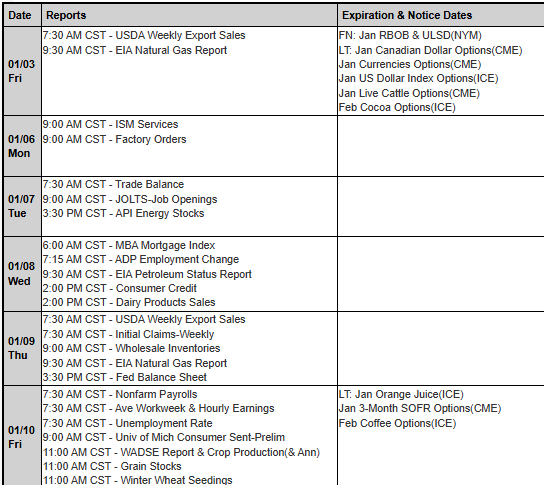
  • Trading Reports for Next Week


Important Notices – Next Week Highlights:

    • FOMC Rate Announcement Wed.
    • Heavy Earnings, AMZN and AMD Tues, AAPL Thur. all after the close
    • Heavy Data, Chicago PMI, Consumer Confidence, Construction Spending, ISM Manufacturing PMI, Jobless Claims.
    • NON FARM Payrolls to cap off the week on Fri. , preopening


Futures 101 : Understanding VOLUME

Volume is reported for all futures contracts. It is calculated by counting the number of contracts that have been bought and sold over a given time. You can track volume using different time intervals like daily or intraday.
When a futures contract is traded, whether bought or sold, it counts towards volume for that contract.
For example, a trader closes a short position in the E-mini S&P 500 (ES) futures contract by buying one contract in the ES, so volume will increase by 1.
Traders often use and interpret the rise or decline of volume in a futures contract to help make trading decisions.
Volume can give important information to traders such as:
  • Indicate the price levels at which traders are more or less interested in trading a futures contract
  • During the roll, indicate to traders when to switch to trading the front month futures contract as volume decreases in the expiring contract
  • Identify the times of day when a futures contract is most liquid
Price Levels
When volume changes as price of a futures contract moves towards certain levels, this can indicate to a trader that a change in direction may occur. Some traders may use this information to indicate whether to buy or sell at those key levels.
­Contract Roll
During the futures rollover, traders pay attention to the contract that is taking the higher levels of volume. Traders use this information to determine when to start trading the next month contract. As volume decreases in the expiring contract, trading will shift to the next available month contract.
For example, say the June ES (E-mini S&P 500) futures contract is about to expire and September will become the new front month. On the Thursday of rollover week, watch how the June contract starts to lose volume and the September contract begins to pick up volume. When the September contract has more volume than the June contract, it is time to switch to the September contract.
Active Periods
Traders typically prefer higher volume times to trade, as it means that more traders are actively interested in buying and selling. When volume is high, the bid-ask spread is typically smaller, orders are filled faster and less gaps may exist between ticks.
For example, markets can have lower volume between the hours of 12:00 p.m.-2:00 p.m. ET, before major economic releases; conversely, market often see higher volume around the open and close of the trading day.
Traders also can look at average daily volume over a longer time period, such as a few weeks or months, to see if the markets currently are in a lower or higher volume than is typical.
Summary
What volume can’t show however, is whether traders are buying or selling, or opening or closing a position.
For example, if the ES contract is trading at 2375 and suddenly pushes down to 2360 while volume increases, the volume that comes into the market could be from traders opening new long positions at key levels of support. That could indicate a bullish sentiment. Volume also can be generated by liquidation of exiting long positions or opening of new short positions, a possible bearish indication.
A spike in volume at 2360 doesn’t necessarily mean that buyers are coming into the market and that the price will bounce.
Volume data is readily available for each futures contract and for the market as a whole. Although traders may use volume in different ways to interpret how to trade, volume can be an important factor to help inform your trading decisions.


stars

3b644da2 2bee 4d39 8d98 5208a20bec39


  • Hot Market of the Week – June Bonds
Hot market of the week is provided by QT Market Center, A Swiss army knife charting package that’s not just for Hedgers, Cooperatives and Farmers alike but also for Spread traders, Swing traders and shorter time frame application for intraday traders with a unique proprietary indicator that can be applied to your specific trading needs.
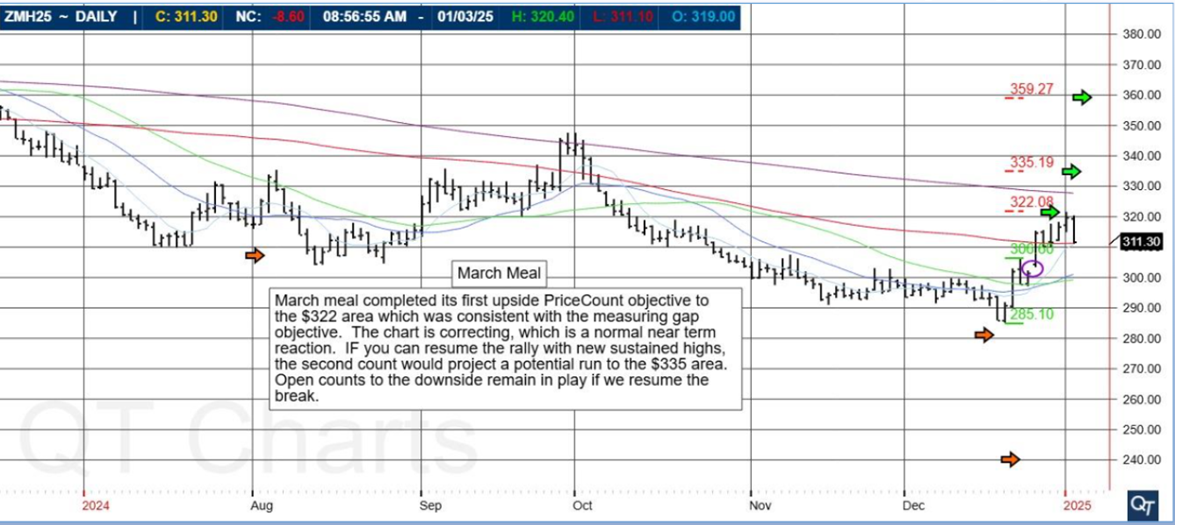
June 30 Year T-Bonds
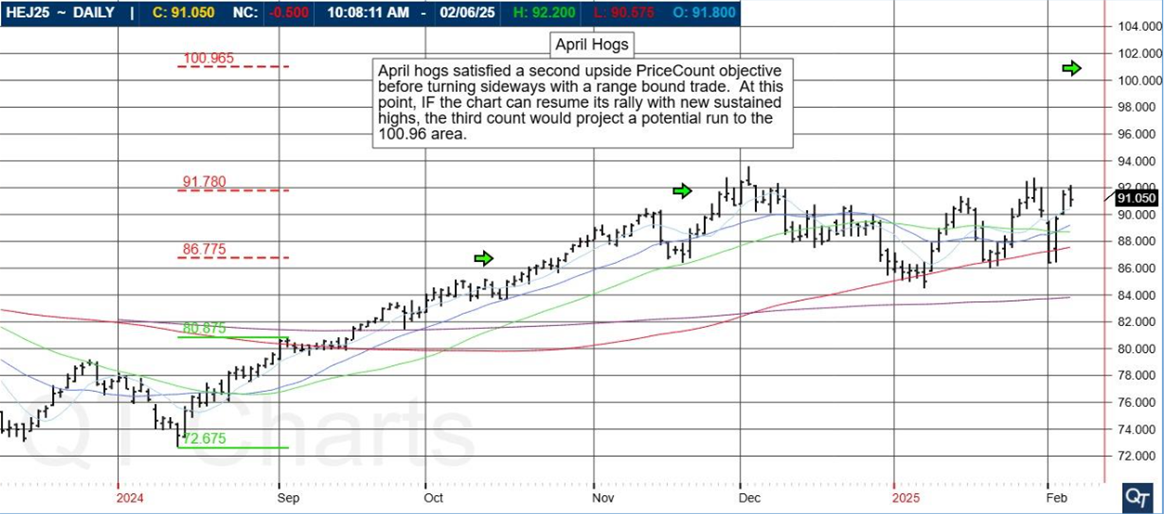
The June 30 Year T-Bond break found temporary stability at its second downside PriceCount objective recently. Now, the chart has resumed its slide into new lows which, if sustained, would project a run to the third count in the 109^20 area.
PriceCounts – Not about where we’ve been , but where we might be going next!
e705ddd3 93f1 4833 80e3 d1e808fbc117
The PriceCount study is a tool that can help to project the distance of a move in price. The counts are not intended to be an ‘exact’ science but rather offer a target area for the four objectives which are based off the first leg of a move with each subsequent count having a smaller percentage of being achieved. It is normal for the chart to react by correcting or consolidating at an objective and then either resuming its move or reversing trend. Best utilized in conjunction with other technical tools, PriceCounts offer one more way to analyze charts and help to manage your positions and risk. Learn more at www.qtchartoftheday.com
Trading in futures, options, securities, derivatives or OTC products entails significant risks which must be understood prior to trading and may not be appropriate for all investors. Past performance of actual trades or strategies is not necessarily indicative of future results.
  • Broker’s Trading System of the Week

With algorithmic trading systems becoming more prevalent in portfolio diversification, the following system has been selected as the broker’s choice for this month.
PRODUCT
SYSTEM TYPE
Intraday
COST
USD 110 / monthly
Recommended Cannon Trading Starting Capital
$10,000
a5fd1228 3ba8 42c5 a40d c3e46544bdd0
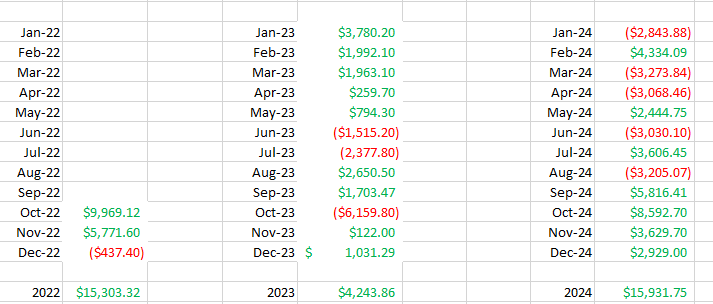
The performance shown above is hypothetical in that the chart represents returns in a model account. The model account rises or falls by the average single contract profit and loss achieved by clients trading actual money pursuant to the listed system’s trading signals on the appropriate dates (client fills), or if no actual client profit or loss available – by the hypothetical single contract profit and loss of trades generated by the system’s trading signals on that day in real time (real‐time) less slippage, or if no real time profit or loss available – by the hypothetical single contract profit and loss of trades generated by running the system logic backwards on back adjusted data. Please read full disclaimer HERE.
Would you like to receive daily support & resistance levels?
Yes
S
No
S


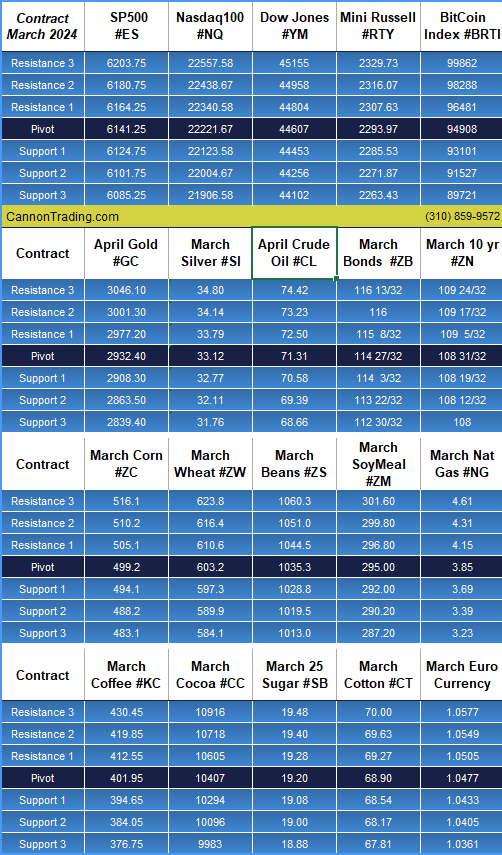
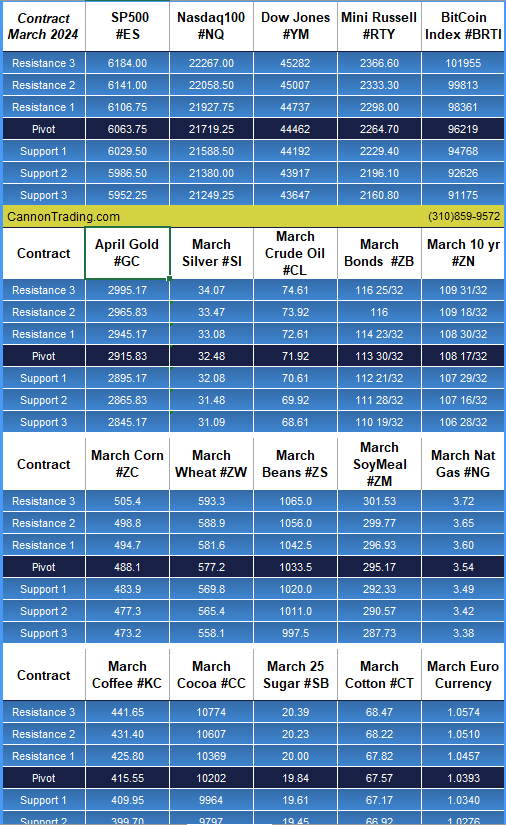
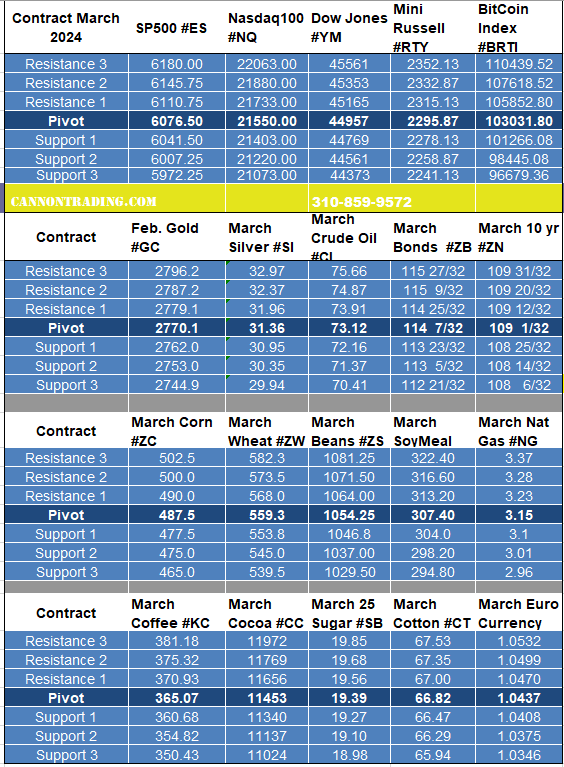
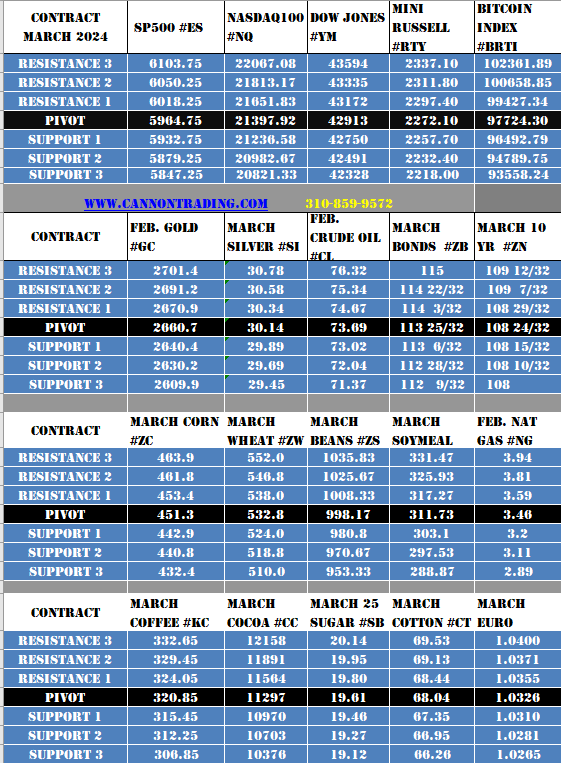
Daily Levels for April 29th 2024

eb118b97 a50d 48fb ab4a efafa6ff5968

Trading Reports for Next Week

d398c77d 24dc 450b 92fb ef3ef27b13d9
d259df9c bf07 4429 9fa8 d12b53c37804
First Notice (FN), Last trading (LT) Days for the Week:
6d1a7821 c606 4107 83ef 6fa197eb7433

Improve Your Trading Skills

Get access to proprietary indicators and trading methods, consult with an experienced broker at 1-800-454-9572.

Explore trading methods. Register Here

* This is not a solicitation of any order to buy or sell, but a current market view provided by Cannon Trading Inc. Any statement of facts here in contained are derived from sources believed to be reliable, but are not guaranteed as to accuracy, nor they purport to be complete. No responsibility is assumed with respect to any such statement or with respect to any expression of opinion herein contained. Readers are urged to exercise their own judgement in trading.
Markets Post FOMC + Levels for March 21st 2024

Get Real Time updates and more by joining our Private Facebook Group!
Subscribe to our YouTube Channel


C6


Life After FOMC …..

by Mark O’Brien, Senior Broker

General: 


The Federal Reserve took center stage today.  With inflation proving stickier than expected, the central bank has found itself balancing between a hawkish and dovish view.  The policy-setting FOMC held interest rates steady at the 5.25%-5.50% range for the fifth straight meeting.  The bigger indicator traders were eager to see was the Fed governors’ so-called dot plot that updated their rate and economic projections – for the first time since December.  Turns out, it didn’t deviate from the three rate cuts they previously penciled in by the end of 2024.


Indexes: 


As of this typing, the June E-mini S&P 500 is trading at new all-time highs around 5280.  As well, the June E-mini Dow Jones is trading at its own all-time highs, barely 100 points away from 40,000!


Metals: 


April gold is on the verge of eking out its own all-time high close above last Monday’s closing price of $2,188.60 per ounce.  It’s currently trading ±$2,191.00 per ounce


General pt. II: 


Over the weekend, Japan ended its negative interest rate policy, marking a historic shift away from an aggressive monetary easing program that was implemented years ago to fight chronic deflation.  As part of the decision, the Bank of Japan (BOJ) raised interest rates for the first time in 17 years, lifting its short-term rate to “around zero to 0.1%” from minus 0.1%.


Plan your trade and trade your plan


stars

e35cb555 9ff3 4f00 9fe8 0655b28fbd90

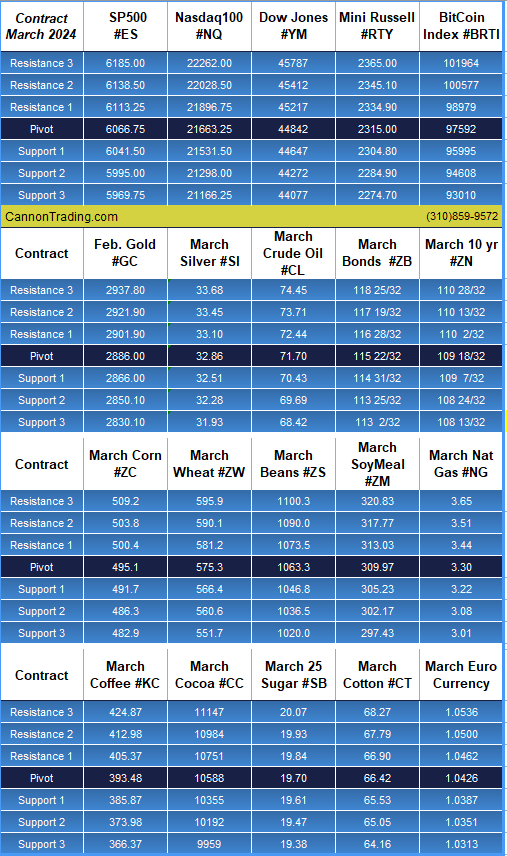
Daily Levels for March 21st, 2024

6d8c1969 faeb 45ef 86a7 555be3b55b38

b0ba1776 c0cd 4536 92c1 eef6595d7173

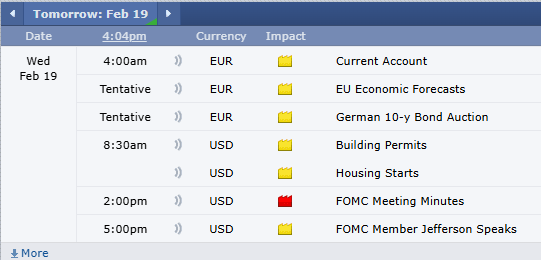
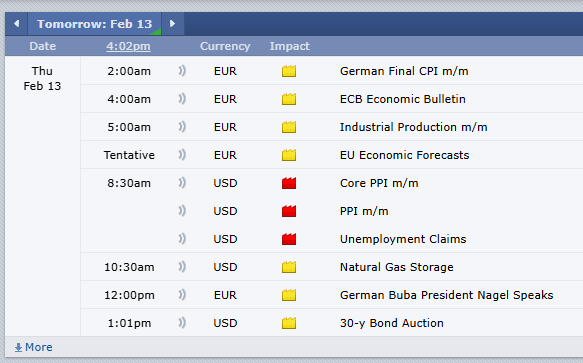
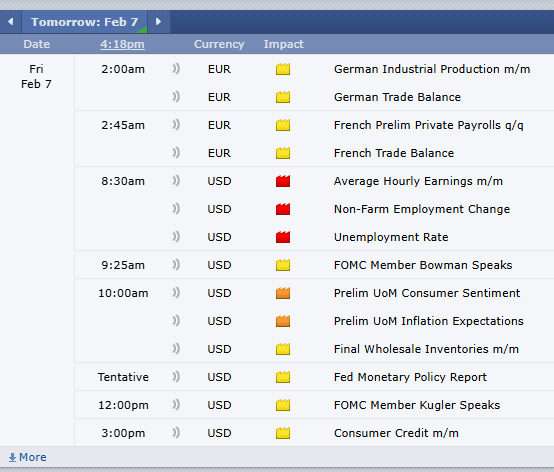
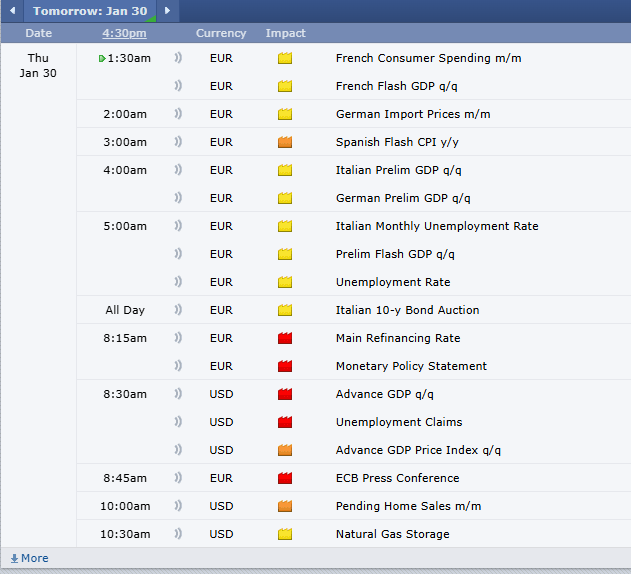
Economic Reports
provided by: ForexFactory.com
All times are Eastern Time ( New York)
f2a43cd3 379e 4c80 890c 0fe7e5f0d898

Improve Your Trading Skills

Get access to proprietary indicators and trading methods, consult with an experienced broker at 1-800-454-9572.

Explore trading methods. Register Here

3b644da2 2bee 4d39 8d98 5208a20bec39

* This is not a solicitation of any order to buy or sell, but a current market view provided by Cannon Trading Inc. Any statement of facts here in contained are derived from sources believed to be reliable, but are not guaranteed as to accuracy, nor they purport to be complete. No responsibility is assumed with respect to any such statement or with respect to any expression of opinion herein contained. Readers are urged to exercise their own judgement in trading.

Rollover, CPI & Futures Trading Levels for 03.12.24

Get Real Time updates and more by joining our Private Facebook Group!
Subscribe to our YouTube Channel


C3 1


CPI Tomorrow – Trade June ES/NQ/YM and MICROS

by John Thorpe, Senior Broker


For all of you index traders, you may have noticed the shrinking Open Interest and Volume in the March contracts. It’s that time when volume shifts to the next quarterly expiration contract. June! the symbol is M.

March volume will be drying up quickly, don’t get stuck Friday morning with a March contract at the crack of dawn when the carousel stops. Start trading the June contract today!

According to Bloomberg, the S&P 500 has averaged an 0.8% move on CPI days over the past six months

Today, stocks are sideways, the dollar and gold are both up marginally as investors nervously await tomorrows 7:30 a.m. CDT Consumer Price Index release.

Last Month, on Feb 13th stocks slid sharply following the release and Treasury yields surged higher when a surprise CPI number, an Increase of 0.3% in January, crossed the newswires. Housing costs accounted for much of the price rise.

Overall prices are expected to rise 0.4% percent after increasing 0.3% percent in January. Annual rates, which in January were 3.1% percent overall and 3.9% percent for the core, are expected at 3.1% and 3.7% percent respectively. Per econoday.


Plan your trade and trade your plan


Watch video below on how to rollover from March to June contracts if you are a stock index trader on our E-Futures Platform!


thumbnail?url=http%3A%2F%2Fi.vimeocdn


37d7a522 9491 476e bccd 5d86442eda21


stars

e35cb555 9ff3 4f00 9fe8 0655b28fbd90

Daily Levels for March 12th, 2024

700b4a89 9678 42c2 b57f 894fc90822f3

b0ba1776 c0cd 4536 92c1 eef6595d7173

Economic Reports
provided by: ForexFactory.com
All times are Eastern Time ( New York)
1c9e26e4 46da 486b bf63 f4f09f2959a4

Improve Your Trading Skills

Get access to proprietary indicators and trading methods, consult with an experienced broker at 1-800-454-9572.

Explore trading methods. Register Here

3b644da2 2bee 4d39 8d98 5208a20bec39

* This is not a solicitation of any order to buy or sell, but a current market view provided by Cannon Trading Inc. Any statement of facts here in contained are derived from sources believed to be reliable, but are not guaranteed as to accuracy, nor they purport to be complete. No responsibility is assumed with respect to any such statement or with respect to any expression of opinion herein contained. Readers are urged to exercise their own judgement in trading.

Analysis of gold as we hit all time highs!

Get Real Time updates and more by joining our Private Facebook Group!
Subscribe to our YouTube Channel


C20


Gold’s Performance Against U.S., Asian Equities the Past Century

By Erik Norland of CMEGroup.com

Is gold a more profitable investment than equities over the long term? Our finding is that the value of gold has mostly held its own against the U.S. equity market since the S&P 500 time series began over 94 years ago (Figure 1). A well-defined picture of their performance through peaks and troughs is evident when the S&P 500 dollar value is repriced in gold, which is done by dividing the S&P 500 by the U.S. dollar price of one troy ounce of bullion (Figure 2).

Figure 1: Overall, gold has nearly held its own versus equities over the past 100 years.


4499bac2 55ef 41f7 a541 21479a9e17a1


9c1e2f79 fcaf 47e3 99b1 0d460c5f0683


The S&P 500/gold ratio has been subject to extremely strong trends and occasional periods of consolidation which correspond with different economic and geopolitical situations, some of which benefitted equities relative to gold and vice versa. Generally, equities have done better than gold during periods of geopolitical stability, disinflation and steady economic growth, while gold tends to outperform during periods of instability. Switching from one circumstance to another can set off powerful trends in the S&P 500/gold ratio that can last for years, even decades. The same goes for Asian equity markets when compared to gold, although the price history isn’t as long and the patterns differ both in equity market performance and trends in the currency market.

Since the equity market’s peak on September 3, 1929, the S&P 500/gold ratio has been through six distinct eras:

  • 1929-1942: The Great Depression and the Rise of the Axis Powers: Between 1929 and 1933 S&P 500 fell by 86% in U.S. dollar terms. In 1933, the incoming Roosevelt Administration’s first action was to devalue the dollar versus gold from $23 to $35 per ounce, a 52% gain for anyone who was still able to hold on to gold. Between 1933 and 1942, equities stagnated as the U.S. struggled to recover from the Depression and as the Axis Powers of Germany, Italy and Japan reached their peak of expansion in 1942.
  • 1942-1968: Allied Victory, Bretton Woods and Superpower Parity: as the Allies turned the tide in the war, equity markets began to rally. Stocks continued upward with only brief pauses around the time of the Korean War and the Cuban missile crisis. Under the post-war Bretton Woods system of fixed exchange rates, the dollar remained fixed at $35 per ounce and foreign currencies were pegged to the dollar. The S&P 500 soared 1,165% versus the dollar and gold.
  • 1968-1980: Overheating and Stagflation: The combination of the Great Society program and Vietnam War overheated the U.S. economy, leading to successive waves of inflation. Amid rising prices, the U.S. dollar peg to gold was no longer tenable. In 1971, the Nixon Administration pulled the plug on Bretton Woods, setting off a rally in gold prices that took the yellow metal from $35 to $800 per ounce by the end of the decade. Equity prices traded sideways in a wide range during this period of uncertainty which also featured the U.S. withdrawal from Vietnam, the 1973 Arab Embargo, the Iranian Revolution and the Soviet invasion of Afghanistan. Relative to gold, the S&P 500 fell by 95%.
  • 1980-2000: Disinflation and Pax Americana: Over the course of two decades the S&P 500 rose by 4,137% versus gold as stock prices soared and precious metals retreated amid tight money, falling inflation and improved economic growth.
  • 2000-2011: The Tech Wreck, War on Terror and the Global Financial Crisis: during this period, the S&P 500 lost 89% in gold terms.
  • 2011-2021: Pax Americana Part 2: From 2011-2019 equities soared amid a slow, low-inflation recovery in the U.S. that sent the price of gold substantially lower. While equities fell in the early stages of the Covid-19 pandemic, fiscal stimulus and $4.9 trillion of Federal Reserve quantitative easing (QE) purchases initially benefitted equities more than gold. Overall, the S&P 500 outperformed gold by 337% during this time.

What’s next? The S&P fell 28% versus gold from late 2021 through 2022, and despite its 2023 rebound led by mega-cap companies dubbed the Magnificent Seven, it remains 5% lower versus gold as of late February 2024 despite being about 6% above its 2021 highs when expressed in dollar terms. A few points are clear:

  • The S&P has lost its upside momentum versus gold.
  • The world may have entered a lasting period of geopolitical instability with Russia and other powers challenging the U.S.-led order.
  • It’s not clear if the U.S. and its peers will return to lastingly low levels of inflation or not.
  • Central banks have conducted the biggest tightening cycle in over 40 years, which may increase the risk of a global economic downturn and subsequent monetary easing.

These points have the potential to turn the tide against U.S. equities, which are highly valued (see our related article here), in favor of hard assets like gold. But what about much less expensive equity markets like those in China, Japan and Korea? South Korea’s KOSPI Index, Japan’s Nikkei 225 and Hong Kong’s Hang Seng Index have their own strong trends versus gold.

READ THE REST


Plan your trade and trade your plan


stars

e35cb555 9ff3 4f00 9fe8 0655b28fbd90

d52986c1 1df3 42ae a9c9 81a1636d587e

Daily Levels for March 6th, 2024

e138b1c7 ee6d 49ff 8cd9 3e8c2466355e

b0ba1776 c0cd 4536 92c1 eef6595d7173

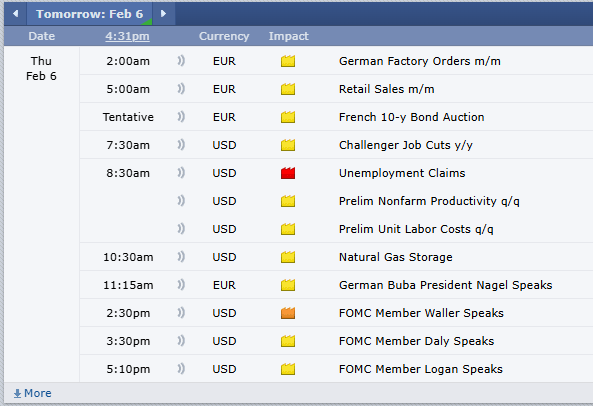
Economic Reports
provided by: ForexFactory.com
All times are Eastern Time ( New York)
3a89076e 8ed6 45ad 9a26 5adbf7a41c4b

Improve Your Trading Skills

Get access to proprietary indicators and trading methods, consult with an experienced broker at 1-800-454-9572.

Explore trading methods. Register Here

3b644da2 2bee 4d39 8d98 5208a20bec39

* This is not a solicitation of any order to buy or sell, but a current market view provided by Cannon Trading Inc. Any statement of facts here in contained are derived from sources believed to be reliable, but are not guaranteed as to accuracy, nor they purport to be complete. No responsibility is assumed with respect to any such statement or with respect to any expression of opinion herein contained. Readers are urged to exercise their own judgement in trading.

Weekly Newsletter: Hedging Guide, Copper Outlook, CME Fees, 1099s and more….

Get Real Time updates and more by joining our Private Facebook Group!
Subscribe to our YouTube Channel

C7

Cannon Futures Weekly Letter Issue # 1180

In this issue:
  • Important Notices – 1099 Forms, CME Fees, FN & LT Days
  • Trading Resource of the Week – Futures Hedging Self Study Guide
  • Hot Market of the Week – March Copper
  • Broker’s Trading System of the Week – ES Day Trading System
  • Trading Levels for Next Week
  • Trading Reports for Next Week


Important Notices –

    • 1099 forms will be generated for all futures trading accounts held by US clients that placed any trades during the 2023 calendar year. Traders should expect to receive their 1099 forms via mail, email or through their portal in early February.
    1099 forms will be provided directly from the FCM to the client.
    • CME Fees Increase Update:
    In a Special Executive Report released by the CME Group, it was announced that effective February 1, 2024, a number of transaction fees will see amended (increased) exchange / transaction fees.
    Effective February 1, the CME Group is raising the exchange fees for a number of futures contracts.
    For the CME E-mini equity products: E-mini S&P 500 (ES), E-mini Nasdaq (NQ), E-mini Dow Jones (YM) and E-mini Russelll 2000 (RTY), fees are going up by 5 cents, from $1.33 to $1.38
    For the NYMEX energy products: Crude oil (CL), Heating oil (HO), RBOB Unleaded gas (RBOB) and Natural gas (NG) fees are going up by 10 cents, from $1.50 to $1.60
    For the COMEX metals products: Gold (GC), Silver (SI), Copper (HG) and Platinum (PL) fees are going up by 5 cents, from $1.55 to $1.60
    For the COMEX E-mini metals products: miNY gold (QO), miNY silver (QI), miNY copper (QC) fees are going up by 25 cents, from $0.75 to $1.00
    • 566 earnings reports next week
    • WASDE Report
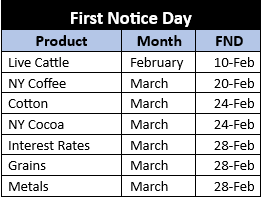
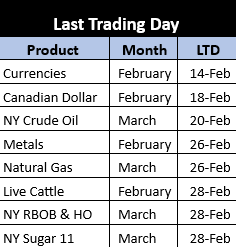
    • Below are the contracts which are entering First Notice or Last Trading Day for the upcoming month. Be advised, for contracts that are deliverable, it is requested that all LONG positions be exited two days prior to First Notice and ALL positions be exited the day prior to Last Trading Day.


15f00cdd 3f37 45e7 912f e2a65dd8dac1

a45fd02b 3f79 439b 9d63 d85c5f8060d2


Trading Resource of the Week : Futures Hedging Self Study Guide!

Self-Study Guide to Hedging with Grain and Oilseed Futures and Options. Regardless if you are a farmer, rancher or simply looking to trade grains and livestock futures, this guide will help you understand the ins and outs of trading and hedging using futures and options.


stars

3b644da2 2bee 4d39 8d98 5208a20bec39


  • Hot Market of the Week – March Copper
Hot market of the week is provided by QT Market Center, A Swiss army knife charting package that’s not just for Hedgers, Cooperatives and Farmers alike but also for Spread traders, Swing traders and shorter time frame application for intraday traders with a unique proprietary indicator that can be applied to your specific trading needs.
March Copper
March copper completed its first upside PriceCount objective and has settled into a range bound trade. IF the chart can resume its rally with new sustained highs, it would project a possible run to the second count in the 4.03 area, consistent with a challenge of the August high.
PriceCounts – Not about where we’ve been , but where we might be going next!
f750ea81 e272 4244 96ba 96b278e2ebfe
The PriceCount study is a tool that can help to project the distance of a move in price. The counts are not intended to be an ‘exact’ science but rather offer a target area for the four objectives which are based off the first leg of a move with each subsequent count having a smaller percentage of being achieved. It is normal for the chart to react by correcting or consolidating at an objective and then either resuming its move or reversing trend. Best utilized in conjunction with other technical tools, PriceCounts offer one more way to analyze charts and help to manage your positions and risk. Learn more at www.qtchartoftheday.com
Trading in futures, options, securities, derivatives or OTC products entails significant risks which must be understood prior to trading and may not be appropriate for all investors. Past performance of actual trades or strategies is not necessarily indicative of future results.
  • Broker’s Trading System of the Week

With algorithmic trading systems becoming more prevalent in portfolio diversification, the following system has been selected as the broker’s choice for this month.
PRODUCT
SYSTEM TYPE
Intraday
COST
USD 85 / monthly
Recommended Cannon Trading Starting Capital
$15,000
7b6bf49c d044 497a b7ce c46ac6e0b59c
The performance shown above is hypothetical in that the chart represents returns in a model account. The model account rises or falls by the average single contract profit and loss achieved by clients trading actual money pursuant to the listed system’s trading signals on the appropriate dates (client fills), or if no actual client profit or loss available – by the hypothetical single contract profit and loss of trades generated by the system’s trading signals on that day in real time (real‐time) less slippage, or if no real time profit or loss available – by the hypothetical single contract profit and loss of trades generated by running the system logic backwards on back adjusted data. Please read full disclaimer HERE.
Would you like to receive daily support & resistance levels?
Yes
S
No
S


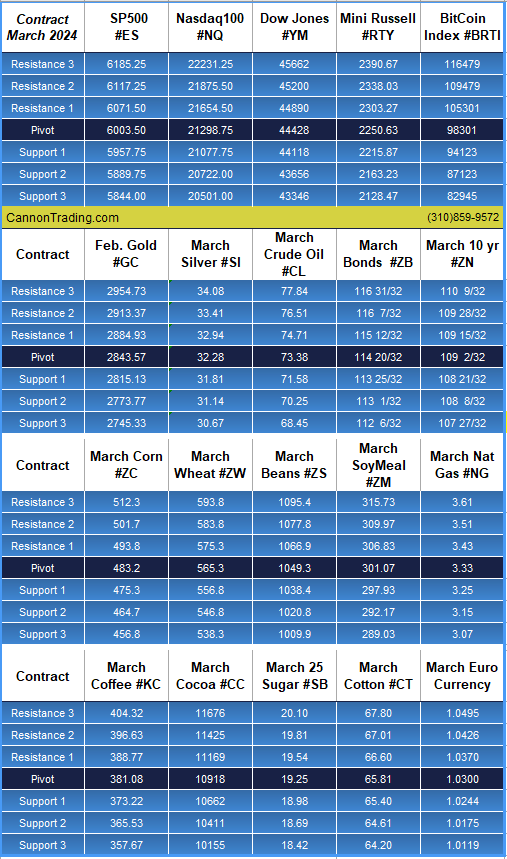
Daily Levels for February 5th 2024

#ES, #NQ, #YM, #RTY, #XBT, #GC, #SI, #CL, #ZB, #6E, #ZC, #ZW, #ZS, #ZM, #NG

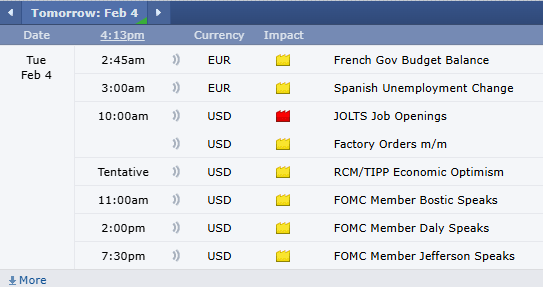
Trading Reports for Next Week

03ad0b5d 1dc3 4ead a762 71793cfcf351

Trading Reports for Next Week

First Notice (FN), Last trading (LT) Days for the Week:
bb845aee 06a2 4ef3 93ab a67cc5d5f29f

Improve Your Trading Skills

Get access to proprietary indicators and trading methods, consult with an experienced broker at 1-800-454-9572.

Explore trading methods. Register Here

* This is not a solicitation of any order to buy or sell, but a current market view provided by Cannon Trading Inc. Any statement of facts here in contained are derived from sources believed to be reliable, but are not guaranteed as to accuracy, nor they purport to be complete. No responsibility is assumed with respect to any such statement or with respect to any expression of opinion herein contained. Readers are urged to exercise their own judgement in trading.

Quadruple Witching + Futures Trading Levels for Dec 15th

Get Real Time updates and more on our private FB group!

Join our Private Facebook group

Subscribe to our YouTube Channel


Stock Index December contracts (i.e., E-mini and Micro S&P, Nasdaq, Dow Jones and Russell 2000.) expire Friday, December 15th (8:30 A.M., Central Time). At that point, trading in these contracts halts. Stock index futures are CASH SETTLED contracts. If you hold any December futures contracts through 8:30 A.M., Central Time on Friday, Dec. 15th, they will be offset with the cash settlement price, as set by the exchange.

FRONT MONTH IS NOW MARCH , the symbol is H24, example for mini SP is ESH24

 Monday, December 18th is Last Trading Day for December currency futures. It is of the utmost importance for currency traders to exit all December futures contracts by Friday, December 15th and to start trading the March futures. Currency futures are DELIVERABLE contracts.

The month code for March is ‘H.’  Please consider carefully how you place orders when changing over.


3b644da2 2bee 4d39 8d98 5208a20bec39


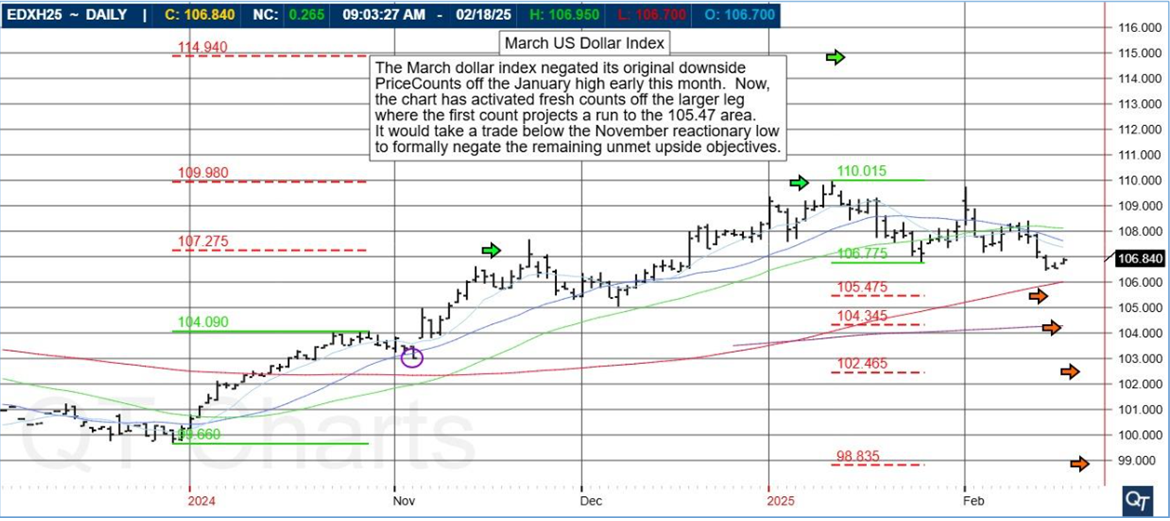
US$ Daily Chart below:

7e74aa1c 889c 4527 b538 2605c05969da


Trading Futures, Options on Futures, and retail off-exchange foreign currency transactions involves substantial risk of loss and is not suitable for all investors.  You should carefully consider whether trading is suitable for you in light of your circumstances, knowledge, and financial resources. You may lose all or more of your initial investment. Opinions, market data, and recommendations are subject to change at any time when it comes to Futures Trading.

Futures Trading Levels


12-15-2023


#ES, #NQ, #YM, #RTY, #XBT, #GC, #SI, #CL, #ZB, #6E, #ZC, #ZW, #ZS, #ZM, #NG

Improve Your Trading Skills

Get access to proprietary indicators and trading methods, consult with an experienced broker
 1-800-454-9572 Explore trading methods. Register Here


Economic Reports,

Source: 

Forexfactory.com


9453a470 89ce 4b3f a8c3 de2423acdb90


This is not a solicitation of any order to buy or sell, but a current market view provided by Cannon Trading Inc. Any statement of facts here in contained are derived from sources believed to be reliable, but are not guaranteed as to accuracy, nor they purport to be complete. No responsibility is assumed with respect to any such statement or with respect to any expression of opinion herein contained. Readers are urged to exercise their own judgement in trading.

FOMC Rate Decision Tomorrow +Futures Trading Levels 12.13.2023

Get Real Time updates and more on our private FB group!

Join our Private Facebook group

Subscribe to our YouTube Channel


March is front month for stock indices.

Symbol for March is H, so example ESH24


FOMC Rate decision tomorrow.

The following are my PERSONAL OPINION on trading during FOMC days:

  • Reduce trading size


  • Be extra picky = no trade is better than a bad trade


  • Choose entry points wisely. Look at longer time frame support and resistance for entry. Take the approach of entering at points where you normally would have placed protective stops. Example, trader x looking to go long the mini SP at 4425.00 with a stop at 4419.00, instead “stretch the price bands” due to volatility and place an entry order to buy at 4419.75 and place a stop a few points below in this hypothetical example ( consider current volatility along with support and resistance levels).


  • Expect the higher volatility during and right after the announcement


  • Expect to see some “vacuum” ( low volume, big zigzags) right before the number.
  • Consider using automated stops and limits attached to your entry order as the market can move very fast at times.
  • Know what the market was expecting, learn what came out and observe market reaction for clues
  • The rate announcement comes out exactly at 1 PM central. As of this morning there is a 98% chance of no change in rates.
  • Traders will pay EXTRA attention to the language and the Q&A which starts at 1:30 PM Central


  • Be patient and be disciplined


  • If in doubt, stay out!!

Mini SP ( March contract) one possible outlook is below using the daily chart and QT Market Center platform.

0adf2880 a6d2 4460 a50d 2829f51b3eac

Plan your trade and trade your plan.


bb70481e b43a 4636 9888 17c384581052


Trading Futures, Options on Futures, and retail off-exchange foreign currency transactions involves substantial risk of loss and is not suitable for all investors.  You should carefully consider whether trading is suitable for you in light of your circumstances, knowledge, and financial resources. You may lose all or more of your initial investment. Opinions, market data, and recommendations are subject to change at any time when it comes to Futures Trading.

3b644da2 2bee 4d39 8d98 5208a20bec39

Futures Trading Levels


12-13-2023

#ES, #NQ, #YM, #RTY, #XBT, #GC, #SI, #CL, #ZB, #6E, #ZC, #ZW, #ZS, #ZM, #NG

#ES, #NQ, #YM, #RTY, #XBT, #GC, #SI, #CL, #ZB, #6E, #ZC, #ZW, #ZS, #ZM, #NG


Improve Your Trading Skills

Get access to proprietary indicators and trading methods, consult with an experienced broker
 1-800-454-9572 Explore trading methods. Register Here


Economic Reports,

Source: 

Forexfactory.com

580b229e e3ae 49ca 8780 7d9082acd22b


This is not a solicitation of any order to buy or sell, but a current market view provided by Cannon Trading Inc. Any statement of facts here in contained are derived from sources believed to be reliable, but are not guaranteed as to accuracy, nor they purport to be complete. No responsibility is assumed with respect to any such statement or with respect to any expression of opinion herein contained. Readers are urged to exercise their own judgement in trading.

Weekly Newsletter: Rollover Notice for Stock Index Futures + Futures Trading Levels for Dec. 11th

Cannon Futures Weekly Newsletter Issue # 1174


Join our private Facebook group for additional insight into trading and the futures markets!

In this issue:

  •  Important Notices – Stock Index Rollover!
  • Trading Resource of the Week – Trading Psychology Edge
  • Hot Market of the Week – March Corn Wheat Spread
  • Broker’s Trading System of the Week – Gold Swing Trading System
  • Trading Levels for Next Week
  • Trading Reports for Next Week
  • Important Notices

      • December Rate Decision Wednesday – FOMC
      • Earnings: all after the close
      • Monday ORCL Oracle
      • Wednesday ADBE Adobe
      • Thursday COST Costco
      • Roll to March for the Indices – see below!
Rollover is here for stock indices. i.e., the E-mini and Micro S&P, Nasdaq, Dow Jones and Russell 2000.
  Volume in the December contracts will begin to drop off until their expiration Friday, December 15th (8:30 A.M., Central Time). At that point, trading in these contracts halts. Stock index futures are CASH SETTLED contracts. If you hold any December futures contracts through 8:30 A.M., Central Time on Friday, Dec. 15th, they will be offset with the cash settlement price, as set by the exchange.
FRONT MONTH IS NOW MARCH , the symbol is H24, example for mini SP is ESH24
 Monday, December 18th is Last Trading Day for December currency futures. It is of the utmost importance for currency traders to exit all December futures contracts by Friday, December 15th and to start trading the March futures. Currency futures are DELIVERABLE contracts.
The month code for March is ‘H.’  Please consider carefully how you place orders when changing over.
  • Watch the video below on how to rollover your market depth and charts!

How to roll over Chart and DOM on E-Futures


  • Trading Resource of the Week 

Get An Edge With the Trading Psychology Course
Many experienced traders say that the stiffest challenge you’ll face in becoming a futures trader is conquering your own psyche. Why? Because losing is part of trading, and people hate to lose.
In this “Trading Psychology” Course you will learn:
  • How to examine your patterns and behaviors and recognize when they are holding you back
  • Maintaining self-confidence as a trader even in the face of inexperience
  • The mathematical expectation model and how it can decrease your losses
  • Determining the trading plan that is right for your trading personality
  • Understanding and using Motivation – Risk – Reward to its full advantage
  • Creating effective trading technique strategies
  • Qualities of Successful Traders
  • Hot Market of the Week – March Corn Wheat Spread

Hot market of the week is provided by QT Market Center, A swiss army knife charting package that’s not just for Hedgers, Cooperatives and Farmers alike but also for Spread traders, Swing traders and shorter time frame application for intraday traders with a unique proprietary indicator that can be applied to your specific trading needs.
The March WheatCorn spread accelerated to its third upside PriceCount objective to the $1.52 area and is consolidating its trade. At this point, IF the chart can resume its rally with new sustained highs, we are left with the low percentage fourth count to aim for around $2.27 which would be consistent with a challenge of the summer high.
PriceCounts – Not about where we’ve been , but where we might be going next!
March Wheat - Corn Spread Chart
The PriceCount study is a tool that can help to project the distance of a move in price. The counts are not intended to be an ‘exact’ science but rather offer a target area for the four objectives which are based off the first leg of a move with each subsequent count having a smaller percentage of being achieved. It is normal for the chart to react by correcting or consolidating at an objective and then either resuming its move or reversing trend. Best utilized in conjunction with other technical tools, PriceCounts offer one more way to analyze charts and help to manage your positions and risk. Learn more at www.qtchartoftheday.com
Trading in futures, options, securities, derivatives or OTC products entails significant risks which must be understood prior to trading and may not be appropriate for all investors. Past performance of actual trades or strategies is not necessarily indicative of future results.
3b644da2 2bee 4d39 8d98 5208a20bec39
  • Broker’s Trading System of the Week

With algorithmic trading systems becoming more prevalent in portfolio diversification, the following system has been selected as the broker’s choice for this month.
PRODUCT
SYSTEM TYPE
Intraday
Recommended Cannon Trading Starting Capital
$25,000.00
COST
USD 75 / monthly
1b47bf3d a47c 453e 8ea6 0ad48c776363
The performance shown above is hypothetical in that the chart represents returns in a model account. The model account rises or falls by the average single contract profit and loss achieved by clients trading actual money pursuant to the listed system’s trading signals on the appropriate dates (client fills), or if no actual client profit or loss available – by the hypothetical single contract profit and loss of trades generated by the system’s trading signals on that day in real time (real‐time) less slippage, or if no real time profit or loss available – by the hypothetical single contract profit and loss of trades generated by running the system logic backwards on back adjusted data. Please read full disclaimer HERE.
Sign Up for a Free Personalized Consultation with a Broker from Cannon Trading Company
Questions about the markets? trading? platforms? technology? trading systems? Get answers with a complimentary, confidential consultation with a Cannon Trading Company series 3 broker.
Would you like to receive daily support & resistance levels?
Yes
S
No
S


  • Trading Levels for Next Week

Daily Levels for December 11th, 2023
#ES, #NQ, #YM, #RTY, #XBT, #GC, #SI, #CL, #ZB, #6E, #ZC, #ZW, #ZS, #ZM, #NG
Trading Reports for Next Week
#ES, #NQ, #YM, #RTY, #XBT, #GC, #SI, #CL, #ZB, #6E, #ZC, #ZW, #ZS, #ZM, #NG


d259df9c bf07 4429 9fa8 d12b53c37804

  • click above for a LIVE demo, streaming prices
First Notice (FN), Last trading (LT) Days for the Week: www.mrci.com 
e26088ee 9b21 4fca 831d 41d6a7848d9b

This is not a solicitation of any order to buy or sell, but a current market view provided by Cannon Trading Inc. Any statement of facts herein contained are derived from sources believed to be reliable but are not guaranteed as to accuracy, nor they purport to be complete. No responsibility is assumed with respect to any such statement or with respect to any expression of opinion herein contained. Readers are urged to exercise their own judgment in trading.


Good Trading!
Trading Futures, Options on Futures, and retail off-exchange foreign currency transactions involves substantial risk of loss and is not suitable for all investors. You should carefully consider whether trading is suitable for you in light of your circumstances, knowledge, and financial resources. You may lose all or more of your initial investment. Opinions, market data, and recommendations are subject to change at any time.

NFP Tomorrow! + Futures Trading Levels for 12.08.2023

Get Real Time updates and more on our private FB group!

Join our Private Facebook group

Subscribe to our YouTube Channel


NFP non Farm Payrolls tomorrow!

This is a market moving event right at 7:30 Am central that in the past generated some large and volatile moves.

I personally like to be flat 2 minutes before and resume trading a few minutes after the report is out.

If you have notes from previous NFP, now is the time to review…if you don’t have notes, time to start a trading journal and keep notes in it!

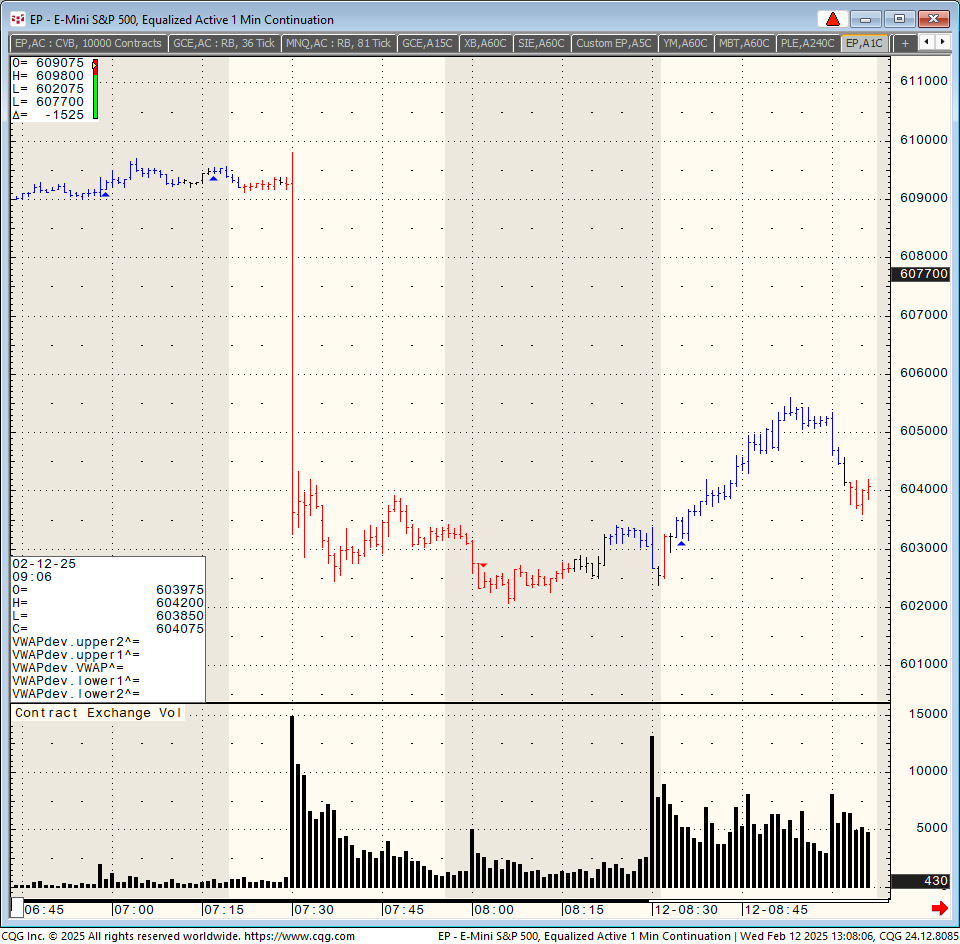
10 Minutes chart of the ES, mini SP500 from last NFP, Nov. 3rd below for your review.

Plan your trade and trade your plan.


#ES Mini S&P 10 min chart


cf236cda 9475 4c39 b078 847ed6b28a5c


Trading Futures, Options on Futures, and retail off-exchange foreign currency transactions involves substantial risk of loss and is not suitable for all investors.  You should carefully consider whether trading is suitable for you in light of your circumstances, knowledge, and financial resources. You may lose all or more of your initial investment. Opinions, market data, and recommendations are subject to change at any time when it comes to Futures Trading.

3b644da2 2bee 4d39 8d98 5208a20bec39

Futures Trading Levels

12-08-2023

#ES, #NQ, #YM, #RTY, #XBT, #GC, #SI, #CL, #ZB, #6E, #ZC, #ZW, #ZS, #ZM, #NG

Improve Your Trading Skills

Get access to proprietary indicators and trading methods, consult with an experienced broker
 1-800-454-9572 Explore trading methods. Register Here


Economic Reports,

Source: 

Forexfactory.com


1cec03a9 4546 4a09 82b0 0f26a9e005e9


This is not a solicitation of any order to buy or sell, but a current market view provided by Cannon Trading Inc. Any statement of facts here in contained are derived from sources believed to be reliable, but are not guaranteed as to accuracy, nor they purport to be complete. No responsibility is assumed with respect to any such statement or with respect to any expression of opinion herein contained. Readers are urged to exercise their own judgement in trading.

Core PCE Tomorrow + Futures Trading Levels for Nov. 30th

Get Real Time updates and more on our private FB group!

Updates and Bullet Points:

By Mark O’Brien, Senior Broker


General: 


While the Federal Reserve and its main voice Jerome Powell have been steadfast in declaring that interest rates would not be coming down unless the FOMC saw broad definitive proof that inflation was falling, traders have been pricing in that eventuality since the end of October. In just the last three weeks, the E-mini S&P 500 climbed out of correction territory and the yield on the 10-year T-note slid from the 5.00% it touched prior to the last Fed meeting down to 4.30% overnight. Never mind the CME Fed watch tool pegs the potential for a 25-basis points rate cut at the Fed’s December 13th meeting at a slim 1.1% and at 3.1% at their January 31st meeting. What likely has traders’ attention: the Fed Funds futures contract sees the probability of a 25-basis point cut at the March 20th Fed meeting at 40.6%. Don’t count on to begin to telegraph any sort of pivot until the Fed deems any signs of slowing growth as entrenched and that should take some time. The Fed will turn a cold shoulder to making quick moves as they do not want to reignite the inflation fire before it is extinguished.


Currency:


As the conversation shifts from rate hikes to cuts, the U.S. dollar is on track to hit its lowest level in months.


Metals:


In the scenario that the dollar and treasury yields continue to fall, look for precious metals like gold and silver to continue their ascent. Gold has already climbed over $200 per ounce in less than two months, from its October 5th close at $1850.80 / ounce to its second day closing above $2050 / ounce yesterday and today (basis February) – a ±$20,000 per contract move for the standard 100-oz. futures contract.


Plan your trade and trade your plan.


cf236cda 9475 4c39 b078 847ed6b28a5c


Trading Futures, Options on Futures, and retail off-exchange foreign currency transactions involves substantial risk of loss and is not suitable for all investors.  You should carefully consider whether trading is suitable for you in light of your circumstances, knowledge, and financial resources. You may lose all or more of your initial investment. Opinions, market data, and recommendations are subject to change at any time when it comes to Futures Trading.

3b644da2 2bee 4d39 8d98 5208a20bec39

Futures Trading Levels

11-30-2023

#ES, #NQ, #YM, #RTY, #XBT, #GC, #SI, #CL, #ZB, #6E, #ZC, #ZW, #ZS, #ZM, #NG

Improve Your Trading Skills

Get access to proprietary indicators and trading methods, consult with an experienced broker
 1-800-454-9572 Explore trading methods. Register Here


Economic Reports, Source: 

Forexfactory.com

d399a2a2 1a8b 4e3b 9193 162ba672516a


This is not a solicitation of any order to buy or sell, but a current market view provided by Cannon Trading Inc. Any statement of facts here in contained are derived from sources believed to be reliable, but are not guaranteed as to accuracy, nor they purport to be complete. No responsibility is assumed with respect to any such statement or with respect to any expression of opinion herein contained. Readers are urged to exercise their own judgement in trading.