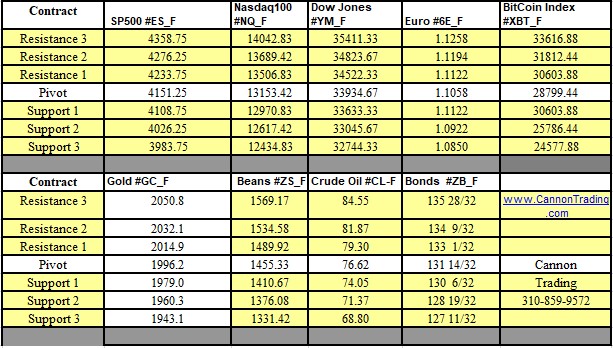
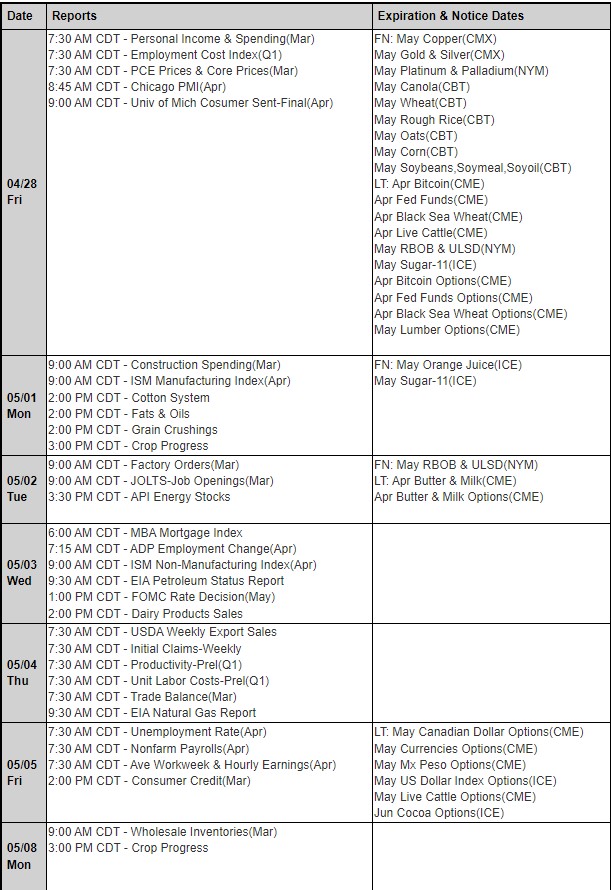
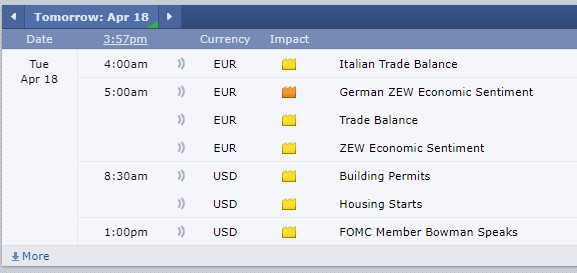
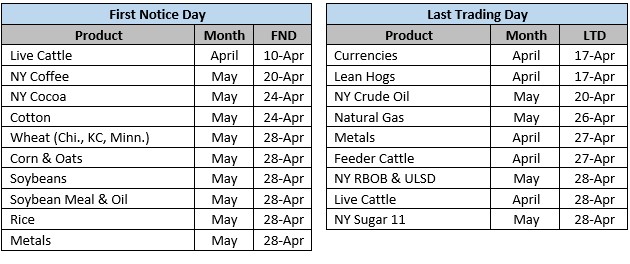
Trading Levels & Economic Reports for 10-14-2011


In this post:

1. Market Commentary
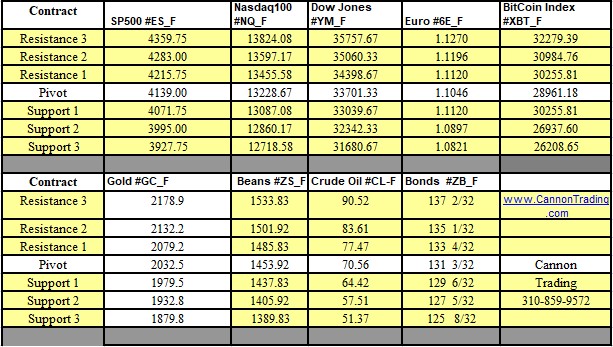
2. Support and Resistance Levels
3. Daily Mini Mini S&P 500 Futures Chart

divider black 190

1. Market Commentary

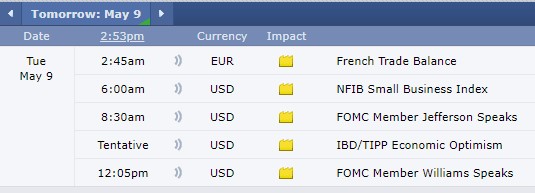
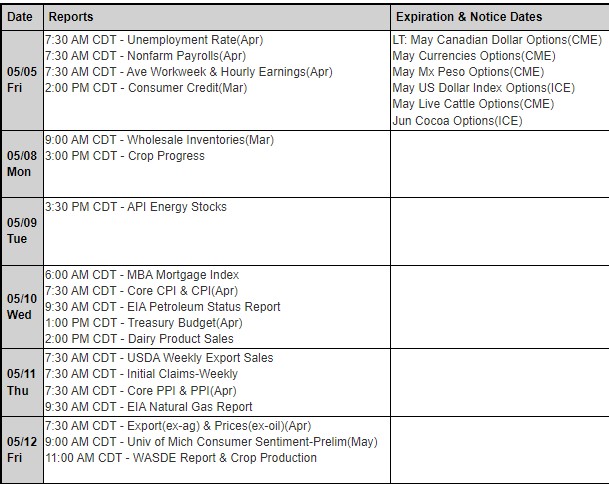
Full day ahead with important economic numbers along with G20 meeting taking place over the weekend. Continue reading “Trading Levels & Economic Reports for 10-14-2011”

Trading Levels & Economic Reports for 10-12-2011

In this post:

1. Real-Time Day Trading Signals Service
2. Support and Resistance Levels
divider black 190

1. Real-Time Day Trading Signals Service

View Ilan’s E Mini S&P 500 charts. Read his trading notes. Hear his commentary. All live!
To get started, simply fill out the short form here!

We will send you your free invitation within one business day.
Please note, a valid email address and phone number are required. Continue reading “Trading Levels & Economic Reports for 10-12-2011”

Trading Levels & Economic Reports for 10-11-2011


In this post:

1. Market Commentary

2. Support and Resistance Levels

3. Daily Mini Mini S&P 500 Futures Chart

divider black 190

1. Market Commentary

Today’s rally was impressive and completed my target I mentioned over a week ago.

We crossed the 50 day moving average and closed above it as well. The BIG question is ” was the fact that this price action took place during a bank holiday on MUCH lower volume be a fake out?”

I guess the next few days will provide answers, in between daily chart of the SP500 ( big Sp, pit session) for your review below ( I included the 50 day Moving Avg. as well as the 100 day moving avg.): Continue reading “Trading Levels & Economic Reports for 10-11-2011”

Last Trading Day of September | Support and Resistance Levels

In this post:

1. Market Commentary
2. Support and Resistance Levels
3. Economic Reports

divider black 190

1. Market Commentary

Last trading day of the month is upon us and for October I would like to wish everyone a month full of trading patience, of wise money management, of disciplined trading and “picky” trades.

If you will be able to control yourself and implement what I mentioned above, it should be a successful trading month! Continue reading “Last Trading Day of September | Support and Resistance Levels”

Trade With Caution, FOMC Day Tomorrow | Support and Resistance Levels

In this post:

1. Market Commentary
2. Support and Resistance Levels
3. Daily Mini S&P 500 Futures Chart
4. Economic Reports
5. Earnings Releases

divider black 190

1. Market Commentary


Front month for Equities (eminis), currencies, bonds and financials and many other markets is now December. You should not be trading almost any September contract of any market.

Note to our clients who are trading with TransactAT:

The latest version is now TransactAT 5.2.2 (download). The newer version can be installed over the older version. Please contact you broker if you need any help.

FOMC tomorrow and before that more than a few economic numbers.

FOMC days have different characteristics than other trading days. If you have traded for a while, check your trading notes from past FOMC days that may help you prepare for tomorrow.

If you are a newcomer, take a more conservative approach and make sure you understand that the news can really move the market- FAST.

My observations suggest choppy, low volume up until announcement, followed by some some sharp volatile moves right during and after the announcement. However, with tomorrow early morning reports, we may see more volatility during first couple of hours as well.

My SWING trading model is currently short the mini Russell from 693 ( target around 672, stop around 716) which may not suite everyone’s stomach ahead of the what maybe volatile overnight and tomorrows FOMC session, but chart for your review below.

If you would like to be included on my SWING trade ideas, send me an email. Continue reading “Trade With Caution, FOMC Day Tomorrow | Support and Resistance Levels”

Key Resistance Level in Futures Trading Price Action | Support and Resistance Levels

Market rallied close to 3% on the SP and Dow Jones. Again it did so on much lighter volume than when it sold off last few weeks but nonetheless one CANNOT argue with price action. We are approaching the 50% retracement level from the highs made on July 8th to lows made Aug 9th. That level on the mini SP is 1212.50. I believe that the 1212 to 1219 zone is an important resistance level to watch. If we break above it with meaningful volume, it may be a sign of further room to the upside, on the other hand if we fail against it and volume picks up with price action going lower, it may be a sign of resumed selling. As always in our business… time will tell. Plenty of economic reports this week, both in the US and in Europe. Last but not least it is the end of the month…. Wishing you great trading this week and Daily chart of the mini SP 500 for your review below.

Daily Futures chart for Mini S&P 500 from August 29th, 2011

Daily Futures chart for Mini S&P 500 from August 29th, 2011

Trading Futures, Options on Futures, and retail off-exchange foreign currency transactions involves substantial risk of loss and is not suitable for all investors. You should carefully consider whether trading is suitable for you in light of your circumstances, knowledge, and financial resources. You may lose all or more of your initial investment. Opinions, market data, and recommendations are subject to change at any time. Continue reading “Key Resistance Level in Futures Trading Price Action | Support and Resistance Levels”

Using Algorithms During High Market Volatility | Support and Resistance Levels

Another day full of two sided moves and volatility.

This type of trading action works well for a set of studies/ ALGO I developed.

You can see a screen shot below which pretty much speaks for itself.

Minute Futures chart for 10,000 Contracts CVB from August 26th, 2011

Minute Futures chart for 10,000 Contracts CVB from August 26th, 2011

I share my studies and ALGO in two ways.

The first is by having a daily live chart service, where subscribers/ trial members get a unique invitation to view my screen along with live charts, trade signals and trade philosophy. I call it live webinar.

The second method is available for sierra charts / ATcharts users . Those who are interested will get my ALGO/ study pac via email and will be able to apply it on their sierra charts for different markets, different time frames etc.

Both methods are available for a free trial if you did not have one yet.

To read more and request a trial, visit our futures trading webinar page or simply send me an email with your sierra/ ATcharts user name.

Have a great weekend!

Trading Futures, Options on Futures, and retail off-exchange foreign currency transactions involves substantial risk of loss and is not suitable for all investors. You should carefully consider whether trading is suitable for you in light of your circumstances, knowledge, and financial resources. You may lose all or more of your initial investment. Opinions, market data, and recommendations are subject to change at any time. Continue reading “Using Algorithms During High Market Volatility | Support and Resistance Levels”

Trading Beliefs and Market Volatility | Support and Resistance Levels

We expect volatility to peak as we approach Friday, ahead of the weekend with Fed Chairman Bernanke speaking In Jackson Hole and Quarterly GDP numbers due early.

Plan for the unexpected. If you are a swing / position trader make sure you have enough “cushion” to sustain these volatile moves and make sure you understand your margin requirements and obligations.

On a different note, GREAT article about “Beliefs” and Trading by Dr. Janice Dorn in our weekly newsletter.

Trading Futures, Options on Futures, and retail off-exchange foreign currency transactions involves substantial risk of loss and is not suitable for all investors. You should carefully consider whether trading is suitable for you in light of your circumstances, knowledge, and financial resources. You may lose all or more of your initial investment. Opinions, market data, and recommendations are subject to change at any time. Continue reading “Trading Beliefs and Market Volatility | Support and Resistance Levels”

Futures Trading Levels, Trading Plans

On Friday I wrote the following regarding today’s session:

I have no idea of what to expect of this market for next week. Probably more volatility?

I guess I will wait and see price action Sunday night and Monday morning before forming an opinion.

Well after today’s price action I favor the downside as I see the close today to be bearish to neutral.

As I wrote before, you can have the right market direction and feel for the market and still lose… Maybe more important is the trading plan, i.e entry level, potential targets and stops etc. or to make it short….PLAN YOUR TRADE, TRADE YOUR PLAN.

Daily chart of the DOW JONES CASH index for your review below:

Daily Futures chart of the Dow Jones Cash Index from August 22nd, 2011

Daily Futures chart of the Dow Jones Cash Index from August 22nd, 2011

Trading Futures, Options on Futures, and retail off-exchange foreign currency transactions involves substantial risk of loss and is not suitable for all investors. You should carefully consider whether trading is suitable for you in light of your circumstances, knowledge, and financial resources. You may lose all or more of your initial investment. Opinions, market data, and recommendations are subject to change at any time. Continue reading “Futures Trading Levels, Trading Plans”