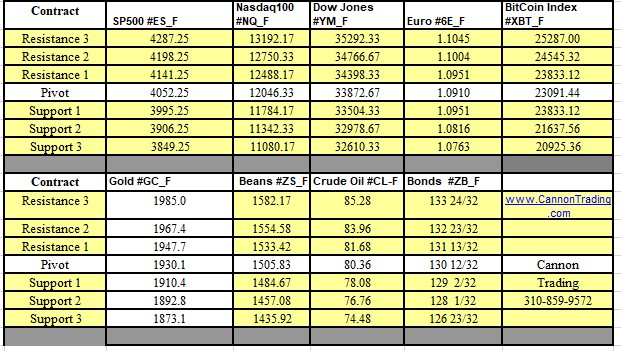
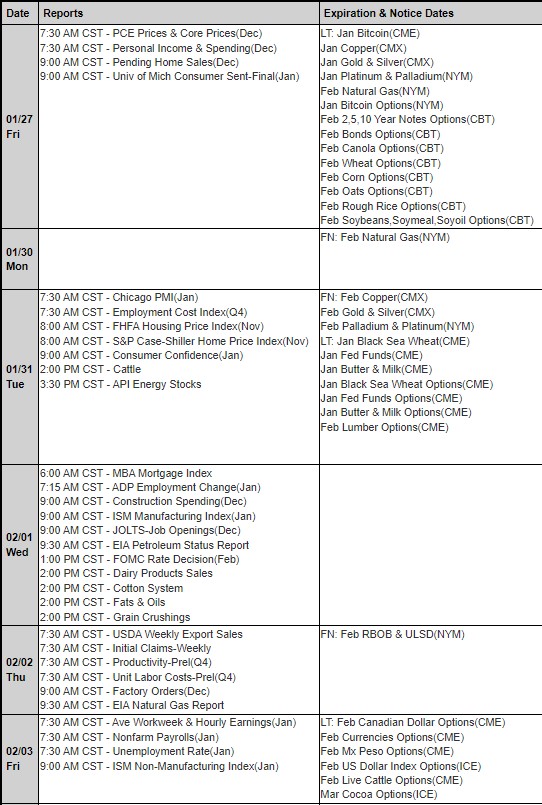
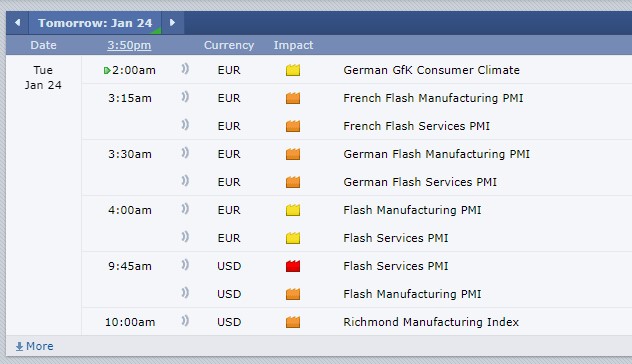
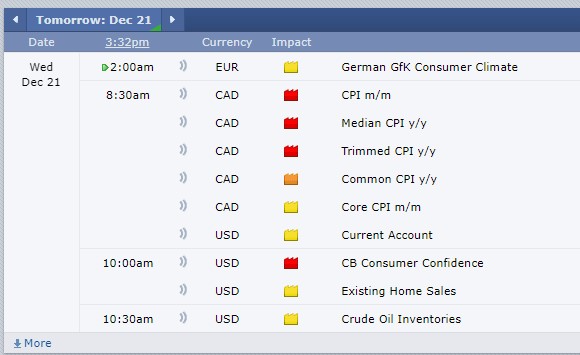
Thanksgiving Short Trading Week | Support and Resistance Levels

Jump to a section in this post:
1. Market Commentary
2. Support and Resistance Levels – S&P, Nasdaq, Dow Jones, Russell 2000
3. Support and Resistance Levels – Gold, Euro, Crude Oil, T-Bonds
4. Support and Resistance Levels – Corn, Wheat, Beans, Silver
5. Economic Reports for Wednesday, November 23, 2011

divider black 190

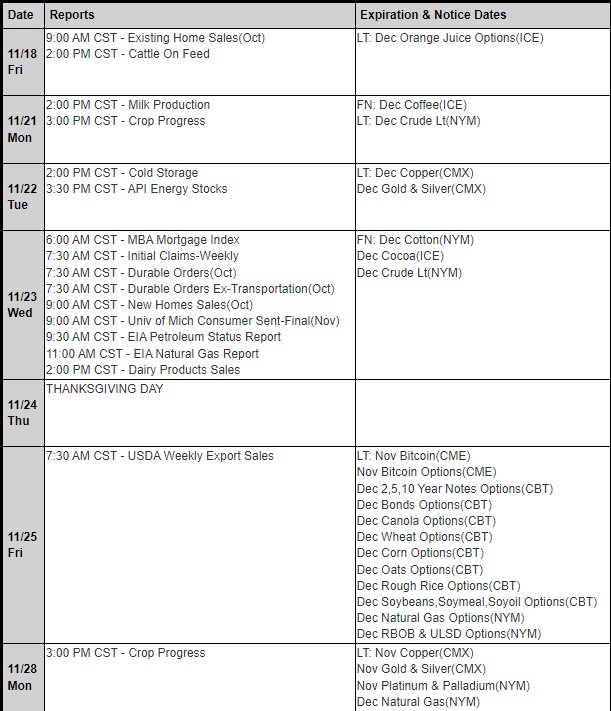
Short trading week with Thanksgiving on Thursday.

Make sure you pay attention to trading hours for both Thursday and Friday this week.

Example below is for STOCK INDEX futures trading on globex. Make sure to visit the links below for complete trading holiday schedule for markets of your interest:

Wednesday Nov. 23rd – Regular close and regular re-open at 15:30 central time

Thursday Nov. 24th – markets will HALT trading at 10:15 Am central time and resume trading at 17:00 Central time

Friday Nov. 25th – Markets will close at 12:15 central time.

Please visit CME at:

http://www.cmegroup.com/tools-information/holiday-calendar/files/2011-thanksgiving.pdf

and the ICE exchange at

https://www.theice.com/marketdata/calendar/CalendarList.shtml Continue reading “Thanksgiving Short Trading Week | Support and Resistance Levels”

Measuring your Trading Progress | Support and Resistance Levels

Jump to a section in this post:
1. Market Commentary
2. Support and Resistance Levels – S&P, Nasdaq, Dow Jones, Russell 2000
3. Support and Resistance Levels – Gold, Euro, Crude Oil, T-Bonds
4. Economic Reports for Friday, November 18, 2011

divider black 190

1. Market Commentary

Some weekend reading material by a colleague of mine, Jim Wyckoff:

10 Key Questions on Measuring Your Trading Progress, Success
At some point in nearly everyone’s trading timelines, they wonder how their trading successes (or failures) compare with those of other traders. Wondering just how well you stack up to other traders in the industry is a natural curiosity and a human psychological tendency. However, actually knowing the success or failure rates of others doesn’t do a lot to move you farther down the road of where you want to be regarding trading success.
Most traders also wonder about the success rates of the “professional” traders-the ones who make their living solely by the profits they generate from trading. I will provide you with an answer to this question at the end of this feature.
Below are 10 questions regarding measuring your own trading progress and success. These questions should help you determine where you stand in this challenging field of endeavor.
1. What is trading “success?” This is a most basic question. Most would agree that ultimate trading success is defined as being profitable at trading-making more money than you lose. There are other secondary factors that also define success in trading, such as finding a “balance” between trading and other life activities. But it’s being profitable at trading that is the benchmark of defining success. Continue reading “Measuring your Trading Progress | Support and Resistance Levels”

Futures Trading Advice | Support and Resistance Levels

Jump to a section in this post:
1. Market Commentary
2. Support and Resistance Levels – S&P, Nasdaq, Dow Jones, Russell 2000
3. Support and Resistance Levels – Gold, Euro, Crude Oil, T-Bonds
4. Daily Mini S&P Chart
5. Economic Reports for Friday, November 18, 2011

divider black 190

1. Market Commentary

We tested the lower borders of this wide band I have talked about over the last few days.

1204.50 to the psychological 1200 level are the first line of defense.

Volatility is picking up another notch again and we saw a sharp sell off in matter of minutes intraday around 11 AM central.

Brings me to a point I have mentioned before many times….and while I hate sounding like a broken record, I hope that by repeating this I may help clients and traders:

ALWAYS EXPECT THE UNACCEPTED! When volatility skyrockets like now, moves become extreme, the speed of the market really picks up and this is when one must adjust their trading size lower to accommodate for the wilder and wider moves.
It is my opinion to have AUTOMATIC stops entered if you are a daytrader. All our trading platforms offer “auto brackets” that allow you to place limits and stops as soon as position entered. Please contact your broker if you need help with this feature. Continue reading “Futures Trading Advice | Support and Resistance Levels”

Fifteen Minute Mini SP and Ten Year Notes Charts | Looking at Markets for Day-Trading | Support and Resistance Levels

Jump to a section in this post:
1. Market Commentary
2. Support and Resistance Levels – S&P, Nasdaq, Dow Jones, Russell 2000
3. Support and Resistance Levels – Gold, Euro, Crude Oil, T-Bonds
4. Economic Reports for Friday November 11, 2011

divider black 190

1. Market Commentary

Another trading day brings me to a different topic.

Most of our clients trade stock index futures, like mini SP 500, Mini Russell, Mini Dow Jones futures as well as the DAX and eurostoxx over at Europe ( which appeal to some traders because of the different times these markets are active) etc.

Even within this market group, different markets will behave differently because of difference in the underlying product as well as volume and more. Example the mini Russell 2000 versus the mini SP500.

The mini Russell is a little more “erratic”, bigger, spikier, quicker moves. Mainly because it has less volume than the mini SP 50 but also because the cash index includes the 500 SP stocks plus additional 1500 stocks….

With the growth of electronic trading, volume in Grains, interest rates, currencies, metals, energies and other segments have grown enough that many of these markets are “suitable” for day-trading.

The following is a small list of markets you may want to follow, trade in demo and consider for your day-trading. Another point to keep in mind that some of these markets have lower exchange fees, hence your total transaction costs can be lower!

Indices as discussed above

Currencies ( Euro, Yen, British Pound, Canadian Dollar, Australian dollar)

Interest rates ( US bonds/ 30 years, Ten Years, Five years and even the ULTRA bond contract is picking up volume)

Energies ( mostly Crude oil and Natural gas)

Metals ( gold and silver)

Grains ( beans, corn and wheat)

So the main point I am trying to make today is that there are other markets you may want to look at for day-trading. Some markets fit some traders better because maybe they “respect the trend better”, maybe less volatile or simply because they just are a better match for the trader’s personality on the other side. Some markets are more suitable for “trend following” intraday techniques, while other maybe better for counter trend trading style.
Below you will see two different 15 minutes charts, one of the mini SP 500, the other of the Ten year notes. Continue reading “Fifteen Minute Mini SP and Ten Year Notes Charts | Looking at Markets for Day-Trading | Support and Resistance Levels”

Download Critical Trading Lessons | Support and Resistance Levels


In this post:

1. Market Commentary
2. Support and Resistance Levels

divider black 190

1. Market Commentary

Download 14 Critical Lessons Every Trader Should Know

Dear Trader,

You know how difficult it can be to successfully trade the markets. The volatility we’ve seen lately does offer great opportunities, but it can also derail even the most experienced trader. That’s why our friends at Elliott Wave International are releasing one of their most popular trading eBooks — The Best of Trader’s Classroom — free through November 7.

Since 1999, EWI Senior Analyst and trading instructor Jeffrey Kennedy has produced dozens of exclusive Trader’s Classroom lessons for his subscribers. EWI reviewed over 100 lessons and selected the 14 which offer the most critical information that every trader should know.

Now you can download these valuable lessons in their 45-page Best of Trader’s Classroom eBook, free.

You’ll learn:
Why Emotional Discipline Is Key to Success
When to Place a Trade
How to Set Protective Stops
What It Takes to be a Consistently Successful Trader
And 10 more!

Download Your Free Best of Trader’s Classroom eBook Today.
(Don’t hesitate! This offer expires November 7.) Continue reading “Download Critical Trading Lessons | Support and Resistance Levels”

Trading Levels & Economic Reports for 10-14-2011


In this post:

1. Market Commentary
2. Support and Resistance Levels
3. Daily Mini Mini S&P 500 Futures Chart

divider black 190

1. Market Commentary

Full day ahead with important economic numbers along with G20 meeting taking place over the weekend. Continue reading “Trading Levels & Economic Reports for 10-14-2011”

Trading Levels & Economic Reports for 10-12-2011

In this post:

1. Real-Time Day Trading Signals Service
2. Support and Resistance Levels
divider black 190

1. Real-Time Day Trading Signals Service

View Ilan’s E Mini S&P 500 charts. Read his trading notes. Hear his commentary. All live!
To get started, simply fill out the short form here!

We will send you your free invitation within one business day.
Please note, a valid email address and phone number are required. Continue reading “Trading Levels & Economic Reports for 10-12-2011”

Trading Levels & Economic Reports for 10-11-2011


In this post:

1. Market Commentary

2. Support and Resistance Levels

3. Daily Mini Mini S&P 500 Futures Chart

divider black 190

1. Market Commentary

Today’s rally was impressive and completed my target I mentioned over a week ago.

We crossed the 50 day moving average and closed above it as well. The BIG question is ” was the fact that this price action took place during a bank holiday on MUCH lower volume be a fake out?”

I guess the next few days will provide answers, in between daily chart of the SP500 ( big Sp, pit session) for your review below ( I included the 50 day Moving Avg. as well as the 100 day moving avg.): Continue reading “Trading Levels & Economic Reports for 10-11-2011”