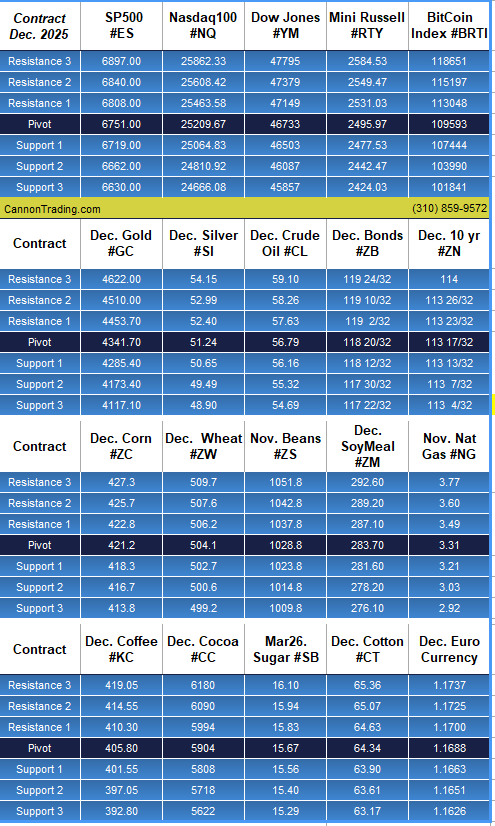
At-a-Glance Levels
| Instrument |
S2 |
S1 |
Pivot |
R1 |
R2 |
|
|
| Gold (GC) — Dec (GCZ5) |
4173.40 |
4285.40 |
4341.70 |
4453.70 |
4510.00 |
|
|
| Silver (SI) — Dec (SIZ5) |
49.49 |
50.65 |
51.24 |
52.40 |
52.99 |
|
|
| Crude Oil (CL) — Nov (CLX5) |
55.32 |
56.16 |
56.79 |
57.63 |
58.26 |
|
|
| Dow Jones (YM) — Dec 2025 |
46087 |
46503 |
46733 |
47149 |
47379 |
|
|
Over the past few months, and especially in recent weeks, we’ve seen unusually large overnight moves. Some moves appear random, others reverse quickly, and some are driven by headlines such as tariff news. These dynamics have increased gap risk, reduced overnight liquidity, and produced frequent open-time dislocations.
Common question
Where is the edge?
Short answer
- Trade the first 30 minutes and focus on short-term gap-fill or rejection setups.
- Use same-day options when you expect a large directional move to limit tail risk and avoid being stopped out only to see the market move in your favor.
- Trade spreads when relative strength diverges across instruments (for example, gold vs silver or mini-Dow vs ES).
Extended answer
I want to focus on the practical elements of trading like pre-market context, move behavior, market news correlation, liquidity, options limits, and whether to use mean reversion or momentum. I’ll also want to highlight key parts like risk management, stop placement, and position sizing. Planning should be direct with a simple checklist and no more than six sections. I should also consider using a relevant citation about tariff-related movements, but just one, and make sure it’s only placed where necessary. No framing or extra explanations.
Futures day-trading edge
You find edge by matching a repeatable hypothesis to the current market regime, then executing it with strict risk and execution rules.
Regime diagnosis (what the market is doing now)
- Volatility regime: large overnight gaps and erratic premarket prints mean the market is in a news-driven, headline-sensitive volatility regime.
- Catalyst profile: moves are often tied to macro headlines and tariff noise; those headlines create directional gaps that either persist into the session or sharply reverse at the open.
- Liquidity profile: overnight liquidity is thin and fragmented, increasing slippage and fake outs at the open.
Reliable, tradeable edges you can use
- Pre-open directional bias with size filter. Trade opens when overnight gap exceeds a threshold (e.g., 0.5% or X ticks) and pre-market order flow confirms (sustained prints, not one-off sweep).
- Use reduced size and wider stops for gaps caused by headline noise.
- Fade headline gap into first 30 minutes when structure is weakIf gap lacks follow-through volume and price fails to make a clean microstructure breakout, favor mean reversion to the first-tail or VWAP.
- Trend-follow breakouts in high conviction regimeWhen overnight move is accompanied by aligned macro flow (rates, FX, commodities) and volume ramps into the open, follow momentum with a continuation plan.
- Volatility arbitrage playsUse options or calendar spreads where available to sell realized volatility after spikes and buy protection around known headline windows.
- Session-timing edgeTrade smaller and tighter in the first 15–30 minutes after the open; increase size after the market establishes structure (first clean high/low and confirmation).
- Microstructure edge: limit vs market tacticsUse passive limit entries near structural levels and aggressive exits into liquidity. Avoid market entries into thin pre-open auction prints.
Concrete execution rules (checklist)
- Pre-market checklist: identify gap size, top 3 headlines, correlated markets (bonds, FX, oil), and pre-open volume trend.
- Entry rules: require either structural confirmation (higher high / lower low) or a mean-reversion setup with defined edge-to-risk ratio ≥ 2:1.
- Sizing: reduce notional by 25–50% on headline-driven nights; increase only after two clean consecutive edges are realized.
- Stops and targets: place stop where edge invalidates (clearly definable price level); scale out at predefined targets; never trade without a stop.
- Slippage buffer: add tick buffer to stops and profit targets during thin liquidity opens.
How to test and keep the edge
- Backtest regime-specific rules: label historical sessions by overnight gap size and headline events, test mean-reversion vs momentum rules separately.
- Forward-test with small capital: run a two-week rolling simulator and log slippage, win rate, and expectancy.
- Adaptive rules: codify a volatility threshold that switches you between momentum and fade strategies automatically.
Brief trade plan template
- Hypothesis: (e.g., “Overnight tariff headline caused a 0.7% gap that lacks confirmatory volume; first 20 minutes will mean-revert to VWAP.”)
- Entry: limit at VWAP + X ticks or on 1-minute reversal candle.
- Stop: invalidation beyond the overnight high/low + slippage buffer.
- Target: partial at VWAP, final at first structure level.
- Size: 50% normal when gap driver = headline; full size only when macro alignment confirmed.
Be systematic: diagnose regime, pick the strategy that historically wins in that regime, enforce execution and risk rules, and iterate from measured data.
Important: Trading commodity futures and options involves a substantial risk of loss.
The recommendations contained in this blog are of opinion only and do not guarantee any profits.
Past performances are not necessarily indicative of future results.
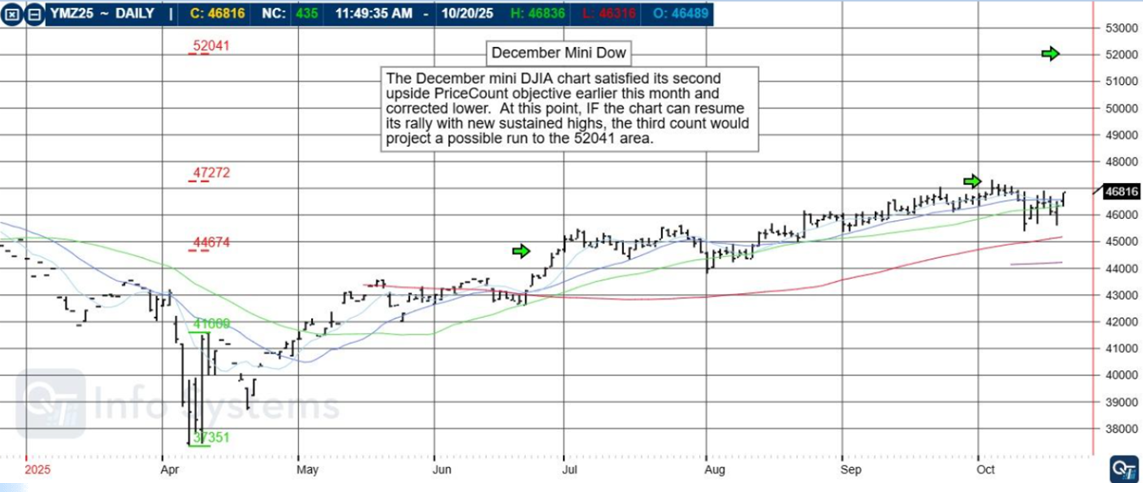
December Mini DOW
The December mini DJIA chart satisfied its second upside PriceCount objective earlier this month and corrected lower. At this point, IF the chart can resume its rally with new sustained highs, the third count would project a possible run to the 52041 area. |
|
|
The PriceCount study is a tool that can help to project the distance of a move in price. The counts are not intended to be an ‘exact’ science but rather offer a target area for the four objectives which are based off the first leg of a move with each subsequent count having a smaller percentage of being achieved.
It is normal for the chart to react by correcting or consolidating at an objective and then either resuming its move or reversing trend. Best utilized in conjunction with other technical tools, PriceCounts offer one more way to analyze charts and help to manage your positions and risk. Learn more at www.qtchartoftheday.com
Trading in futures, options, securities, derivatives or OTC products entails significant risks which must be understood prior to trading and may not be appropriate for all investors. Past performance of actual trades or strategies is not necessarily indicative of future results.
|
|
Daily Levels for Oct. 21st, 2025
|
|
Want to feature our updated trading levels on your website? Simply paste a small code, and they’ll update automatically every day!
|
|
Economic Reports
U.S. government data may be impacted by the shutdown. ‘Tentative’ events are subject to delay, revision, or cancellation
provided by: ForexFactory.com
All times are Central Time ( Chicago)
|
|
|
Trading Futures, Options on Futures, and retail off-exchange foreign currency transactions involves substantial risk of loss and is not suitable for all investors. You should carefully consider whether trading is suitable for you in light of your circumstances, knowledge, and financial resources. You may lose all or more of your initial investment. Opinions, market data, and recommendations are subject to change at any time.
|
|
|
|
|
|
|


