Charts & Indicators Archives - Page 3 of 17 - Support & Resistance Levels

Charts & Indicators

Category Archives: Charts & Indicators


OPEC Meeting + Futures Trading Levels for April 3rd

April 2nd, 2024 Filed under Charts & Indicators, Commodity Brokers, Commodity Trading, Day Trading, Future Trading News, Futures Broker, Futures Exchange, Futures Trading, Gold Futures | Comment (0)

Get Real Time updates and more by joining our Private Facebook Group!
Subscribe to our YouTube Channel


OPEC Meeting tomorrow

  • OPEC+ JMMC meets on Wednesday at 1100 GMT
  • Producers earlier agreed to extend output cuts
  • Oil rallies to $89 a barrel, highest this year

LONDON, April 2 (Reuters) – An OPEC+ ministerial panel is unlikely to recommend any oil output policy changes at a meeting on Wednesday, five OPEC+ sources told Reuters, as oil prices hit their highest this year.

The Organization of the Petroleum Exporting Countries and allies led by Russia, known as OPEC+, will hold an online joint ministerial monitoring committee meeting (JMMC) on April 3 to review the market and members’ implementation of output cuts they have already agreed to extend.

Gold hit all time highs!

Gold chart for your review below.


Plan your trade and trade your plan


Daily Levels for April 3rd, 2024

Economic Reports
provided by: ForexFactory.com
All times are Eastern Time ( New York)

Improve Your Trading Skills

Get access to proprietary indicators and trading methods, consult with an experienced broker at 1-800-454-9572.

Explore trading methods. Register Here

* This is not a solicitation of any order to buy or sell, but a current market view provided by Cannon Trading Inc. Any statement of facts here in contained are derived from sources believed to be reliable, but are not guaranteed as to accuracy, nor they purport to be complete. No responsibility is assumed with respect to any such statement or with respect to any expression of opinion herein contained. Readers are urged to exercise their own judgement in trading.


Markets are closed tomorrow! Futures Trading Levels for April 1st

March 28th, 2024 Filed under Charts & Indicators, Commodity Brokers, Day Trading, Future Trading News, Futures Broker, Futures Trading, Trading Guide | Comment (0)

Get Real Time updates and more by joining our Private Facebook Group!
Subscribe to our YouTube Channel


Markets are Closed Tomorrow!


Plan your trade and trade your plan


Daily Levels for March 28th, 2024

Economic Reports
provided by: ForexFactory.com
All times are Eastern Time ( New York)

Improve Your Trading Skills

Get access to proprietary indicators and trading methods, consult with an experienced broker at 1-800-454-9572.

Explore trading methods. Register Here

* This is not a solicitation of any order to buy or sell, but a current market view provided by Cannon Trading Inc. Any statement of facts here in contained are derived from sources believed to be reliable, but are not guaranteed as to accuracy, nor they purport to be complete. No responsibility is assumed with respect to any such statement or with respect to any expression of opinion herein contained. Readers are urged to exercise their own judgement in trading.


Weekly Hueber Report: Now is it time to worry? Trading Levels for March 27th

March 26th, 2024 Filed under Charts & Indicators, Commodity Brokers, Commodity Trading, Day Trading, Economic Trading, Future Trading News, Futures Broker, Futures Trading, Trading Guide | Comment (0)

Get Real Time updates and more by joining our Private Facebook Group!
Subscribe to our YouTube Channel


The Following is analysis from Dan Hueber. You can find his analysis on Our QT Market Trading platform


Weekly Hueber Report: Now is it time to worry?


According to the Federal l Reserve Bank of New York, household debt in the United States grew by $212 billion to reach $17.5 trillion in the fourth quarter of last year. The lion’s share of this debt is wrapped up in mortgages and home equity lines of credit, which grew $112 billion during the quarter and reached $12.25 trillion. Auto loans rose $12 billion to $1.61 trillion, and student loans were flat at around $1.6 trillion, but the most significant percentage growth came via credit cards, which jumped $50 billion to $1.13 trillion.


Do keep in mind that as the overall population continues to grow, it is only natural for debt to expand along with it. Still, when you add in the fact that savings went backward during that same period, it would appear that the American consumer is increasingly relying on debt to meet day-to-day needs and wants. I should point out that savings balances have not slipped to as low as they were during the second quarter of 2022 and remain relatively consistent with the period between 2010 and 2018. However, both the amount being tucked away and the personal savings rate have been trending lower again.

There is one more telling chart that we need to throw into the mix—the delinquency rate on credit cards. While nowhere near the nearly 7% level witnessed during the Great Recession or even the averages seen throughout much of the 1990s, it has been climbing steadily for the past two years and has risen to the highest level since the second quarter of 2011.

Granted, not all of this news has been bleak, at least not if you are in the banking sector. Last year, they reported an estimated $92 billion in earnings, and this after taking into account funding costs and loan losses. This is more than double what they were earning from credit cards a decade ago. As the old proverb says, one man’s poison is another man’s pleasure. While there are a number of other elements that factor into this, it should come as no surprise that recent surveys find that 41% of Americans believe they are worse off than four years ago. In case you were wondering, 24% say they are better off, and 34% said they were about the same. That still leaves the majority of people thinking that at least they have been holding their own, but these debt trends would appear to suggest that number may shrink in the months ahead.

**The views expressed above are entirely those of the author.

DH


Plan your trade and trade your plan


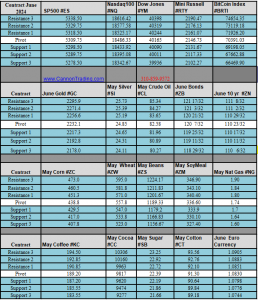
Daily Levels for March 27th, 2024
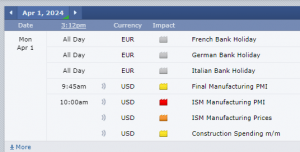
Economic Reports
provided by: ForexFactory.com
All times are Eastern Time ( New York)

Improve Your Trading Skills

Get access to proprietary indicators and trading methods, consult with an experienced broker at 1-800-454-9572.

Explore trading methods. Register Here

* This is not a solicitation of any order to buy or sell, but a current market view provided by Cannon Trading Inc. Any statement of facts here in contained are derived from sources believed to be reliable, but are not guaranteed as to accuracy, nor they purport to be complete. No responsibility is assumed with respect to any such statement or with respect to any expression of opinion herein contained. Readers are urged to exercise their own judgement in trading.


Weekly Newsletter: Understanding Margins, May Bean Meal Outlook and Automated NQ System

March 22nd, 2024 Filed under Charts & Indicators, Commodity Brokers, Commodity Trading, Day Trading, E-Mini Futures, Future Trading News, Future Trading Platform, Futures Broker, Futures Trading, Weekly Newsletter | Comment (0)

Get Real Time updates and more by joining our Private Facebook Group!
Subscribe to our YouTube Channel

Cannon Futures Weekly Letter Issue # 1186

In this issue:
  •  Important Notices – Good Friday Trading Schedule
  • Trading Resource of the Week – Understanding Margins
  • Hot Market of the Week – May Bean Meal
  • Broker’s Trading System of the Week – NQ Intraday System
  • Trading Levels for Next Week
  • Trading Reports for Next Week


Important Notices –

  • 4 Day Trading week, All Mkts closed Good Friday (MKTS closed from Thursday afternoon until Sunday Afternoon)
  • 6 Data releases: New home sales, Durable Goods, Consumer Confidence, GDP (Q4 final), Jobless Claims, Chicago PMI
  • Grain traders! Big Prospective plantings report Thursday Morning.
  • Night Traders, WATCHOUT for volatility Wednesday and Sunday. Fed Speaker Waller: Econ. Outlook 6PM EDT. Jerome Powell Friday Morning 11:30 EDT @SF Monetary Policy Conference.


Trading Resource of the Week : Understanding Margins by CMEgroup.com

Understanding Margin

Securities margin is the money you borrow as a partial down payment, up to 50% of the purchase price, to buy and own a stock, bond, or ETF. This practice is often referred to as buying on margin.
Futures margin is the amount of money that you must deposit and keep on hand with your broker when you open a futures position. It is not a down payment and you do not own the underlying commodity.
Futures margin generally represents a smaller percentage of the notional value of the contract, typically 3-12% per futures contract as opposed to up to 50% of the face value of securities purchased on margin.

Margins Move with the Markets

When markets are changing rapidly and daily price moves become more volatile, market conditions and the clearinghouses’ margin methodology may result in higher margin requirements to account for increased risk.
When market conditions and the margin methodology warrant, margin requirements may be reduced.

Types of Futures Margin

Initial margin is the amount of funds required by CME Clearing to initiate a futures position. While CME Clearing sets the margin amount, your broker may be required to collect additional funds for deposit.
Maintenance margin is the minimum amount that must be maintained at any given time in your account.
If the funds in your account drop below the maintenance margin level, a few things can happen:
  • You may receive a margin call where you will be required to add more funds immediately to bring the account back up to the initial margin level.
  • If you do not or can not meet the margin call, you may be able to reduce your position in accordance with the amount of funds remaining in your account.
  • Your position may be liquidated automatically once it drops below the maintenance margin level.

Summary

Futures margin is the amount of money that you must deposit and keep on hand with your broker when you open a futures position. It is not a down payment, and you do not own the underlying commodity.
The term margin is used across multiple financial markets. However, there is difference between securities margins and futures margins. Understanding these differences is essential, prior to trading futures contracts.


  • Hot Market of the Week – May Bean Meal
Hot market of the week is provided by QT Market Center, A Swiss army knife charting package that’s not just for Hedgers, Cooperatives and Farmers alike but also for Spread traders, Swing traders and shorter time frame application for intraday traders with a unique proprietary indicator that can be applied to your specific trading needs.
May Bean Meal
May meal satisfied its first upside PriceCount objective and is correcting lower. At this point, IF the chart can resume its rally with new sustained highs, the second count would project a possible run to the 356.5 area.
PriceCounts – Not about where we’ve been , but where we might be going next!
The PriceCount study is a tool that can help to project the distance of a move in price. The counts are not intended to be an ‘exact’ science but rather offer a target area for the four objectives which are based off the first leg of a move with each subsequent count having a smaller percentage of being achieved. It is normal for the chart to react by correcting or consolidating at an objective and then either resuming its move or reversing trend. Best utilized in conjunction with other technical tools, PriceCounts offer one more way to analyze charts and help to manage your positions and risk. Learn more at www.qtchartoftheday.com
Trading in futures, options, securities, derivatives or OTC products entails significant risks which must be understood prior to trading and may not be appropriate for all investors. Past performance of actual trades or strategies is not necessarily indicative of future results.
  • Broker’s Trading System of the Week

With algorithmic trading systems becoming more prevalent in portfolio diversification, the following system has been selected as the broker’s choice for this month.
PRODUCT
Mini NASDAQ 100
SYSTEM TYPE
Intraday
COST
USD 55 / monthly
Recommended Cannon Trading Starting Capital
$20,000
The performance shown above is hypothetical in that the chart represents returns in a model account. The model account rises or falls by the average single contract profit and loss achieved by clients trading actual money pursuant to the listed system’s trading signals on the appropriate dates (client fills), or if no actual client profit or loss available – by the hypothetical single contract profit and loss of trades generated by the system’s trading signals on that day in real time (real‐time) less slippage, or if no real time profit or loss available – by the hypothetical single contract profit and loss of trades generated by running the system logic backwards on back adjusted data. Please read full disclaimer HERE.
Would you like to receive daily support & resistance levels?
Yes
No


Daily Levels for March 25th 2024

Trading Reports for Next Week

First Notice (FN), Last trading (LT) Days for the Week:

Improve Your Trading Skills

Get access to proprietary indicators and trading methods, consult with an experienced broker at 1-800-454-9572.

Explore trading methods. Register Here

* This is not a solicitation of any order to buy or sell, but a current market view provided by Cannon Trading Inc. Any statement of facts here in contained are derived from sources believed to be reliable, but are not guaranteed as to accuracy, nor they purport to be complete. No responsibility is assumed with respect to any such statement or with respect to any expression of opinion herein contained. Readers are urged to exercise their own judgement in trading.


Weekly Newsletter: Understanding Price Banding, May Bean Oil Outlook and Automated Gold System

March 15th, 2024 Filed under Charts & Indicators, Commodity Brokers, Commodity Trading, Day Trading, Energy Futures, Future Trading News, Futures Broker, Futures Trading, Gold Futures, Grain Futures, Weekly Newsletter | Comment (0)

Get Real Time updates and more by joining our Private Facebook Group!
Subscribe to our YouTube Channel

Cannon Futures Weekly Letter Issue # 1186

In this issue:
  •  Important Notices – FOMC Next Week
  • Trading Resource of the Week – Understanding Price Limits and Banding
  • Hot Market of the Week – May Bean Oil
  • Broker’s Trading System of the Week – Gold Swing System
  • Trading Levels for Next Week
  • Trading Reports for Next Week


Important Notices –

  • FOMC Meeting next week. Announcement on Wednesday.
  • Light data most of the week. Housing sales
  • Very few earnings
  • June is front month for indices, currencies and financials.: M = June
  • USA is on daylight savings time – most international countries have NOT changed yet.


Trading Resource of the Week : What are Price Limits and Price Banding? by CMEgroup.com

As a trader, you want to know that there are mechanisms in place to ensure an orderly market. A regulated marketplace like CME Group provides this order by setting price limits and price banding.
Price Limits
Price limits are the maximum price range permitted for a futures contract in each trading session. These price limits are measured in ticks and vary from product to product. When markets hit the price limit, different actions occur depending on the product being traded. Some markets may temporarily halt until price limits can be expanded or trading may be stopped for the day based on regulatory rules. Different futures contracts will have different price limit rules; i.e. Equity Index futures have different rules than Agricultural futures.
Example
Equity Indexes futures have a three level expansion: 7%, 13% and 20% to the downside, and a 7% limit up and down in overnight trading.
When price reaches any of those levels the market will go limit up or limit down.
Calculating Price Limits
Price limits are re-calculated daily and remain in effect for all trading days except in certain physically-deliverable markets, where price limits are lifted prior to expiration so that futures prices are not prevented from converging on prices for the underlying commodity.
Typically, Agricultural futures will go limit up or down most often compared to Equity Index futures which very rarely if ever go limit up or down. When trading a specific product, it is important to be aware of price limits and the mechanisms that occur when limits are hit. Traders also know that it is possible for limits to be reached for more than one session in a row, however the expansion of limit thresholds over the last few years have reduced this occurrence.
Price Banding
Price banding is a similar mechanism which subjects all orders to price validation and rejects orders outside the given band to maintain orderly markets. Bands are calculated dynamically for each product based on the last price, plus or minus a fixed band value. Thus, if markets quickly move in one direction, the price bands dynamically adjust to accommodate new trading ranges.
Conclusion
The rules for each market can be found on cmegroup.com.
It is important to note that traders can place trades outside the daily price limits. These trades will be executed when price limits and price bands move within the specified range. So, traders still have the ability to place good-til-canceled or good-til-date orders inside and outside daily price limits.
In the last few years there are fewer and fewer times that markets will actually go limit up or down, but it is important to be aware of these pricing rules when you trade.


  • Hot Market of the Week – May Bean Oil
Hot market of the week is provided by QT Market Center, A Swiss army knife charting package that’s not just for Hedgers, Cooperatives and Farmers alike but also for Spread traders, Swing traders and shorter time frame application for intraday traders with a unique proprietary indicator that can be applied to your specific trading needs.
May Bean Oil
The rally in May soybean oil accelerated to its second upside PriceCount objective and now the chart is correcting. At this point, IF you can resume the rally with new sustained highs, the third count would project a possible run to the 50.87 area.
PriceCounts – Not about where we’ve been , but where we might be going next!
The PriceCount study is a tool that can help to project the distance of a move in price. The counts are not intended to be an ‘exact’ science but rather offer a target area for the four objectives which are based off the first leg of a move with each subsequent count having a smaller percentage of being achieved. It is normal for the chart to react by correcting or consolidating at an objective and then either resuming its move or reversing trend. Best utilized in conjunction with other technical tools, PriceCounts offer one more way to analyze charts and help to manage your positions and risk. Learn more at www.qtchartoftheday.com
Trading in futures, options, securities, derivatives or OTC products entails significant risks which must be understood prior to trading and may not be appropriate for all investors. Past performance of actual trades or strategies is not necessarily indicative of future results.
  • Broker’s Trading System of the Week

With algorithmic trading systems becoming more prevalent in portfolio diversification, the following system has been selected as the broker’s choice for this month.
Spartan Gold
PRODUCT
SYSTEM TYPE
Swing
COST
USD 75 / monthly
Recommended Cannon Trading Starting Capital
$20,000
The performance shown above is hypothetical in that the chart represents returns in a model account. The model account rises or falls by the average single contract profit and loss achieved by clients trading actual money pursuant to the listed system’s trading signals on the appropriate dates (client fills), or if no actual client profit or loss available – by the hypothetical single contract profit and loss of trades generated by the system’s trading signals on that day in real time (real‐time) less slippage, or if no real time profit or loss available – by the hypothetical single contract profit and loss of trades generated by running the system logic backwards on back adjusted data. Please read full disclaimer HERE.
Would you like to receive daily support & resistance levels?
Yes
No


Daily Levels for March 18th 2024

Trading Reports for Next Week

First Notice (FN), Last trading (LT) Days for the Week:

Improve Your Trading Skills

Get access to proprietary indicators and trading methods, consult with an experienced broker at 1-800-454-9572.

Explore trading methods. Register Here

* This is not a solicitation of any order to buy or sell, but a current market view provided by Cannon Trading Inc. Any statement of facts here in contained are derived from sources believed to be reliable, but are not guaranteed as to accuracy, nor they purport to be complete. No responsibility is assumed with respect to any such statement or with respect to any expression of opinion herein contained. Readers are urged to exercise their own judgement in trading.

Have A Questions? Open an account Free Demo Account Free Demo Account

Question?

Valid first name is required.
Valid last name is required.
Phone number is required.
E-mail is required.
Message is required.
Phone (USA)
Phone (International)
Our Approach

You and your broker will work together to achieve your trading goals. We develop long term relationships with our clients so that we can grow and improve together.
Learn More About Choosing Cannon

Our Platforms

Please click on one of our platforms below to learn more about them, start a free demo, or open an account.
E-Futures Sierra Charts Firetip (Mac Compatible) RTrader

Trading Tips You Can Use Right Away!


Watch 4 short videos on the topics of:
  • Using Bollinger Bands and Parabolics
  • Using range Bars for Day-Trading
  • The concept of Price Confirmation
  • How to Use Support & Resistance Levels
  • License 3 Broker at your Fingertips
________
Doing Business With
See more...
Loading
Loading

Loading