5 Key Price Limit Insights That Help Navigate May Bean Oil Volatility

7cfe5b36 db9f 4933 824a 7f264613e7fe

Cannon Futures Weekly Letter

In Today’s Issue #1237

  • About Price Limits

  • The Week Ahead – FOMC Minutes, tariffs News to Fuel Volatility
  • Futures 102 – Technical Analysis Course
  • Hot Market of the Week – May Bean Oil
  • Broker’s Trading System of the Week – Abacus Raider NQ Day Trading System
  • Trading Levels for Next Week
  • Trading Reports for Next Week

Price Limit

price limit

A price limit is the maximum price range permitted for a futures contract in each trading session. When markets hit the price limit, different actions occur depending on the product being traded.

Some markets may temporarily halt until price limits can be expanded or trading may be stopped for the day based on regulatory rules.

Different futures contracts will have different price limit rules; i.e. Equity Index futures have different rules than Agricultural futures.

Price limits are re-calculated daily and remain in effect for all trading days (except in certain physically-deliverable markets, where price limits are lifted prior to expiration so that futures prices are not prevented from converging on prices for the underlying commodity).

Equity Indexes futures have a three level expansion: 7%, 13% and 20% to the downside, and a 7% limit up and down in overnight trading.

Follow the links below to the CME Group web site to find more information on price limits generally and specific price limits for the markets you’re trading:

Find daily price limits for CME Group Agricultural, Cryptocurrency, Energy, Equity Index, Interest Rates, and Metals products: click here.

Price Limit

Important Notices: The Week Ahead

By Mark O’Brien, Senior Broker

Tariffs News & FOMC Minutes to Dominate Markets & Volatility

U.S. stocks and many commodities like metals, energies, softs and grains were battered by a sell-off Friday after China retaliated against the United States for President Donald Trump’s tariffs in a tit-for-tat that looks to be escalating a global trade war.

The E-mini Dow Jones futures contract plunged by over 2,150 points this afternoon, ±5.3%. The broader E-mini S&P 500 was 5.9% lower. The E-mini Nasdaq futures contract dropped over 1000 points for the second day / ±5.9% on track to close in a bear market — down more than 20% from its record high in December.

Traders have been looking at the dramatic escalation of a trade war and viewing it as a potential to plunge the U.S. and global economies into recession.

The feeling is that odds of a recession would rise if countries began to retaliate against the United States — and China did so Friday. Retaliation raises the risk of further escalation and could diminish hopes for negotiation.

FED SPEECHES:

  • Mon.    Bostic 12: Fed Governor Adriana Kugler speaks, 9:30 A.M., C.T.
  • Tues.  No scheduled Fed speakers
  • Wed.    Richmond Fed President Tom Barkin speaks, 10:00 A.M.,C.T.
  • Thu.     Kansas City Fed President Jeff Schmid speaks, 9:00 A.M., C.T.
  •         Fed Governor Michelle Bowman testifies to Senate, 9:00 A.M., C.T.
  • Fri.      New York Fed President Williams speaks, 100:00 A.M., C.T.

Economic Data week:

  • Mon. Consumer Credit, 2:00 P.M., C.T.
  • Tue. Quiet
  • Wed. Wholesale Inventories, Minutes of Fed.’s March FOMC meeting
  • Thur. Consumer Price Index, Initial Jobless Claims
  • Fri. Producer Price Index

Futures 102: Technical Analysis

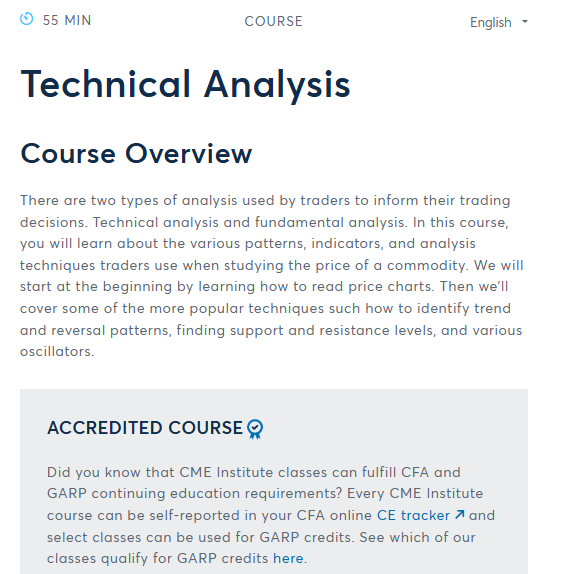
Course overview

There are two types of analysis used by traders to inform their trading decisions. Technical analysis and fundamental analysis. In this course, you will learn about the various patterns, indicators, and analysis techniques traders use when studying the price of a commodity.

We will start at the beginning by learning how to read price charts. Then we’ll cover some of the more popular techniques such how to identify trend and reversal patterns, finding support and resistance levels, and various oscillators.

Start FREE Course Now

3c2845af fbc7 4388 ad6a e3688a8cc925

Hot Market of the Week

Hot market of the week is provided by QT Market Center, A Swiss army knife charting package that’s not just for Hedgers, Cooperatives and Farmers alike but also for Spread traders, Swing traders and shorter time frame application for intraday traders with a unique proprietary indicator that can be applied to your specific trading needs.

Free Trial Available

bean oil

May Bean Oil

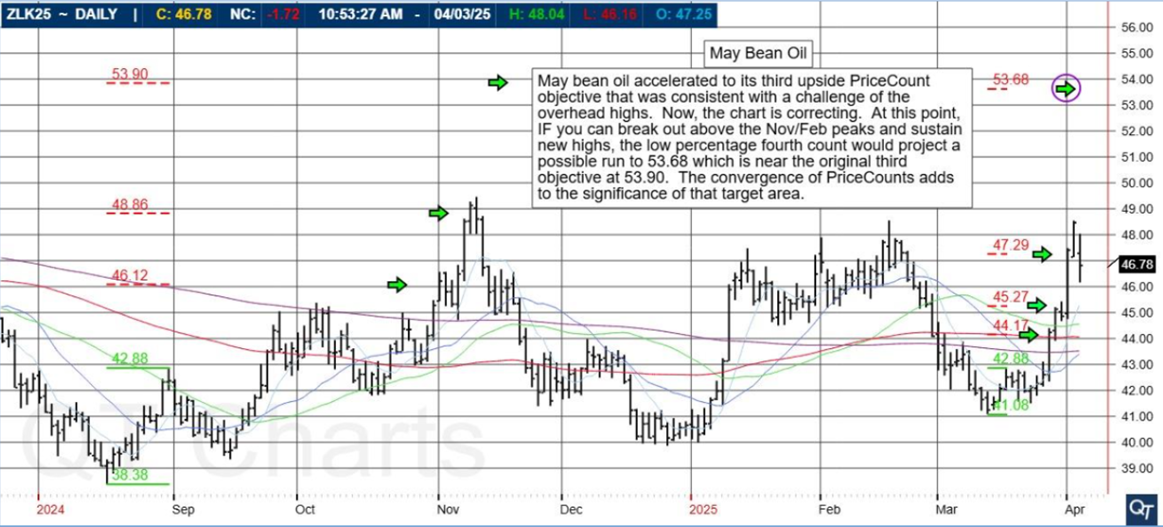
May bean oil accelerated to its third upside PriceCount objective that was consistent with a challenge of the overhead highs. Now, the chart is correcting.

At this point, IF you can break out above the Nov/Feb Peaks and sustain new highs, the low percentage fourth count would project a possible run to 53.68 which is near the original third objective at 53.90.

The convergence of PriceCounts adds to the significance of that target area.

59cf96e2 a30d 484c a83c 83aa6d9ee8ba

That’s May Bean Oil!

The PriceCount study is a tool that can help to project the distance of a move in price. The counts are not intended to be an ‘exact’ science but rather offer a target area for the four objectives which are based off the first leg of a move with each subsequent count having a smaller percentage of being achieved.

It is normal for the chart to react by correcting or consolidating at an objective and then either resuming its move or reversing trend. Best utilized in conjunction with other technical tools, PriceCounts offer one more way to analyze charts and help to manage your positions and risk. Learn more at www.qtchartoftheday.com

Trading in futures, options, securities, derivatives or OTC products entails significant risks which must be understood prior to trading and may not be appropriate for all investors. Past performance of actual trades or strategies is not necessarily indicative of future results.

Brokers Trading System of the Week

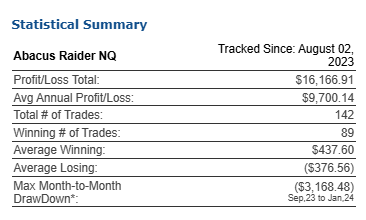
Abacus Raider NQ Trading System

Market Sector: Stock Index Futures

Markets Traded:   NQ

System Type: Day Trading

Risk per Trade: varies

Trading Rules: Partially Disclosed

Suggested Capital: $10,000

Developer Fee per contract: $70.00 Monthly Subscription

System Description: 

An NQ day trading system currently traded by the developer who has 15+ years’ experience. The system identifies opportunities where there is a high probability of profit over a time frame lasting no longer than a few minutes. Short holding periods reduce risk and drawdown size and require less capital.

The system trades long and short, performs in low or high volatility markets and has no significant correlation to the S&P500 index. It is robust with simple logic and averages 4-5 trades a month with no overnight positions. System is not available in the MNQ market.
Get Started

Learn More

efbcc397 7787 4023 884d 2c19783fb925

Disclaimer The risk of trading can be substantial and each investor and/or trader must consider whether this is a suitable investment. Past performance is not necessarily indicative of future results.

Futures Trading Disclaimer:

Transactions in securities futures, commodity and index futures and options on futures carry a high degree of risk. The amount of initial margin is small relative to the value of the futures contract, meaning that transactions are heavily “leveraged”.

A relatively small market movement will have a proportionately larger impact on the funds you have deposited or will have to deposit: this may work against you as well as for you. You may sustain a total loss of initial margin funds and any additional funds deposited with the clearing firm to maintain your position.

If the market moves against your position or margin levels are increased, you may be called upon to pay substantial additional funds on short notice to maintain your position.

If you fail to comply with a request for additional funds within the time prescribed, your position may be liquidated at a loss and you will be liable for any resulting deficit.

 Please read full disclaimer HERE.

Would you like to get weekly updates on real-time, results of systems mentioned above?
Yes
No

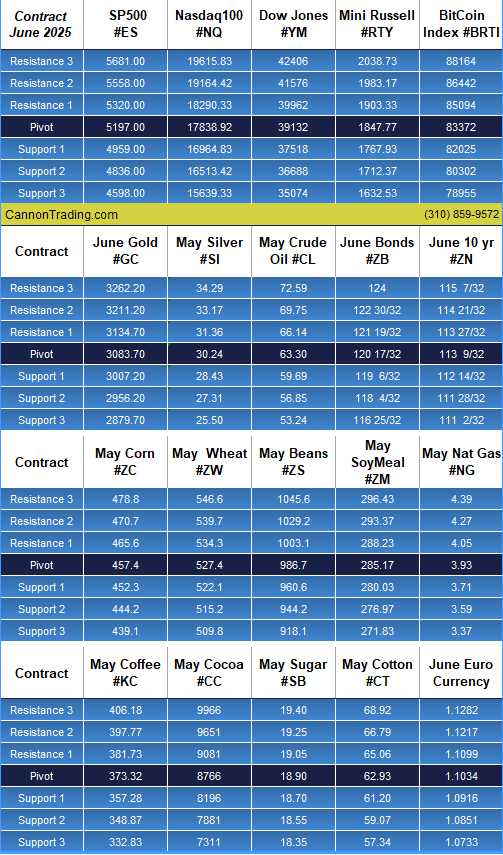
Trading Levels for Next Week

Daily Levels for April 7th, 2025

07661c52 0b05 47f3 8db3 a10e02c2003a

Would you like to receive daily support & resistance levels?
Yes
No

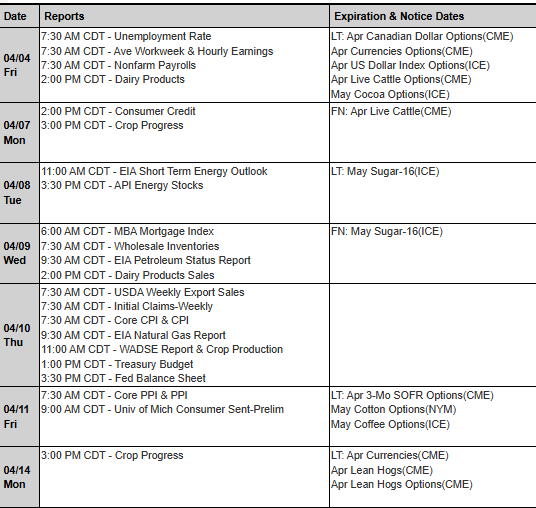
Trading Reports for Next Week

First Notice (FN), Last trading (LT) Days for the Week:

www.mrci.com

669230d5 0860 4679 9d40 097d654b4839

Find us on Trustpilot

stars

Trading Futures, Options on Futures, and retail off-exchange foreign currency transactions involves substantial risk of loss and is not suitable for all investors.

You should carefully consider whether trading is suitable for you in light of your circumstances, knowledge, and financial resources.

You may lose all or more of your initial investment. Opinions, market data, and recommendations are subject to change at any time.

Call Now

Join our Private Facebook group

Subscribe to our YouTube Channel

Listen to our podcast: Subscribe on AppleSpotify, Amazon

or wherever you listen to podcasts!

S
Facebook  Instagram  LinkedIn
S
ef3ab1c9 8d6d 4e60 a3f1 af5d9d4ecbb3
Services
Software
Tools
Community
Contact