Why is the VIX so high when the markets are making new highs.
4 November 2024
By GalTrades.com
Why is the VIX so high when the markets are making new all-time high?
When the S&P made all-time high in the last 35 years the average level of the VIX was around 15, now we’re at 19-20. The week ended with a VIX @ 21.88
Earnings overall were ok, Mag 5 earnings this past week were good but profit taking led some of them to the downside. The AI narrative is continuing, The Mag 6 announced further spending in AI going into 2025, the winner should be NVDA. In 2025 the hyperscalers will need to show us results; are they growing earnings from spending on AI, investors will want to see higher ROI.
Friday the markets closed up on the day but down for the week. Yields closed on their highs. I don’t see yields closing on an all-time high for the past few months as a positive sign for the stock market in the short term.
This week we had one of the largest one-day drops for the SPX in nearly two months, driven by; a negative reaction to increased AI-related CapEx forecasts from mega-cap tech giants though the earnings reports were strong, rising bond yields, and possibly a reduction in exposure to risk ahead of the upcoming elections. British 10-year Gilts hit a 52-week high this week after the U.K. Finance Minister Rachel Reeves first budget included higher spending, inflation expectations and therefore slower rate cut expectations from the Bank of England (BOE).
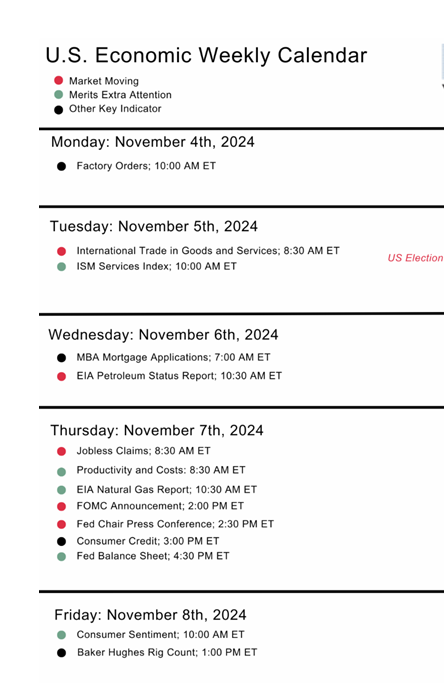
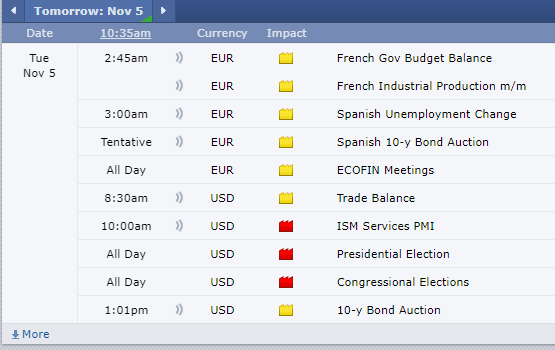
Aside from Election Day on Tuesday, we’ve got a Federal Open Market Committee (FOMC) meeting on Wednesday-Thursday. Higher volatility is expected. Bloomberg probabilities are currently suggesting a 98% chance that the Federal Reserve cuts 25 basis points next Thursday, the forward guidance/tone will likely be the focus for markets. The economic data has been relatively strong and Fed officials have since communicated that easing in monetary policy may be more gradual as a result. If the Fed doesn’t provide a hawkish tone next Thursday, then the bulls may win this battle for now, the bond traders may get the last laugh because of the debt continuously growing.
The rise in bond yields is likely a reflection of the fact the Fed will cut interest rates fewer times than investors had thought, a result of inflation being above its target and a job market that has grown faster than expected. more cuts will cause inflation to reaccelerate, and that’s why the 10-year Treasury yield surged Friday after the initial dip.
When does the bond market impinge on the stock market? 60 basis points were about there.
Mid-Caps are trading at a P/E of 15 vs small cap Russell at 30, and 4 out of 10 companies are unprofitable. If we go back since 1985 mid cap has outperformed small caps.
Economic Reports:
September’s Job Openings and Labor Turnover Survey(JOLTS) showed openings of 7.443 million, the lowest in more than three years and well below the 8 million analysts had expected. The levels are not that weak to suggest a real breakdown in the job market. The overall trends in openings and quits point to a job market that is returning to normal rather than one that is deteriorating quickly.
jobs report was a big miss, the data is likely impacted by the hurricanes/Boeing union strike and will likely be subject to future revisions.
- Monday (11/4): Factory Orders
- Tuesday (11/5): ISM Services PMI, Trade Balance
- Wednesday (11/6): EIA Crude Oil Inventories, MBA Mortgage Applications Index
- Thursday (11/7): Consumer Credit, Continuing Claims, EIA Natural Gas Inventories, FOMC Rate Decision, Initial Claims, Productivity-Preliminary, Unit Labor Costs-Preliminary, Wholesale Inventories
- Friday (11/8): University of Michigan Consumer Sentiment-Preliminary
Futures:
Crude oil fell below $67 per barrel at one point for WTI Crude Oil futures (/CL) as Middle East tension eased. A price to watch is the September 10 closing low of $66.31, as no front-month crude contract has closed below that level since late 2021, just before the war in Ukraine began.
Gold: The 5% increase in net demand in the third quarter of this year included 1,313 tons of the precious metal according to the World Gold Council (WGC). The precious metal has rallied 33% YTD, 13% of which happened last quarter.
Surging investor demand has been resilient central bank buying in the face of higher prices, the Federal Reserve starting a rate-cut cycle along with other central banks and buying in the over-the-counter market. Only three central banks reported lowering their gold reserves by more than a ton.
Looking at the continuous gold futures (/GC) we can see an unrelenting uptrend over the last year, although the trend has rarely seen interruptions since the 2022 low. Although the RSI is sitting at oversold levels, the metal has proven it can sustain oversold levels for long periods this year. It has closed above its 9-day moving average for the last 14 sessions. Sitting at all-time highs means there are no resistance levels to search for.
Gold is creating a large gap from its middle- and far-term moving averages that might off some support on a retracement or the previous high at 2700. It is currently trading nearly 6% and 15% above its middle- and far-term moving averages.
China: Reutersreported that China is considering the issuance of $1.4 trillion in extra debt to bolster the economy.
Technical Analysis:
By Wednesday, Technically speaking, the broader market appeared range bound, caught between technical support at the 20-day moving average for the SPX just above 5,800 and recent highs near 5,870. The last few trading sessions saw narrow moves. Investors could be waiting for this week’s data and mega-cap earnings, followed by next week’s election and Fed meeting, to take major new positions. Towards the end of the week SPX broke 20-day SMA; the 50-day SMA is now considered near-term support and the 20-day SMA is now considered near-term resistance (i.e. prior support becomes resistance, once broken).
Russell broke the short-term upward trend line but holding support at the 50-day SMA.
Holiday shopping: the season is upon us, and retail stocks may be in focus, shoppers will be looking for value; WMT, COST, AMZN, BBY, TJX.
Earnings:
- Monday (11/4): Constellation Energy Corp. (CEG), Zoetis Inc. (ZTS), Marriott International Inc. (MAR), Fidelity National Information Services (FIS), BioNTech SE (BNTX), Yum China Holdings Inc. (YUMC), Vertex Pharmaceuticals Inc. (VRTX), Palantir Technologies Inc. (PLTR), NXP Semiconductors NV (NXPI), Realty Income Corp. (O)
- Tuesday (11/5): Apollo Global Management Inc. (APO), Thomson Reuters Corp. (TRI), Marathon Petroleum Corp. (MPC), Cummins Inc. (CMI), Coupang Inc. (CPNG), Microchip Technology Inc. (MCHP), Devon Energy Corp. (DVN)
- Wednesday (11/6): CVS Health Corp. (CVS), Sempra (SRE), American Electric Power Company (AEP), Johnson Controls International PLC (JCI), Iron Mountain Inc. (IRM), Qualcomm Inc. (QCOM), ARM Holdings PLC (ARM), Gilead Sciences Inc. (GILD), McKesson Corp. (MCK)
- Thursday (11/7): Duke Energy Corp. (DUK), TransDigm Group Inc. (TDG), Air Products and Chemicals Inc. (APD), Becton Dickenson and Co. (BDX), Datadog Inc. (DDOG), Arista Networks Inc. (ANET), Airbnb Inc. (ABNB), Motorola Solutions Inc. (MSI), EOG Resources Inc. (EOG), Fortinet Inc. (FTNT), Trade Desk Inc. (TTD)
- Friday (11/8): Baxter International Inc. (BAX), NRG Energy Inc. (NRG), RB Global Inc. (RBA), CNH Industries NV (CNH)
Trading stocks, commodity futures and options involves a substantial risk of loss. The information here is of opinion only and do not guarantee any profits. Past performances are not necessarily indicative of future results.
|


