What Exactly Are Futures Spreads

Corn is one of nature’s greatest creations. You can make all sorts of delicious foods from the vegetable. It feeds many different types of animals. It is the base to many different popular types of liquor. Corn also can be an alternative fuel source. Not only are the corn’s uses wondrous it is also a very durable plant. It can take almost any type of weather patterns and still grow. Corn is also popular amongst investors, most notably commodity traders. Although a very good sturdy plant, investing in corn is a risky investment. Actually commodity investing is a risky strategy, but rewarding if you can invest the right way.

To invest in a commodity you have to minimize your risk. Commodities traders will use a strategy known as a futures spread. Future spreads lower the amount of risk because the trader is hedging two commodities contracts, the result is the spread between the prices of the two contracts.

The several types of futures spreads traders can take advantage of.

Calendar Spreads

Calendar spreads are also known as Intramarket spreads. The practice lets the trader take on a short contract and a long contract, both based on specific months of the year. An example would be that the trader buys a contract for soybeans in May, and sells another contract for soybeans in November. To get your results you would simply subtract the November price of soybeans from the May price, and then you get your spread.

Intermarket Spreads

Intermarket spreading is the practice of buying a short contract of one commodity and buying the long contract of a different commodity. An example of an intermarket spread; you purchase a short contract of corn and at the same time purchase a long contract of wheat. The difference in the prices of the two will give you the spread.
Continue reading “What Exactly Are Futures Spreads”

Memorial Day Holiday Schedule 2014 for CME / Globex and ICE Exchanges

Memorial Day Holiday Schedule 2014 for CME / Globex and ICE Exchanges


CME / CBOT / Globex® Memorial Day Holiday Schedule

Equity Products

Friday, May 23

1615 CT / 1715 ET / 2115 UTC – Regular close

Sunday, May 25

1700 CT / 1800 ET / 2200 UTC – Regular open for trade date Tuesday, May 27*

Monday, May 26

1200 CT / 1300 ET / 1700 UTC – Trading halt (pre-open)

1700 CT / 1800 ET / 2200 UTC – Products resume trading

Tuesday, May 27

1615 CT / 1715 ET / 2115 UTC – Regular close

Interest Rate & FX Products

Friday, May 23

1515 CT / 1615 ET / 2015 UTC – Early close

Sunday, May 25

1700 CT / 1800 ET / 2200 UTC – Regular open for trade date Tuesday, May 27*

Monday, May 26

1200 CT / 1300 ET / 1700 UTC – Trading halt (pre- open)

1700 CT / 1800 ET / 2200 UTC – Products resume trading

Tuesday, May 27

1600 CT / 1700 ET / 2100 UTC– Regular close

Energy, Metals & DME Products

Friday, May 23

1615 CT / 1715 ET / 2115 UTC – Regular close

Sunday, May 25

1700 CT / 1800 ET / 2200 UTC – Regular open for trade date Tuesday, May 27*

Monday, May 26

1200 CT / 1300 ET / 1700 UTC – Trading halt (pre-open)

1700 CT / 1800 ET / 2200 UTC – Products resume trading

Tuesday, May 27

1615 CT / 1715 ET/ 2115 UTC – Regular close

*Dates and times are subject to change

*Note: Session orders entered on Sunday are for trade date Tuesday, May 27

and will continue working until Tuesday’s close unless otherwise noted.

Globex® Memorial Day Holiday Schedule

Grain, Oilseed & MGEX Products

Friday, May 23

Regular close – Per each product schedule

Sunday, May 25

1600 CT / 1700 ET / 2100 UTC – Pre-open for trade date Tuesday, May 27*

Monday, May 26

1900 CT / 2000 ET / 0000 – Open for trade date Tuesday, May 27

Tuesday, May 27

0700 CT / 0800 ET / 1200 UTC – MGEX Apple Juice – Regular open

Regular close – Per each product schedule

Livestock, Dairy & Lumber Products

Friday, May 23

Regular close – Per each product schedule for:

• Livestock

• Dairy

• Lumber

Monday, May 26

1700 CT / 1800 ET / 2200 UTC – Dairy markets open for trade date Tuesday, May 27*

Tuesday, May 27

900 CT / 1000 ET / 1400 UTC – Lumber market open

905 CT / 1005 ET / 1405 UTC – Livestock markets open

Regular close – Per each product schedule

More details at:  http://www.cmegroup.com/tools-information/holiday-calendar/files/2014-memorial-day-holiday-schedule.pdf

ICE Futures U.S.(sm) Memorial Day, May 26, 2014:

AGRICULTURAL PRODUCTS*

DATE OPEN OUTCRY / ELECTRONIC

Fri May 23 Regular Hours / Regular Hours

Mon May 26 Closed / Closed

*Including RJ/CRB and CCI contracts.

FINANCIAL PRODUCTS

(Currencies Pairs — U.S. Dollar Index)

DATE OPEN OUTCRY /  ELECTRONIC

Fri, May 23 Early close at 1:00 p.m. ET  / Early close at 4:15 p.m. ET

Mon, May 26 Closed / Early close at 1:00 p.m. ET

STOCK INDEX PRODUCTS

(NYSE Composite Index— Russell Indexes)

DATE OPEN OUTCRY / ELECTRONIC

Fri May 23 Regular Hours / Early Close at 4:15 p.m. ET

Mon May 26 Closed / Early close at 11:30 a.m. ET

**For those futures and options contracts which continue to trade on the floor.

More details at: https://www.theice.com/publicdocs/futures_us/exchange_notices/MemorialDay%20_2_.pdf

The above sources were compiled from sources believed to be reliable.  Cannon Trading assumes no responsibility for any errors or omissions.  It is meant as an alert to events that may affect trading strategies and is not necessarily complete.  The closing times for certain contracts may have been rescheduled.

Good Friday Futures Trading Holiday Hours and Economic Reports 4.17.2014

Connect with Us! Use Our Futures Trading Levels and Economic Reports RSS Feed.

Like us on FacebookFollow us on TwitterView our profile on LinkedInFind us on Google+Cannon Trading Futures Trading Resistance & Support Levels and Economic ReportsFind us on Yelp

1. Market Commentary
2. Futures Support and Resistance Levels – S&P, Nasdaq, Dow Jones, Russell 2000, Dollar Index
3. Commodities Support and Resistance Levels – Gold, Euro, Crude Oil, T-Bonds
4. Commodities Support and Resistance Levels – Corn, Wheat, Beans, Silver
5. Futures Economic Reports for Thursday April 17, 2014

Hello Traders,

For 2014 I would like to wish all of you discipline and patience in your trading!

Good Friday Day Holiday Schedule for CME / Globex and ICE Exchanges

All times listed as Central Time

Thursday, April 17

  • CME & CBOT Equity Products

1615 CT / 1715 ET / 2115 UTC – Regular close

  • ICE Equity Products

1615 CT / 1715 ET / 2115 UTC – Regular close

  • CME & CBOT Interest Rate & FX Products

1600 CT 1700 ET / 2100 UTC – Regular close

  • CBOTKCBT Grain & Agricultural Products

Regular close – per each product schedule

Note: Grain pre-opening between 2:30 P.M. – 4:00 P.M.

  • Other CME Group Products

1355 CT / 1455 ET / 1855 UTC – Early Close

  • ICE SoftsCash-Settled Grains

Regular close – Per each product schedule

Friday, April 18

  • CME & CBOT Equity Products

CME Globex is closed

  • CME & CBOT Interest Rate & FX Products

CME Globex is closed

  • CBOT, KCBT Grain & Agricultural Products

CME Globex is closed

  • Other CME Group Products

CME Globex is closed

Sunday, April 20

  • CME & CBOT Equity Products

1700 CT / 1800 ET / 2200 UTC – Regular open for trade date Monday, Apr 21

  • CME & CBOT Interest Rate & FX Products

1700 CT/ 1800 ET / 2200 UTC – Regular open for trade date Monday, Apr 21

  • CBOTKCBT Grain & Agricultural Products

1900 CT / 2000 ET / 2300 UTC – Regular open for trade date Monday, Apr 21

  • Other CME Group Products

Regular Open per each product schedule for:

Livestock, Weather, Real Estate, Lumber, Dairy Continue reading “Good Friday Futures Trading Holiday Hours and Economic Reports 4.17.2014”

How Crude Oil Prices Affect Gas Prices

There are a few different aspects that factor into how crude oil prices affect what consumers pay at the pump. Oil is directly affected by geopolitical events, weather patterns, distribution costs, supply, demand and State and Federal taxes, to name a few. As the aforementioned forces are unpredictable and as they become more volatile, so becomes crude oil. Understanding each factor and the role it plays with respects to the rise and fall in prices, may help someone understand how to utilize the information to make better trading decisions.

Supply

First and foremost supply is affected by various socioeconomic and political factors within and around the region of origin. Also, OPEC, an organization commenced in 12 of the top oil producing companies and producing just fewer than 50% of the world’s oil supply, regulate their portion of crude oil produced. Often OPEC will be in positions to sell or barter away the oil they produce in exchange for currency or other assets that will benefit their interests. The United States itself houses around 700 million barrels in its Strategic Petroleum Reserves for use in the event of political dissensions with oil producing nations, as well as for emergencies such as natural disaster affected regions of the country.

Demand

The driving forces behind the demand for crude oil can be a number of factors. The most obvious, of course, is the rate and amount of oil each country uses. According to the CIA World Fact book, the United States tops of the market at 21%, the EU uses 15% of the world’s oil and China consumes 11%. As countries develop, particularly within their middle class infrastructure, this creates more consumers and more consumers using vehicles, driving the demand higher. On the back end of developments like this, oil refineries must adjust production to suit the growing need, which also incurs a higher cost in that production.

Continue reading “How Crude Oil Prices Affect Gas Prices”

How Does Crude Oil Affect Gas Prices? What Else Does?

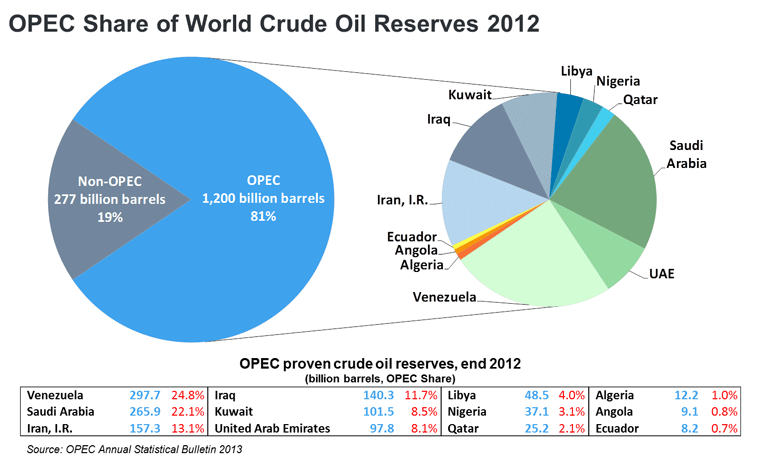
The answer to the question in the title of this piece was stated pretty assuredly in a 2005 publication by the Federal Trade Commission. The most important factor in the price of gasoline, the 166-page report concluded, was “the world price of crude oil“. It went on: “Over the last 20 years, changes in crude oil prices have explained 85% of the changes in the price for gasoline in the U.S.”1 And there aren’t too many macro-unknowns out there to affect the price of crude oil. The world produces roughly 85 million barrels of oil every day and every day the world’s population consumes about 90 million barrels. And the generally accepted relationship between crude oil and gasoline is that for every $1 dollar per barrel crude oil moves, gas prices move about 2 ½ cents at the pump. It’s also generally accepted that there’s approximately 1.5 trillion barrels of oil yet to be extracted from the planet – what are called proven reserves – equal to about 50 more years of supply based on our current consumption rate. And according to OPEC’s web site, that cartel – created over 50 years ago – controls about 80% of those reserves.

OPEC Share of World Crude Oil Reserves 2012

Account for some margin of error and those are all pretty workable numbers for a global commodity like crude oil to live with. The quandary for tracking gas prices isn’t that you can’t measure them accurately against the price of crude oil. That relationship is pretty ingrained. It’s the many other factors that also come into play – at different levels of influence and intensity and at irregular intervals – that cause gasoline prices to move.

Just take a look at the last 6 months. Crude oil shot up over 20% from $86 per barrel to almost $110 per barrel. It then fell over 10% back down to near $96 per barrel.

Continue reading “How Does Crude Oil Affect Gas Prices? What Else Does?”

Futures Trading Levels and Reports for August 30, 2012

Jump to a section in this post:

1. Market Commentary
2. Support and Resistance Levels – S&P, Nasdaq, Dow Jones, Russell 2000, Dollar Index
3. Support and Resistance Levels – Gold, Euro, Crude Oil, T-Bonds
4. Support and Resistance Levels – Corn, Wheat, Beans, Silver
5. Economic Reports for Thursday August 30, 2012


Hello Traders,

One Way to Eliminate Fear and Greed While Day Trading

Disclaimer

The methods described in this article are for educational purposes only. Past results are not necessarily indicative of future results. The author and the publisher assume no responsibility for your trading results. Trading involves a high degree of risk. No recommendation is being made to buy any stock, commodity, option or other financial instrument. Consult your financial advisor before starting any investment system.


It is a known fact that fear and greed can be a trader’s worst enemies.

I’ve found one way that has helped some clients deal with fear and greed and their cousin, “getting out of winners too soon and staying in losers too long.”

What is it? Entering Multiple Contracts: Philosophy

In order to enter multiple contracts while day trading, one has to have the appropriate risk capital and margin requirements. But the advantage of trading more than one “unit” or splitting your trading size into two or more parts is as such:

If you enter a trade with one contract (or if you are treating your trading size as one unit, meaning you enter a trade with 4 contracts and exit the trade with 4 contracts), you can face a very quick dilemma, especially when day-trading. Consider the two following scenarios:

  1. You get in and very quickly you are up 2 mini SP points…what do you do? Do you take profit? Bring your stop loss closer? How do you avoid getting out too early or too late?
  2. You enter a trade and it goes against you rather quickly…if you get out then it is a loser…but the little voice in your head says “what if the market goes back up?”

In the first case scenario, when market decided to be nice to us and moved in our direction, I like to exit half of my positions relatively quickly. In the case of the mini SP, this would be around 7 ticks profit.

What I’ve found is that this will allow me to manage the rest of the trade in a much more relaxed manner. Since I’ve already locked profits in, now I can look for a proper stop close to my break-even level. I can analyze my next target more realistically and, if the market provides room for additional gains, be there to participate.

Continue reading “Futures Trading Levels and Reports for August 30, 2012”

Futures Trading Levels, Types of Trading Days

Cannon Trading / E-Futures.com

The following is taken from a guide I have written that helps subscribers to my daily chart service. You can have a 2 week free trial to the daily live charts service along with buy/sell triggers and get the full guide along with chart examples, rules and much more by signing up at:

Cannon Trading Inc. Day Trading Webinar

General Notes:
At any given day, one must understand the trading environment that specific day has to offer and adjust their trading style accordingly. In our case it relates more to the size of stops and target based on volatility. Some days the market gives us many opportunities; some not as much; and some days it provides us with mostly risks…….take what the market gives you and not what you want it to give…..

I think if a trader understands early enough what type of trading day it is, he or she can choose which tools from the webinar are most suited for that days trading. If one can do that successfully (which is not easy), I think that is half the battle.

Not taking a trade is better than a bad trade.

My opinion is that there are 3 main types of trading days.

  1. Most common is two sided trading action with swings up and down – this type of trading day is most suitable for the main aspect of this model, which is taking trades based on the arrows.
  2. Strong trending day, mostly one directional – this type of trading day is the least common, many times this will happen on Mondays and maybe 3-5 times a month at most – this type of trading day is most suitable for using the color scheme I have on the charts. Green bars mean strong up trend, red bars mean strong down trend. If you determined that this is a trend day, then use pull backs to enter with the direction of trend and use the parabolic (little dashes) as you trailing stop.
  3. Slow and/ or choppy trading day – this type of trading day is best suited for taking small profits from the market by either using the main model or taking the diamonds as entry signal, and going for quick profits and tight stops.

Continue reading “Futures Trading Levels, Types of Trading Days”

Futures Trading Levels and Economic Reports for December 7th 2010

Today was a “slow trading day” when it came to stock indices, which leads me to a good point I would like to make. Most of our day traders, trade the e-mini stock index futures, mostly the mini SP because of its heavy daily volume and exposure.

However, I think that day-traders should be able to follow at least another market, maybe even two additional markets and look for different set up in these markets as well.

Good example from today is the Euro currency. While the mini SP was pretty dead….the Euro had nice range, good volatility and good volume which presents both risks and opportunities for day-traders.

Obviously, before you start trading a new market you should educate yourself on tick size, trading hours, “personality”, when is there more volume in that specific contract etc.

If you do so, I think you will achieve a couple of things, first is diversification. While some days trades in certain market may not work, trades in a different market may provide balance.

Also, if on certain days, certain markets are “sleepy” ( which most day-traders do NOT like), another market may have more action….

As always, do your homework, practice in simulation mode first and make sure you understand the “new contract” you may be trading along with the risks involved.

Below is a screen shot of the Euro Currency from todays webinar session :
( free trial at – https://www.cannontrading.com/tools/intraday-futures-trading-signals )

SP-500-Day-Trading-2010-12-07 Continue reading “Futures Trading Levels and Economic Reports for December 7th 2010”