Economic Reports & Futures Levels 1.13.2015

Connect with Us! Use Our Futures Trading Levels and Economic Reports RSS Feed.

Like us on FacebookFollow us on TwitterView our profile on LinkedInFind us on Google+Cannon Trading Futures Trading Resistance & Support Levels and Economic ReportsFind us on Yelp

1. Market Commentary
2. Futures Support and Resistance Levels – S&P, Nasdaq, Dow Jones, Russell 2000, Dollar Index
3. Commodities Support and Resistance Levels – Gold, Euro, Crude Oil, T-Bonds
4. Commodities Support and Resistance Levels – Corn, Wheat, Beans, Silver
5. Futures Economic Reports for Tuesday January 13, 2015

Hello Traders,

For 2015 I would like to wish all of you discipline and patience in your trading!

TradeTheNews.com Weekly Market Update: Topsy-Turvy

Global equity markets were racked with volatility this week, as competing economic themes vied for dominance. Monday and Tuesday were dominated by concerns about the increasing risk of European deflation and the euro zone potentially unraveling over a renewed Greek crisis. The risk on tone was restored on Wednesday as Chancellor Merkel gave assurances that Germany wants Greece to stay in the euro. Mid-week sentiment was also helped by an Obama Administration announcement that the FHA would dramatically cut its mortgage insurance premiums in hopes of kick-starting the still anemic housing market. Fed policy minutes reinforced the stance of “patience,” while the new slate of dovish FOMC voters flexed their wings, highlighted by Chicago Fed President Evans who proclaimed that raising rates before 2016 would be a “catastrophe.” By Friday, deflation fears were setting in again, as Brent crude hit fresh 5-year lows and the US jobs data showed that last month’s signs of nascent wage inflation had evaporated. The US 10-year yield retreating back below 2% signaled increased investor anxiety as the week drew to a close. The DJIA notched five straight triple digit moves and for the week fell 0.5%, while the S&P500 dipped 0.6% and the Nasdaq lost 0.5%.

The headline US jobs data showed better than expected payroll gains and another tick down in unemployment to 5.6%, but dissection of the report focused chiefly on the disheartening hourly earnings component. The very healthy November gain in wages was cut in half by revisions (to +0.2% from the preliminary +0.4%), and December hourly earnings were -0.2% m/m. The data pulled the y/y growth rate to its lowest level in more than two years (+1.7%). Note that the Fed is on record with its desire to see wage growth accelerate to +3% y/y to help it achieve its 2% inflation target.

The FOMC minutes out on Wednesday confirmed that if the labor market continues to heal, then the Fed is likely to raise rates in the middle of the year even as they remain “patient” on hikes for now. Many analysts say higher rates are likely to happen even if there is little progress on inflation. The WSJ’s Hilsenrath argued that a case is to be made that lower long-term yields may even push the Fed to hike sooner, given they could be a sign of global funds flowing into the US economy and away from anemic overseas markets, potentially inflating various asset bubbles.

Continue reading “Economic Reports & Futures Levels 1.13.2015”

Futures Levels & Economic Reports 1.09.2015

Connect with Us! Use Our Futures Trading Levels and Economic Reports RSS Feed.

Like us on FacebookFollow us on TwitterView our profile on LinkedInFind us on Google+Cannon Trading Futures Trading Resistance & Support Levels and Economic ReportsFind us on Yelp

1. Market Commentary
2. Futures Support and Resistance Levels – S&P, Nasdaq, Dow Jones, Russell 2000, Dollar Index
3. Commodities Support and Resistance Levels – Gold, Euro, Crude Oil, T-Bonds
4. Commodities Support and Resistance Levels – Corn, Wheat, Beans, Silver
5. Futures Economic Reports for Friday January 9, 2015

Hello Traders,

For 2015 I would like to wish all of you discipline and patience in your trading!

I did a quick Euro analysis for ForexMagnates.com, read the and view chart at:

experts.forexmagnates.com/euro-currency-futures-approaching-major-support/

Our blog is nominated for the STAR award once again!

2014 Trader Planet Award
Trader Planet Award

Please vote for our blog at:

www.traderplanet.com/l/qYd

Once there, scroll to the blog category and select

Daily Futures Trading Levels and Insight  as your first place and submit at bottom of the page!

Continue reading “Futures Levels & Economic Reports 1.09.2015”

Star Awards, Crude Oil Futures & Economic Reports 12.10.2014

Hello Traders,

For 2014 I would like to wish all of you discipline and patience in your trading!

Hello Traders,

Our blog is nominated for the STAR award once again!

Trader Planet Competition
Trader Planet

Please vote for our blog at:

www.traderplanet.com/l/qYd

Once there, scroll to the blog category and select

Daily Futures Trading Levels and Insight  as your first place and submit at bottom of the page!

Day Trading Commodities with Crude Oil Futures

Crude Oil Futures volatility offers a “different market personality” than stock index futures. Here is some of the things you need to know about day trading crude oil futures:

By: Ilan Levy-Mayer, Cannon Trading Commodities Broker & VP

Crude Oil is one of MY favorite futures market for day trading. Before I dive in and share with you how the volatility in crude oil fits my risk tolerance for day trading and provide a couple of chart examples, we should review some of the specifications of Crude Oil Futures

Crude Oil Futures have monthly expiration. So each month we trade a different contract month, so one needs to know when is the first notice day and last trading day for crude oil futures in order to always make sure we are trading the proper month with the most liquidity and avoid any chance of getting into delivery situation.

Next is the contract size. Crude Oil futures are based on 100,000 barrels. To be honest from a day trading perspective all I care is that each tick or 1 cent fluctuation is $10 against me or in my favor per contract. That means that a move from 92.94 to 92.74 = $200.

Continue reading “Star Awards, Crude Oil Futures & Economic Reports 12.10.2014”

Futures Levels and Economic Reports 7.24.2014

Connect with Us! Use Our Futures Trading Levels and Economic Reports RSS Feed.

Like us on FacebookFollow us on TwitterView our profile on LinkedInFind us on Google+Cannon Trading Futures Trading Resistance & Support Levels and Economic ReportsFind us on Yelp

1. Market Commentary
2. Futures Support and Resistance Levels – S&P, Nasdaq, Dow Jones, Russell 2000, Dollar Index
3. Commodities Support and Resistance Levels – Gold, Euro, Crude Oil, T-Bonds
4. Commodities Support and Resistance Levels – Corn, Wheat, Beans, Silver
5. Futures Economic Reports for Thursday July 24, 2014

Hello Traders,

For 2014 I would like to wish all of you discipline and patience in your trading!

Getting Clues from other markets?

When day trading a specific market do you only look at the chart for that specific market? Maybe you took it a step further and you are viewing multiple time frame charts for the same market which is a good step in my eyes.

Now lets take this even one step further by observing what markets have correlation, direct or inverse to the market you are trading, perhaps this can help you make decisions when trading.

I will give a few examples from my experience:

When I am in a position in the mini SP 500, I will often observe what the bonds are doing ( many times inverse correlation), I will take notice of what the Dow, Russell and NASDAQ are doing as well ( direct correlation).

If I am trading crude oil, I will many times pay attention to what unleaded gas and heating oil are doing (very close, although not direct correlation) as well as what WTI crude is doing.

One more example may be when I have a position trade in beans and I will try to get a feel for the overall direction of the grain markets (is there a trend? are they sideways?) by looking at corn, wheat in general and then look to see what bean oil and soy meal which are by products of beans are doing.

One question that can be asked is “what do you mean observe this or that market”? and a good example will be:

Lets say I am short the mini SP 500 and I am not sure if to take profit or not. I look at the mini Russell and see that mini Russell just made new lows, that will give me more confidence to stay in my short position as I feel there might be more room to the downside.

Continue reading “Futures Levels and Economic Reports 7.24.2014”

How Crude Oil Prices Affect Gas Prices

There are a few different aspects that factor into how crude oil prices affect what consumers pay at the pump. Oil is directly affected by geopolitical events, weather patterns, distribution costs, supply, demand and State and Federal taxes, to name a few. As the aforementioned forces are unpredictable and as they become more volatile, so becomes crude oil. Understanding each factor and the role it plays with respects to the rise and fall in prices, may help someone understand how to utilize the information to make better trading decisions.

Supply

First and foremost supply is affected by various socioeconomic and political factors within and around the region of origin. Also, OPEC, an organization commenced in 12 of the top oil producing companies and producing just fewer than 50% of the world’s oil supply, regulate their portion of crude oil produced. Often OPEC will be in positions to sell or barter away the oil they produce in exchange for currency or other assets that will benefit their interests. The United States itself houses around 700 million barrels in its Strategic Petroleum Reserves for use in the event of political dissensions with oil producing nations, as well as for emergencies such as natural disaster affected regions of the country.

Demand

The driving forces behind the demand for crude oil can be a number of factors. The most obvious, of course, is the rate and amount of oil each country uses. According to the CIA World Fact book, the United States tops of the market at 21%, the EU uses 15% of the world’s oil and China consumes 11%. As countries develop, particularly within their middle class infrastructure, this creates more consumers and more consumers using vehicles, driving the demand higher. On the back end of developments like this, oil refineries must adjust production to suit the growing need, which also incurs a higher cost in that production.

Continue reading “How Crude Oil Prices Affect Gas Prices”

Crude Oil and Gold Futures Chart, Futures Levels and Economic Reports 2.12.2013

Connect with Us! Use Our Futures Trading Levels and Economic Reports RSS Feed.

Like us on FacebookFollow us on TwitterView our profile on LinkedInFind us on Google+Cannon Trading Futures Trading Resistance & Support Levels and Economic ReportsFind us on Yelp

1. Market Commentary
2. Futures Support and Resistance Levels – S&P, Nasdaq, Dow Jones, Russell 2000, Dollar Index
3. Commodities Support and Resistance Levels – Gold, Euro, Crude Oil, T-Bonds
4. Commodities Support and Resistance Levels – Corn, Wheat, Beans, Silver
5. Futures Economic Reports for Wednesday February 12, 2014

Hello Traders,

For 2014 I would like to wish all of you discipline and patience in your trading!


Trader Planet


Voted Best Blog 2013 by Trader Planet

Thanks everyone who voted!! Appreciate your help in winning the #1 blog for futures trading by Trader Planet!! Please feel free to forward our daily blog to friends and other fellow traders who might be interested.

Another two markets I like to touch on when it comes to “other markets to daytrade beside the mini SP 500” are crude Oil and Gold futures.

More than a few similarities between the two markets.

They are both volatile, can move VERY fast. I have seen some very large moves happen in matter of minutes if not seconds. The “fear & greed” factor really plays a role in these specific two markets.

Both have active trading hours starting with Far East trading around 10 PM est all the way to the next morning until about 3 PM est. Good volume generally speaking but not close to the mini SP or ten year notes. So you may see some slippage on stops but the volume is more than enough to trade size.

Each tick on gold is $10, so every dollar move =$100 against you or in your favor. Crude is similar, each tick = $10. One full $1 move = $1000.

Both markets were quiet today relatively speaking but even on a quiet day, the range on gold was  $21 or = $2100 wide using one futures contract. Crude ranges today was less than $1 or about $890 between hi/lo.

I like using overbought/ oversold indicators on the two markets as well as using range / Renko charts.

If you never traded these markets before, I highly recommend exploring in simulation/ demo mode. get a feel for the explosiveness, volatility, personality for a few weeks before trying in live mode.

As always, any questions, please feel free to email me.

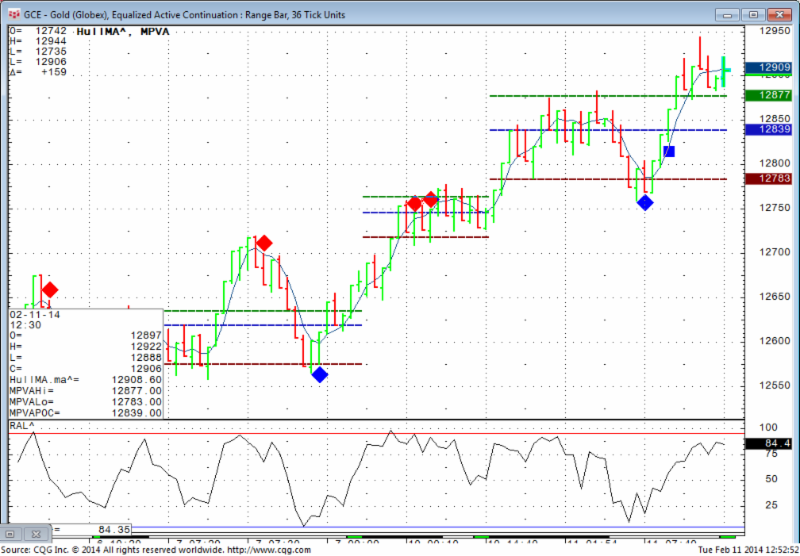
Two charts from today’s session of gold and crude for your review below ( if you like to try the charts I am using along with indicators displayed, send me an email):


Crude 18 ticks range bar Feb. 11th 2014

CLE - Crude Lights (Globex), Equalized Active Continuation - Range Bar 18 Ticks Units

Gold, 36 ticks range bar Feb. 11th 2014


GCE - Gold (Globex), Equalized Active Continuation - Range Bar =, 18 Ticks Units
GCE – Gold (Globex), Equalized Active Continuation – Range Bar =, 18 Ticks Units

Continue reading “Crude Oil and Gold Futures Chart, Futures Levels and Economic Reports 2.12.2013”

How Does Crude Oil Affect Gas Prices? What Else Does?

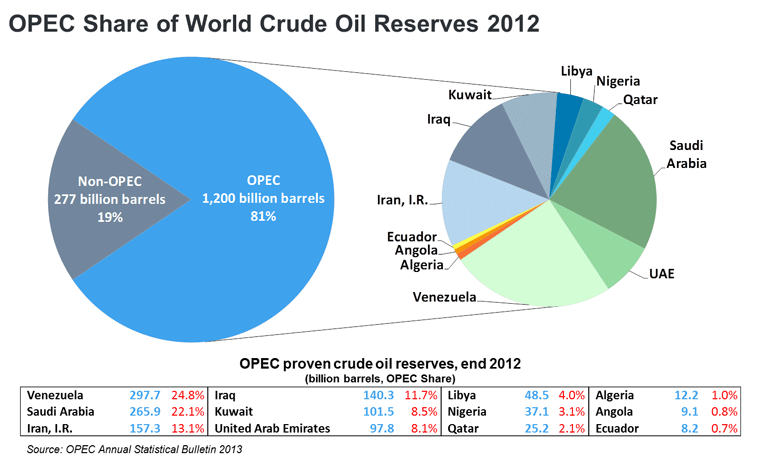
The answer to the question in the title of this piece was stated pretty assuredly in a 2005 publication by the Federal Trade Commission. The most important factor in the price of gasoline, the 166-page report concluded, was “the world price of crude oil“. It went on: “Over the last 20 years, changes in crude oil prices have explained 85% of the changes in the price for gasoline in the U.S.”1 And there aren’t too many macro-unknowns out there to affect the price of crude oil. The world produces roughly 85 million barrels of oil every day and every day the world’s population consumes about 90 million barrels. And the generally accepted relationship between crude oil and gasoline is that for every $1 dollar per barrel crude oil moves, gas prices move about 2 ½ cents at the pump. It’s also generally accepted that there’s approximately 1.5 trillion barrels of oil yet to be extracted from the planet – what are called proven reserves – equal to about 50 more years of supply based on our current consumption rate. And according to OPEC’s web site, that cartel – created over 50 years ago – controls about 80% of those reserves.

OPEC Share of World Crude Oil Reserves 2012

Account for some margin of error and those are all pretty workable numbers for a global commodity like crude oil to live with. The quandary for tracking gas prices isn’t that you can’t measure them accurately against the price of crude oil. That relationship is pretty ingrained. It’s the many other factors that also come into play – at different levels of influence and intensity and at irregular intervals – that cause gasoline prices to move.

Just take a look at the last 6 months. Crude oil shot up over 20% from $86 per barrel to almost $110 per barrel. It then fell over 10% back down to near $96 per barrel.

Continue reading “How Does Crude Oil Affect Gas Prices? What Else Does?”

Crude Oil Guide: Brent Vs. WTI, What’s The Difference?

“U.S.-produced oil is a substitute, in terms of volume, to non-U.S. sources, and it’s geographically safe and secure, sending a hedge into the WTI price, not into Brent,” said Richard Hastings, a macro strategist at Global Hunter Securities.

Hastings made the comments when the price spread between the crudes traded at less than $1 back in July “Brent, in turn, reflects macroeconomic weakness from around the world, something which is less meaningful to WTI pricing,” he explained. 1

WTI (West Texas Intermediate), North Sea Brent and the OPEC (Organization of Petroleum Exporting Countries) Benchmark.

What Are the Major differences between these crude oil futures contracts?:

Sulfur Content: Some Crude oils are easier, less costly to refine into gasoline than others. Low sulfur crude is also known as Sweet crude. The commonly used measure of sulfur content is API gravity, is a measure of how heavy or light a petroleum liquid is compared to water. If its API gravity is greater than 10, it is lighter and floats on water; if less than 10, it is heavier and sinks. API is the American Petroleum Institute.

Continue reading “Crude Oil Guide: Brent Vs. WTI, What’s The Difference?”