Currency & Stock Index Futures: Avoid Costly Mistakes with these 3 Critical Deadlines

7cfe5b36 db9f 4933 824a 7f264613e7fe

Cannon Futures Weekly Letter

In Today’s Issue #1234

  • Rollover
  • The Week Ahead – FOMC, Housing
  • Futures 102 – Can you handle Drawdowns??
  • Hot Market of the Week – May KC/ Chi Wheat Spread
  • Broker’s Trading System of the Week – NQ intraday System
  • Trading Levels for Next Week
  • Trading Reports for Next Week

currency

Currencies Last Trading Day & Stock Index rollover

Time to start trading June Stock Index futures like MESM25 and MNQM25.

Symbol for June is M.

Monday, March 17th is Last Trading Day for all currency futures contracts, except the Canadian Dollar (Last Trading Day for the Canadian Dollar is Tuesday, March 18th). Currency futures contracts are DELIVERABLE CONTRACTS. You need to exit ALL LONG and SHORT open positions or be required to deliver or take delivery of the ACTUAL NOMINAL VALUE of the respective futures contract, i.e. $12,500 Euros, or $12,500,000 Japanese Yen. DO NOT put your account is this position. Exit all March ‘25 currency futures. Start trading currency futures with the June ’25 futures contracts.

Friday, March. 21st is Last Trading Day for March stock index futures contracts, i.e., the E-mini S&P, E-mini NASDAQ, E-mini Dow Jones and their Micro relatives. These futures contracts will halt trading at 8:30 A.M., Central Time and are cash settled, meaning any remaining open positions will be offset/settled using a to-be-determined settlement price. It is recommended that all new positions be placed in the June ‘25 futures contracts as of this Sunday night’s opening of trading. Volume in the March ‘25 contracts will begin to drop off until their expiration Friday, March. 21th.

Important Notices: The Week Ahead

By John Thorpe, Senior Broker

FOMC Week!

Indices traders roll to June, —M25

The Senate will vote today on a continuing resolution spending bill to keep the govt. open until Sept. 30. It must be on the Presidents desk by 11:59 pm EST to avoid a shut down, This may occur during market hours or after.

More volatility to come as next week all markets will be reacting to the potential for tariff implementations creating uncertainty in the marketplace. Therefore, increased volatility expectations.

Highlights next week will include Housing Data as well as the Wednesday Rate decision. Earnings reports continue to dwindle with 271 total reports while we are in the top of the 9th inning of earnings season, the reports will be impacting the indices much less than in past weeks Highlighted by many Chinese corp. reports. Finally, for Indices traders, contract rollover Monday. June will become the front month. M25. If you are on the new StoneX Platform, click on your current month tab at the top of your DOM or HOT to open the menu. Then slide down to Replace, now type in EPM25 if you are trading the Mini-S&P or ENQM25 for the Mini Nasdaq.

Earnings Next Week:

  • Mon. Quiet
  • Tue. Quiet
  • Wed. Tencent
  • Thu. Micron, Nike
  • Fri. Quiet

FED SPEECHES:

  • Mon.     Fed Blackout period
  • Tues.     Fed Blackout Period persists
  • Wed.     Fed Rate Decision 3/19/25 Chair Powell will Speak, 30 minutes after the rate decision.
  • Thu.      Last day of Fed Blackout period
  • Fri.       Williams 8:05 am CDT

Economic Data week:

  • Mon. Empire State Mfg., NAHB Housing Market Index
  • Tue. Bldg. Permits, Housing Starts, Redbook, Industrial Production
  • Wed. EIA Crude Stocks, FOMC I.R. Decision 1:00 pm followed by Fed Presser 1:30 pm CDT
  • Thur. Initial Jobless Claims, Philly Fed, Existing Home Sales, EIA Nat Gas
  • Fri Quiet

Futures 102: System Traders: Can you handle the drawdowns?

Many investors may think, “I can handle drawdown”, but honestly you have no idea how much drawdown you can handle until you have been stuck in the eye of a number of your own personal drawdown storms.

While drawdown is a natural part of trading and investing, what does differ is how much drawdown each investor can mentally handle. As humans, we all ‘see’ the world differently. What appears as something normal to one person can appear completely disastrous to another. While a 10% portfolio drawdown could be extreme for one investor, the next investor may be able to trade through periods of 50% plus drawdown.

From the behavioral finance point of view, some of the main negative facts of the human brain related to trading are:

  1. The fact that weak traders tend to be reluctant to realize losses and quick to realize gains. They are more risk averse when dealing with profitable positions and more risk seeking when dealing with losses.
  2. The fact that weak traders make inconsistent and irrational economic decisions over the same scenario depending on how it is described.
  3. The fact that weak traders deals with positions as if they were expecting mean reversion of prices. They are expecting the price to return to a long term average. This is the principle that makes them think they are buying expensive positions on volatility breakout or trend following strategies.

It is out of the scope of this article to talk much more about this science, but I will just point that:

  1. Weak traders know nothing about behavioral finance, so they think that his gut feeling is right and base their decisions on his gut feeling.
  2. Smart traders knows about behavioral finance. A smart trader has already studied about this and trained himself to overcome this limitations.  At least they know how to deal with their brain to avoid most of the damage it can create on their trading accounts. The best traders knows even how to monetize from this herd behavior.

Are drawdown periods a bad thing?


In my opinion, they are not a bad thing, in fact I believe that drawdown periods are a very sane and good thing for any solid strategy. Drawdown periods are very efficient to shake out weak traders from the strategy while smarter traders can pick up their money (which is the name of the game after all).

The time that passes since the first equity high until we reach a new equity high is the drawdown period.

So a drawdown period has two dimensions:

  • The drawdown depth
  • The drawdown length

Most people mostly care about the drawdown depth as this is what is easier to see on back tests. But human the brain is much more affected by drawdown length. During live trading, it is easier to deal with a 10% drawdown for one week than with a 5% drawdown for five months.

  • Detailed statistical information about the strategy: Expected profit, expected drawdown, maximal drawdown depth and length, average win percentage, reward to risk ratio, …
  • Different scenarios and the actions to take (if any): intense and/or deep drawdown periods and what to do (or do nothing), whether to trade during Christmas time or summer time, whether to keep opened positions during weekends or not, what to do after a losing year (or do nothing), funding and withdrawing plan, …
  • A very clear worst case scenario: it is basically the “line in the sand” where we know that the strategy has lost it’s edge and something must be done (stop trading the strategy, adapting parameters, …). There are many ways to calculate it (double the max historical drawdown, using montecarlo simulations, using regression lines multiplied by x times the standard deviation on the equity curve, …). In the end it is a number. The important thing is to have it written in the trading plan.

When facing a problem that generates pain or panic such as a sudden deep drawdown, most of the time, when analyzed with rigor and care, the problem is not so important, and everything is within expected statistics. You will see that there were many periods in the past with similar characteristics.

Hot Market of the Week

Hot market of the week is provided by QT Market Center, A Swiss army knife charting package that’s not just for Hedgers, Cooperatives and Farmers alike but also for Spread traders, Swing traders and shorter time frame application for intraday traders with a unique proprietary indicator that can be applied to your specific trading needs.

Free Trial Available

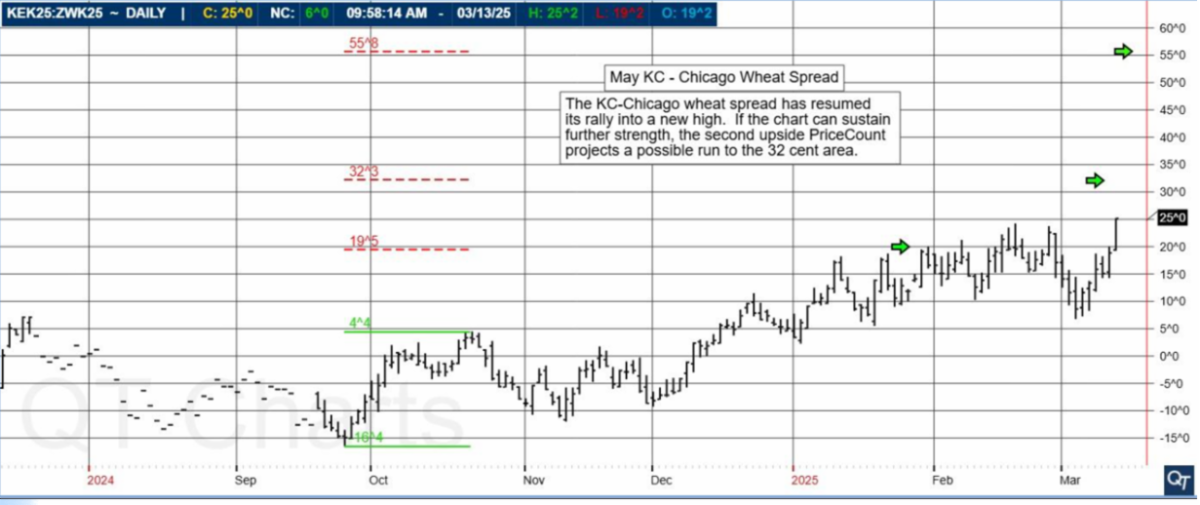
May KC – Chicago Wheat Spread

The KC-Chicago wheat spread has resumed its rally into a new high. If the chart can sustain further strength, the second upside PriceCount projects a possible run to the 32-cent area.

04f865a9 1c11 4576 b13a 867dcc05b204

The PriceCount study is a tool that can help to project the distance of a move in price. The counts are not intended to be an ‘exact’ science but rather offer a target area for the four objectives which are based off the first leg of a move with each subsequent count having a smaller percentage of being achieved. It is normal for the chart to react by correcting or consolidating at an objective and then either resuming its move or reversing trend. Best utilized in conjunction with other technical tools, PriceCounts offer one more way to analyze charts and help to manage your positions and risk. Learn more at www.qtchartoftheday.com

Trading in futures, options, securities, derivatives or OTC products entails significant risks which must be understood prior to trading and may not be appropriate for all investors. Past performance of actual trades or strategies is not necessarily indicative of future results.

Brokers Trading System of the Week

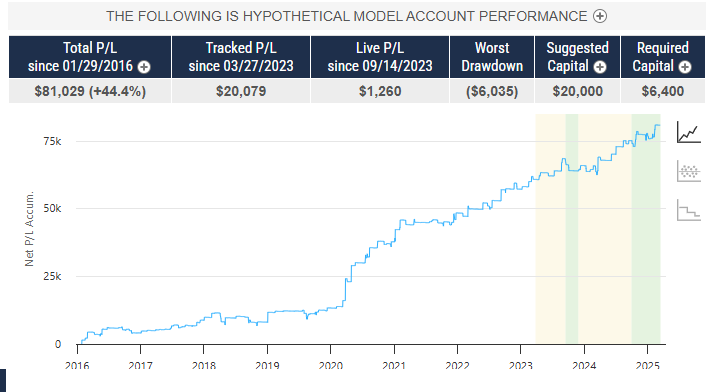
With algorithmic trading systems becoming more prevalent in portfolio diversification, the following system has been selected as the broker’s choice for this month.

Intra Nasdaq

PRODUCT

Mini NASDAQ

SYSTEM TYPE

Day Trading

Recommended Cannon Trading Starting Capital

$20,000

COST

USD 85 / monthly

Get Started

Learn More

98f6920d d939 4f0b a401 19b6cebb6155

The performance shown above is hypothetical in that the chart represents returns in a model account. The model account rises or falls by the average single contract profit and loss achieved by clients trading actual money pursuant to the listed system’s trading signals on the appropriate dates (client fills), or if no actual client profit or loss available – by the hypothetical single contract profit and loss of trades generated by the system’s trading signals on that day in real time (real‐time) less slippage, or if no real time profit or loss available – by the hypothetical single contract profit and loss of trades generated by running the system logic backwards on back adjusted data. Please read full disclaimer HERE.

Would you like to get weekly updates on real-time, results of systems mentioned above?
Yes
No

Trading Levels for Next Week

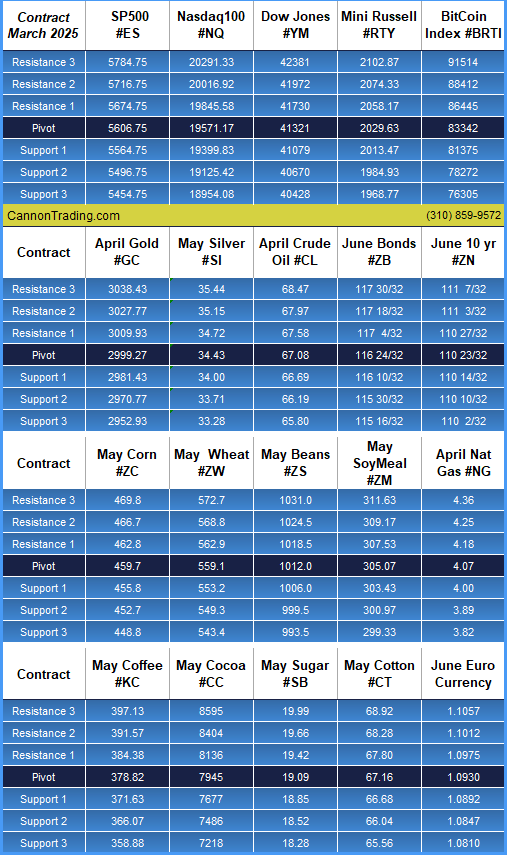
Daily Levels for March 17th, 2025

68e10b2b d361 4459 99e9 c157f620ce96

Would you like to receive daily support & resistance levels?
Yes
No

Trading Reports for Next Week

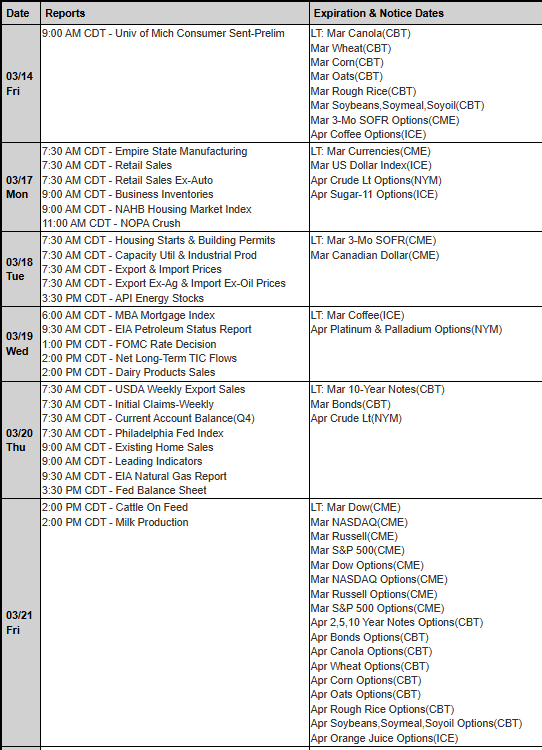
First Notice (FN), Last trading (LT) Days for the Week:

www.mrci.com 

b74635bd 884f 41ea b758 e4a8b904d3f3

Find us on Trustpilot

stars

Trading Futures, Options on Futures, and retail off-exchange foreign currency transactions involves substantial risk of loss and is not suitable for all investors. You should carefully consider whether trading is suitable for you in light of your circumstances, knowledge, and financial resources. You may lose all or more of your initial investment. Opinions, market data, and recommendations are subject to change at any time.

Call Now

Join our Private Facebook group

Subscribe to our YouTube Channel

Listen to our podcast: Subscribe on AppleSpotify, Amazon

or wherever you listen to podcasts!

S
Facebook  Instagram  LinkedIn
S
ef3ab1c9 8d6d 4e60 a3f1 af5d9d4ecbb3
Services
Software
Tools
Community
Contact

Australian Dollar Chart & Economic Reports 11.18.2014

Hello Traders,

For 2014 I would like to wish all of you discipline and patience in your trading!

Hello Traders,

 In the past I shared some markets I like to look at for day trading opportunities when stock index futures are in dead/ manipulated periods….Today I would like to talk a little about the currency futures markets. I personally prefer currency futures over FOREX any day. More than a few reasons but the main ones are: currency futures trade on one, regulated main exchange ( CME) while FOREX trades through different inter banks and other means of transactions that are not necessarily regulated.FOREX are “commission free” but in reality there is a spread built in that dealer marks up each time you buy or sell which makes FOREX more expensive than futures.

The main ones I like to follow are:

The Euro , The Yen, The British Pound, The Australian. All are paired versus the US$.

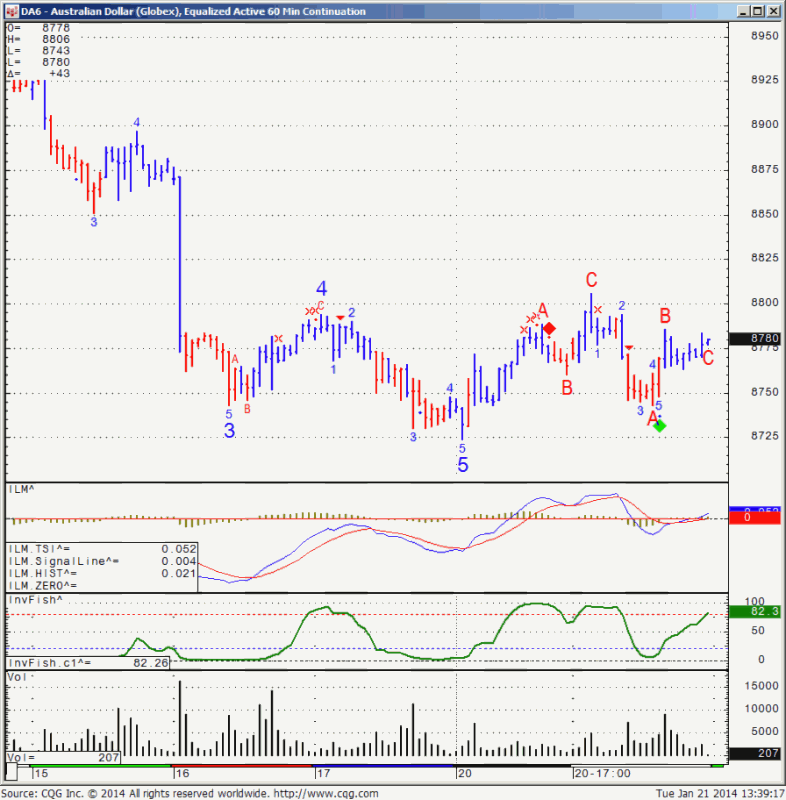
Each market will have different times of higher volume which can allow for traders in all time zones to pick their market. Simply open an hourly chart, like the example I am showing below of the Australian $ and add the volume indicator to observe what times the market has the most action.

  • 1 Euro tick is $12.50
  • 1 Yen tick is $12.50
  • 1 Aussie tick is $10
  • 1 British tick is $6.25
  • 1 Canadian Dollar tick is $10

Currency futures will often trend better than other segments and will experience different levels of volatility during economic reports in the different parts of the world.

If you plan on following any currencies, start in demo mode, know what reports are coming that affect the specific currency you are trading, take a look at the daily, weekly charts to get a feel and monitor the action for a while.

Any questions and I will be happy to assist.

Continue reading “Australian Dollar Chart & Economic Reports 11.18.2014”

Rollover Notice, Economic Reports & Levels 09.10.2014

Hello Traders,

For 2014 I would like to wish all of you discipline and patience in your trading!

Rollover Notice for Stock Index Futures

Important notice: For those of you trading any stock index futures contracts, i.e., the E-mini S&P, E-mini NASDAQ, E-mini Dow Jones, the “Big” pit-traded S&P 500, etc., it is extremely important to remember that tomorrow, Thursday, Sept.11th, is rollover day.

Starting Sept. 11th, the December 2014 futures contracts will be the front month contracts. It is recommended that all new positions be placed in the December 2014 contract as of Sept. 11th. Volume in the Sept. 2014 contracts will begin to drop off until its expiration on Friday September 19th.


The month code for December is Z4.


Traders with electronic trading software should make sure that defaults reflect the proper contract as of Thursday morning.


Please close any open September Currency positions by the close on Friday the 12th.

Should you have any further question please contact your broker.


Australian Dollar Chart, Futures Levels & Economic Reports 1.22.2014

Connect with Us! Use Our Futures Trading Levels and Economic Reports RSS Feed.

Like us on FacebookFollow us on TwitterView our profile on LinkedInFind us on Google+Cannon Trading Futures Trading Resistance & Support Levels and Economic ReportsFind us on Yelp

1. Market Commentary
2. Futures Support and Resistance Levels – S&P, Nasdaq, Dow Jones, Russell 2000, Dollar Index
3. Commodities Support and Resistance Levels – Gold, Euro, Crude Oil, T-Bonds
4. Commodities Support and Resistance Levels – Corn, Wheat, Beans, Silver
5. Futures Economic Reports for Wednesday January 22, 2014

Hello Traders,

For 2014 I would like to wish all of you discipline and patience in your trading!

I need your help!

I have gotten and getting great feedback from many of you and would appreciate if you can take a couple of seconds to vote at:

Traders Planet Awards


There are more than a few markets one can daytrade beside stock indices….

Today I would like to talk a little about the currency futures markets. I personally prefer currency futures over FOREX any day. More than a few reasons but the main ones are: currency futures trade on one, regulated main exchange ( CME) while FOREX trades through different interbanks and other means of transactions that are not necessarily regulated. FOREX are “commission free” but in reality there is a spread built in that dealer marks up each time you buy or sell which makes FOREX more expensive than futures.

The main ones I like to follow are:

The Euro, The Yen, The British Pound, The Australian. All are paired versus the US$.

Each market will have different times of higher volume which can allow for traders in all time zones to pick their market. Simply open an hourly chart, like the example i am showing below of the Australian $ and add the volume indicator to observe what times the market has the most action.

  • 1 Euro tick is $12.50
  • 1 Yen tick is $12.50
  • 1 Aussie tick is $10
  • 1 British tick is $6.25

Currency futures will often trend better than other segments and will experience different levels of volatility during economic reports in the different parts of the world.

Another point is that currencies also have MICRO contracts, which may be a great transition from demo mode to LIVE mode, as these contracts are pretty small ( one tenth of the normal size)

If you plan on following any currencies, start in demo mode, know what reports are coming that affect the specific currency you are trading, take a look at the daily, weekly charts to get a feel and monitor the action for a while.

Any questions and i will be happy to assist.


DA 6 - Australian Dollar (Globex), Equalized Active 60 Min Continuation
DA 6 – Australian Dollar (Globex), Equalized Active 60 Min Continuation