Weekly Newsletter 1073: Using Tick/Volume charts and Oscillators for Scalping & Trading Levels for the Week Ahead

Cannon Futures Weekly Letter Issue # 1073

Dear Traders,

Like us on FaceBook!
Get Real Time updates and market alerts on Twitter!


Day Trading 201: Using Tick/Volume charts and Oscillators for Scalping

Using tick charts and oscillators for day-trading (by Ilan Levy-Mayer VP of Cannon Trading and CTA at Levex.net )
I really don’t think anyone has found a “perfect way” to day-trade.
Different techniques work well in different market environment.
In this week short educational feature, I will touch on one technique you can add to your trading arsenal. This technique works better on choppy, two sidedway and/or volatile markets. It does NOT work well when the market has a strong trend.
The chart below illustrates a few principals I like:
  1. It uses a tick chart rather than a time chart. I like tick charts ( range bar, volume charts, renko) better when day-trading shorter time frames for the simple reason it already includes a big factor in the market, VOLUME. If you are using a 5 minute chart for example, you may get signals simply because time “has passed” and certain indicators you are using adopt certain values. When using tick charts during periods where there are lots of movement, you won’t have to wait until your time frame bar closes to get your signal, volume becomes a bigger more important part of your trading decision.
  2. The other part for this trading approach is to use overbought/ oversold indicators in an attempt to catch exhuastion in selling or buying and catch the counter trend move. Sometimes that move will be minor, sometimes it will be a trend reversal and at other times just a little pause in a strong trend….no crystal balls here, just another tool to observe and consider in your trading. In the PDF you will see the same indicators, same market, same time frame BUT using different type of charts…..

Good Trading

Trading Futures, Options on Futures, and retail off-exchange foreign currency transactions involves substantial risk of loss and is not suitable for all investors.  You should carefully consider whether trading is suitable for you in light of your circumstances, knowledge, and financial resources. You may lose all or more of your initial investment. Opinions, market data, and recommendations are subject to change at any time when it comes to Futures Trading.


Futures Trading Levels

11-01.2021
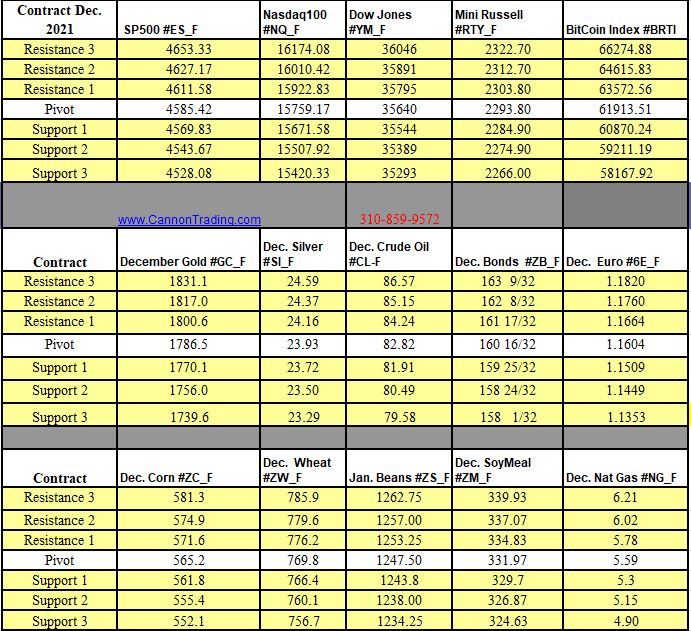
 

Futures Levels 11.01.2021

Weekly Levels

fe9405fd c27a 464d 8fee 11d94285d4b3


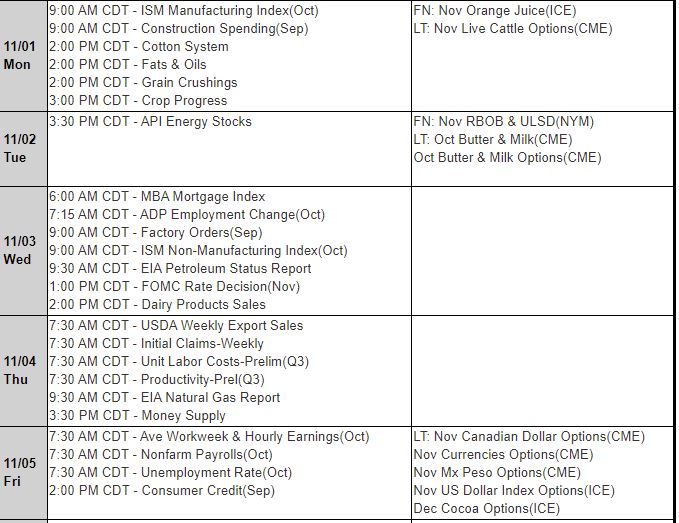
Reports, First Notice (FN), Last trading (LT) Days for the Week:
https://mrci.com

Date Reports/Expiration Notice Dates

1f53c4e1 de2d 4aaf bd17 a4f58561ba57

This is not a solicitation of any order to buy or sell, but a current market view provided by Cannon Trading Inc. Any statement of facts here in contained are derived from sources believed to be reliable, but are not guaranteed as to accuracy, nor they purport to be complete. No responsibility is assumed with respect to any such statement or with respect to any expression of opinion herein contained. Readers are urged to exercise their own judgement in trading

Volume Based Trading Emini NQ & Support and Resistance Levels 1.14.2021

_________________________________________________

Voted #1 Blog and #1 Brokerage Services on TraderPlanet for 2016!!  

_________________________________________________

Dear Traders,

Like us on FaceBook!
Get Real Time updates and market alerts on Twitter!
Today I am sharing an example of using volume chart along with FIB levels when following intraday market action.
Market is NQ
Chart type is CVB = constant volume bar
5000 contracts traded complete one bar.
This model uses a theory that when it comes to short term day trading, volume is much more important than time, hence the use of volume bars. I use bars of between 1,000 to 18,000 contracts traded (pending the specific market, based on recent volatility, trade volume and a few other factors). That means that instead of bars completing based on time frame (i.e. 1 minute or 15 minutes etc.), we use volume instead of time. So each time X,000 contracts traded, a new bar will complete.  When the specific market has high volume and is moving fast, the bars will complete faster. When market is in low volume without much action, the bars will complete slower.
For me personally, this has helped getting signals ahead of time when there is fast action in the market and avoiding false signals when volume is low.
Needless to say volume charts on their own are no crystal ball and there is much more to trading but may help you take a look at your charts from a a diff. angle.
NQ Emini - Nasdaq Volume Base Chart
NQ Emini – Nasdaq Volume Base Chart, 5000 contracts 1.13.2021
To access a free trial to the ALGOS shown in the chart along with other tools, visit and sign up for a free trial for 21 days with real-time data.

Good Trading

Trading Futures, Options on Futures, and retail off-exchange foreign currency transactions involves substantial risk of loss and is not suitable for all investors.  You should carefully consider whether trading is suitable for you in light of your circumstances, knowledge, and financial resources. You may lose all or more of your initial investment. Opinions, market data, and recommendations are subject to change at any time when it comes to Futures Trading.


Futures Trading Levels

1-14-2021

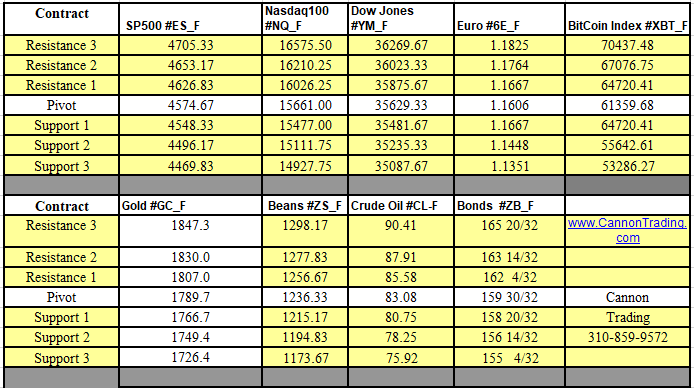
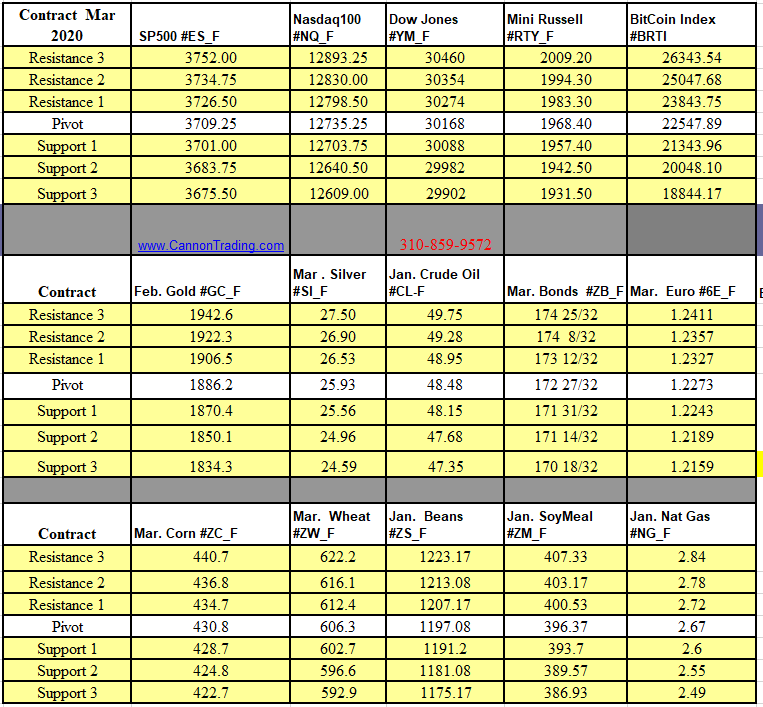
Futures Support & Resistance Levels 1.14.2021

Economic Reports, source: 

 www.BetterTrader.co

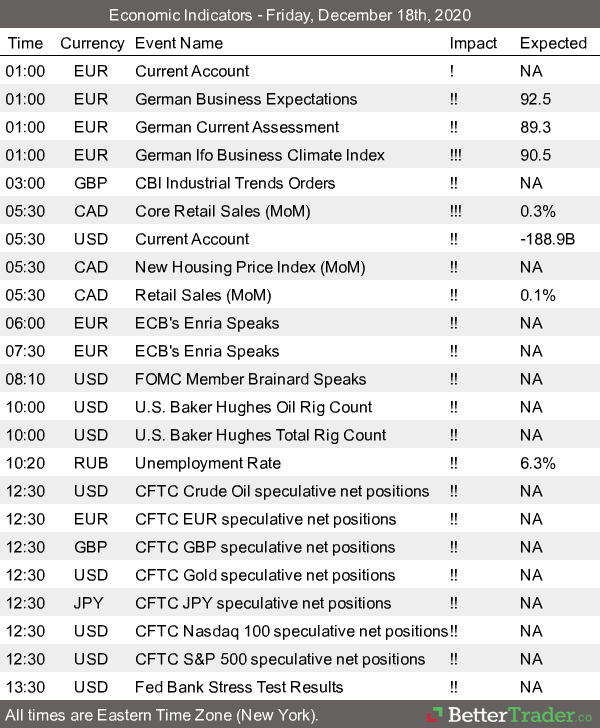
BetterTrader Futures Reports 1.14.21


This is not a solicitation of any order to buy or sell, but a current market view provided by Cannon Trading Inc. Any statement of facts here in contained are derived from sources believed to be reliable, but are not guaranteed as to accuracy, nor they purport to be complete. No responsibility is assumed with respect to any such statement or with respect to any expression of opinion herein contained. Readers are urged to exercise their own judgement in trading.

Weekly Dow Jones Futures Chart and Support and Resistance Levels 12.30.2020

_________________________________________________

Voted #1 Blog and #1 Brokerage Services on TraderPlanet for 2016!!  

_________________________________________________

Dear Traders,

Like us on FaceBook!
Get Real Time updates and market alerts on Twitter!
Two more trading days left in 2020!!
Thank you for choosing Cannon during this challenging year. We look forward to continuing to provide you with excellent service in 2021 and wish you a healthy, successful year ahead!
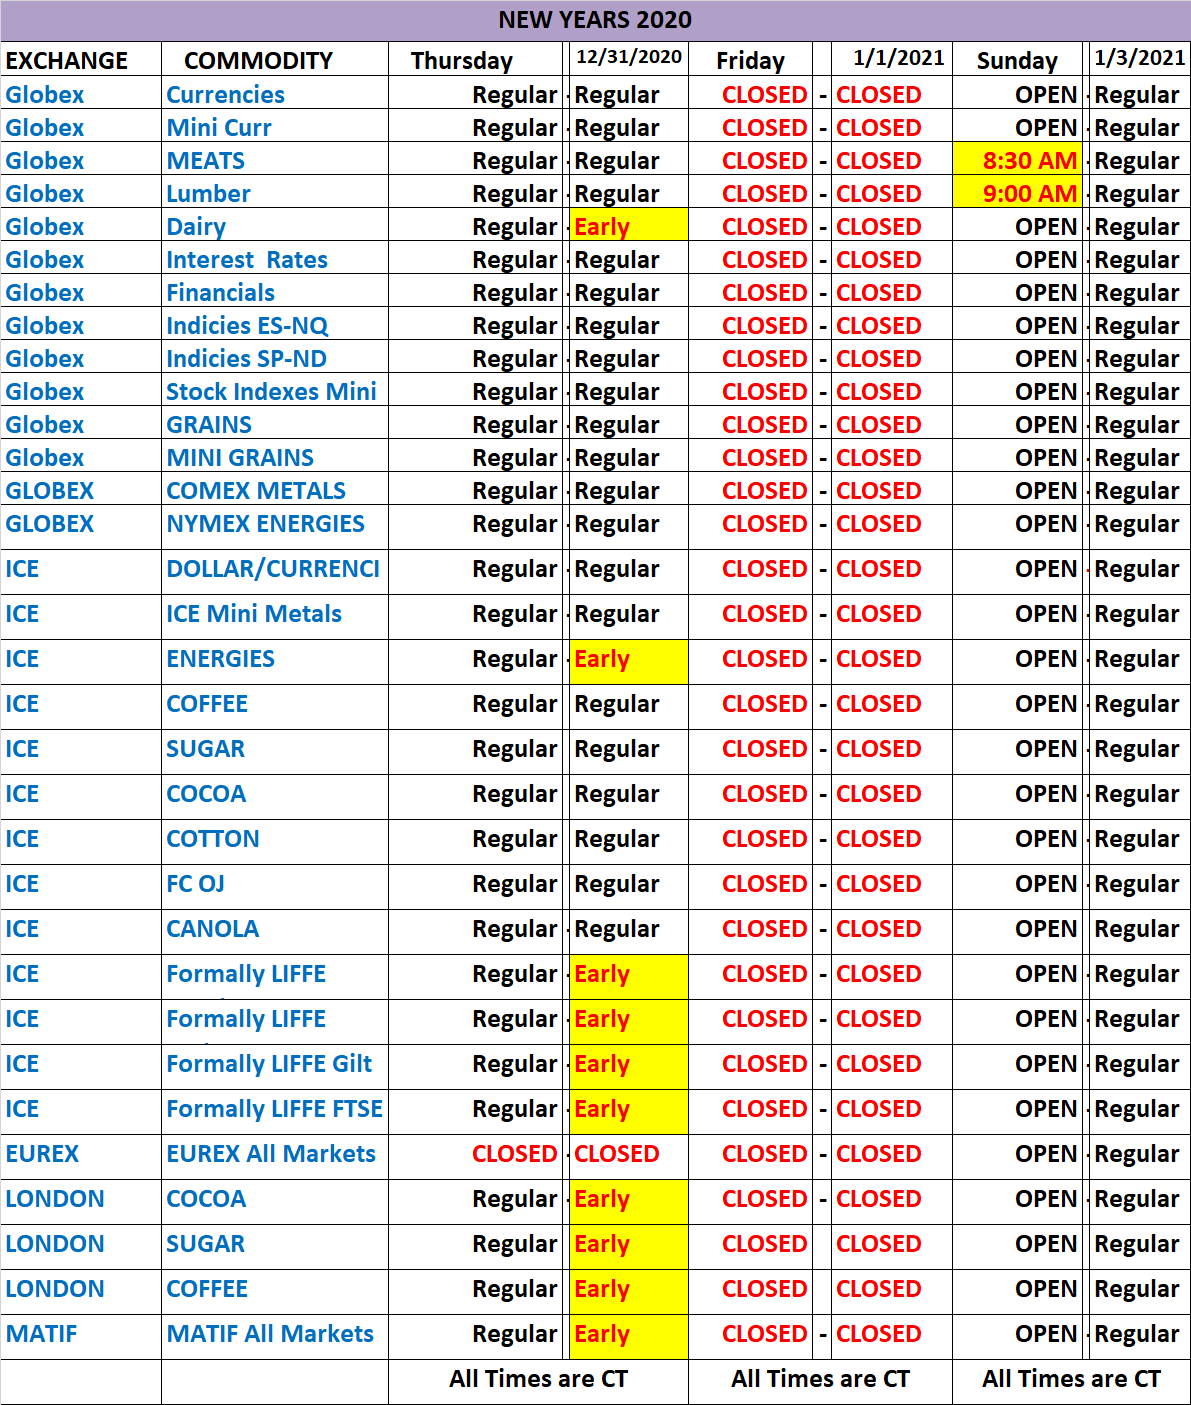
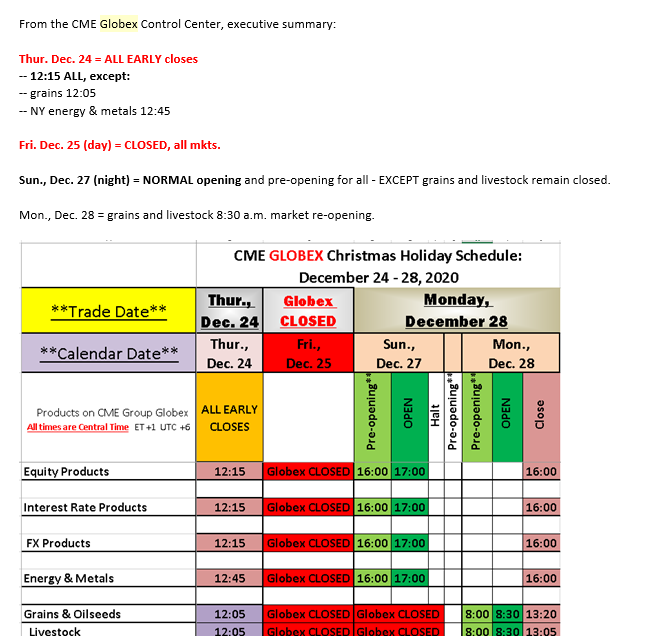
New Years Holiday Futures Trading Schedule 2020 CME GLOBEX
Weekly Dow Jones Cash Index with possible upside target as well as support level below. Keep in mind this is a WEEKLY chart.
Dow Jones Futures Emini MICRO Futures

Good Trading

Trading Futures, Options on Futures, and retail off-exchange foreign currency transactions involves substantial risk of loss and is not suitable for all investors.  You should carefully consider whether trading is suitable for you in light of your circumstances, knowledge, and financial resources. You may lose all or more of your initial investment. Opinions, market data, and recommendations are subject to change at any time when it comes to Futures Trading.


Futures Trading Levels

12-30-2020

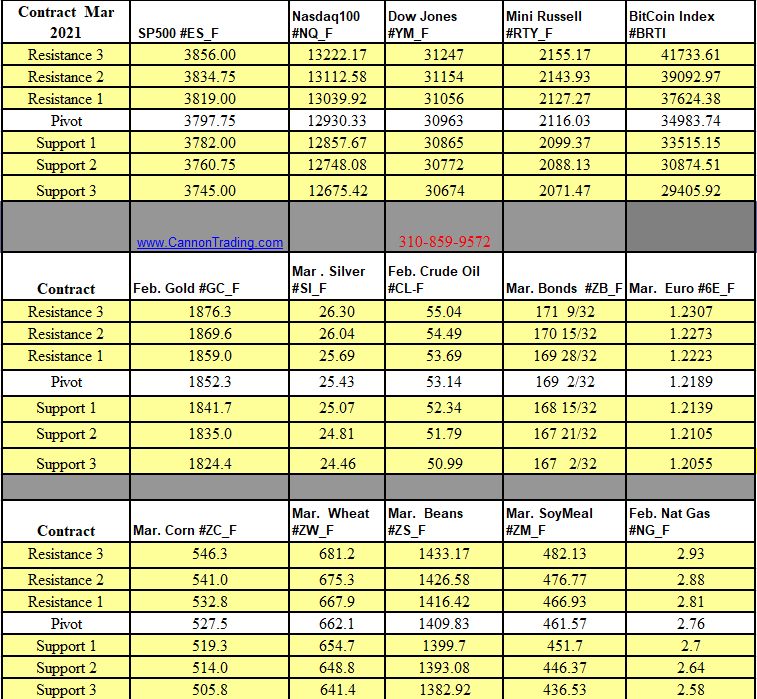
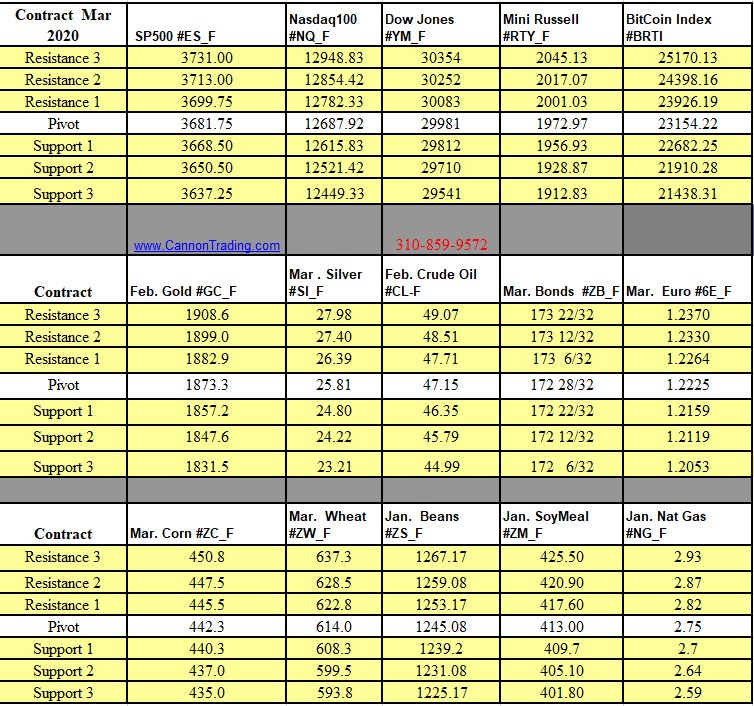
Futures Support & Resistance Levels 12.30.2020

Economic Reports, source: 

 www.BetterTrader.co

BetterTrader Futures Reports


This is not a solicitation of any order to buy or sell, but a current market view provided by Cannon Trading Inc. Any statement of facts here in contained are derived from sources believed to be reliable, but are not guaranteed as to accuracy, nor they purport to be complete. No responsibility is assumed with respect to any such statement or with respect to any expression of opinion herein contained. Readers are urged to exercise their own judgement in trading.

Trading Insight: “Look Before You Leap” and Support & Resistance Levels 12.23.2020

_________________________________________________

Voted #1 Blog and #1 Brokerage Services on TraderPlanet for 2016!!  

_________________________________________________

Dear Traders,

Like us on FaceBook!
Get Real Time updates and market alerts on Twitter!
This was shared with me by a colleague of mine few years back and I can fully relate and wanted to share it with you as well:
“Look Before You Leap”
On the way to becoming (trying to become…) a successful Futures trader you will incur many losses.
That I can attest to.
One way to guarantee you will never be a successful trader is by taking “out sized” losses.
There was a time, in my 22 year career, that I would get an idea, in my head, that I had to be in a market, jump in and then look at where a proper stop loss would have to be placed and panic because the loss would be too great if the stop loss was reached.
So being the rookie that I was, I would place what was known as a “money’ stop, which is one that is based on how much money I was willing to risk rather one that was based on support or resistance.
Because this type of stop level was arbitrary I kept getting stopped out and then watching as the market turn around and go the way I thought it would.
Then it dawned on me. Look before you leap! So before jumping into the fray, look at where the stop goes first and if it is too far away you can just pass on it or place your “resting” or limit order closer to where a stop can be placed based chart support or resistance, not on “how much you want to lose”
Of course you can still get stopped out but at least you might have a better chance of keeping your losses smaller.
99fbf4ce 17f0 414a 810d a7fc0d87f581

Good Trading

Trading Futures, Options on Futures, and retail off-exchange foreign currency transactions involves substantial risk of loss and is not suitable for all investors.  You should carefully consider whether trading is suitable for you in light of your circumstances, knowledge, and financial resources. You may lose all or more of your initial investment. Opinions, market data, and recommendations are subject to change at any time when it comes to Futures Trading.


Futures Trading Levels

12-23-2020

fd7fcce9 e34c 49db abe9 b860272593ae

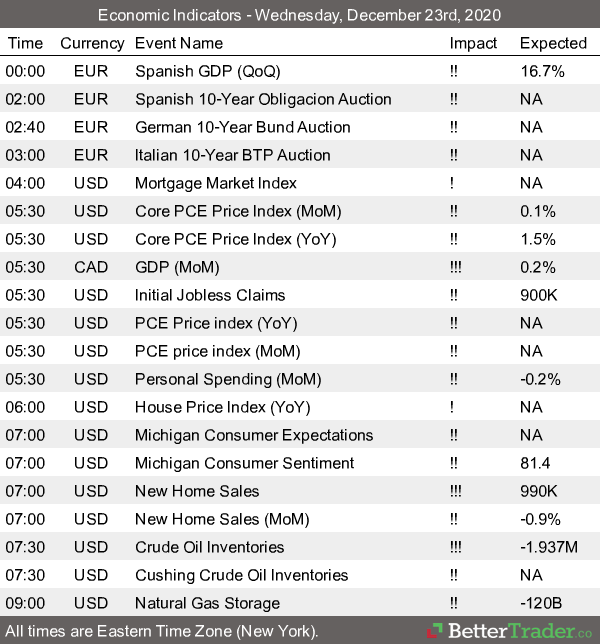
Economic Reports, source: 

 www.BetterTrader.co

8e228748 a03d 43c3 b77a 1ddcae9fce66


This is not a solicitation of any order to buy or sell, but a current market view provided by Cannon Trading Inc. Any statement of facts here in contained are derived from sources believed to be reliable, but are not guaranteed as to accuracy, nor they purport to be complete. No responsibility is assumed with respect to any such statement or with respect to any expression of opinion herein contained. Readers are urged to exercise their own judgement in trading.

Gold Daily Chart For Review. Sympathy rally with Bitcoin? & Support and Resistance Levels 12.18.2020

_________________________________________________

Voted #1 Blog and #1 Brokerage Services on TraderPlanet for 2016!!  

_________________________________________________

Dear Traders,

Like us on FaceBook!
Get Real Time updates and market alerts on Twitter!
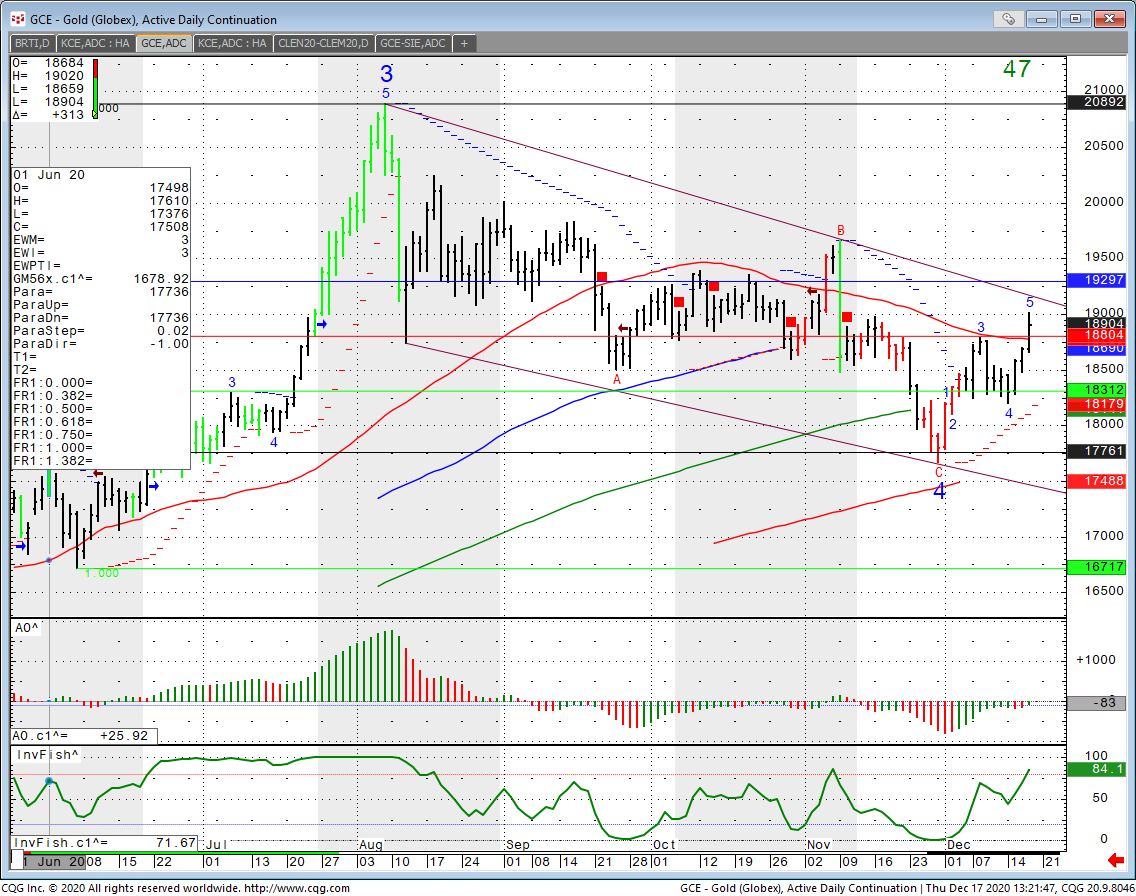
Gold Daily Chart below. Sympathy rally with Bitcoin?
End of the year rally?
Need to see a close above 1900 to get a bit more excited about this one.
Time will tell.
Quick educational tips:
1. Look for high volume markets with a thin spread, so orders are filled quickly and it has high volatility, so there are opportunities for 2 to 4 good trades during the day. The Emini S&P500 Index Future is a good example of this type of market (Each point is worth $50, split into 4 ticks of $12.50 and there are 4 contracts a year, traded on the Chicago Mercantile Exchange).
2. Try to minimize risk to 1% of your capital per trade, then your capital can absorb 100 consecutive bad trades. Even the best systems can expect 20% -40% loosing trades, so the 1% rule gives you room to maneuver.
3. $10-$15k is the minimum recommended risk capital you should have per Emini S&P500 contract traded – then if you lose $1000-$1500 it only represents 10% of you capital, which is recoverable compared to a $3k account where the same loss equals 50% of your account, consequently you are more likely to lose the remainder of your capital rather than recover the loss. If you don’t have the higher risk capital, limit yourself to the MICROS – 1/10th the size.
4. Limit the hours you trade – the more you trade, the more exposed you are to human weaknesses, frustration and more. Just like an athlete you need to preserve your trading (playing) time….
e5ea57f1 4a57 40c7 928f c04b1aad1054

Good Trading

Trading Futures, Options on Futures, and retail off-exchange foreign currency transactions involves substantial risk of loss and is not suitable for all investors.  You should carefully consider whether trading is suitable for you in light of your circumstances, knowledge, and financial resources. You may lose all or more of your initial investment. Opinions, market data, and recommendations are subject to change at any time when it comes to Futures Trading.


Futures Trading Levels

12-18-2020

aede9577 4c3d 46f2 8954 c741b856a1b4

Economic Reports, source: 

 www.BetterTrader.co

e0fbfd9f 6cd8 4869 bc08 0f9574349c5d


This is not a solicitation of any order to buy or sell, but a current market view provided by Cannon Trading Inc. Any statement of facts here in contained are derived from sources believed to be reliable, but are not guaranteed as to accuracy, nor they purport to be complete. No responsibility is assumed with respect to any such statement or with respect to any expression of opinion herein contained. Readers are urged to exercise their own judgement in trading.

3 Risks of Using a Discount Futures Broker

With the advent of technology, the means to communicate clear objectives, or with any human, drives most people to ignore full-service futures brokers. Why? It is a spirit of independence. Computers have created a superhighway of trading, and accelerated the pace at which commodities, stocks, in short the financial market operates. These various methods have raised barriers between clients and full-service brokers, but given rise to- discount futures brokers. In reality, what the future of the financial markets beckons, is a direct and honest appraisal of the quick and easy model, versus the client and broker relationship. If the “Great Recession” taught us all anything, if you are not vigilant, or the means to track your investment, there is an inherent risk.

Knowledge vs. Education

Brain to Understanding is to hat on a head, both are useful, if absolutely used for maximum benefits to create larger profits to debt losses. Most experienced futures brokers understand the full scope of the financial market, and this long range vision gives insight into the behaviors of certain commodities. Conversely, when opting out of choosing a full-service futures broker, you are presented with limited tools, vision and insight.

Vision, in the entrepreneurial sense, is the act or power of anticipating what will come to be. If you are a newcomer, choosing discount futures brokers, may lead to a lack discernment or experience to sell or buy at appropriate times to gain the maximum profit, while minimizing the loss. This vital quality reigns supreme on experienced traders in the financial sector. However, the key to having a strong vision is insight.

Insight varies to vision, in that you see both near and far and eventually the end result of a business decision. Good judgment plays an integral part in evaluating leverage metrics, whether using gold as a hedge, or evident world events that will signal either a sharp decline or increase in the markets.

Overall, vision and insight, help with the learning curve in the futures market. In addition, being green in this market can cost you a great deal of time and money. Adding vision and insight to your expansive market toolbox can aid in shortening common investment mistakes, with the aid of the seasoned futures broker as your guide. Conversely, selecting a discount futures broker, they may not have the ability to reign in your decision making. Bad decisions – loss of profit. Consequently, bucking traditional wisdom, you could lose larger returns, and run into dangerous investment decisions.

Continue reading “3 Risks of Using a Discount Futures Broker”

Futures Trading Levels and Reports for May 7, 2013

Connect with Us! Use Our Futures Trading Levels and Economic Reports RSS Feed.

Like us on FacebookFollow us on TwitterView our profile on LinkedInFind us on Google+Cannon Trading Futures Trading Resistance & Support Levels and Economic ReportsFind us on Yelp

1. Market Commentary
2. Futures Support and Resistance Levels – S&P, Nasdaq, Dow Jones, Russell 2000, Dollar Index
3. Commodities Support and Resistance Levels – Gold, Euro, Crude Oil, T-Bonds
4. Commodities Support and Resistance Levels – Corn, Wheat, Beans, Silver
5. Futures Economic Reports for Tuesday May 7, 2013

Hello Traders,

For 2013 I would like to wish all of you discipline and patience in your trading! 


We started this week very quietly, especially compare to last week. Much lower volume and narrower trading range.


Last week we had a slew of reports and events and the daily ranges were wider than the average ( take a look at the Mini Dow Jones daily chart below and the ATR, average true range study in it). This week we started quietly and there is not much activity ahead on the economic calendar until Thursday.

Try to get a feel for the market early in the day by looking at the overnight range as well as the range of the first trading hour after cash open. This can help you estimate what type of range/ volatility we may have and adjust your trading parameters accordingly.

Continue reading “Futures Trading Levels and Reports for May 7, 2013”

Trading Levels and Economic Reports for May 2, 2013

Connect with Us! Use Our Futures Trading Levels and Economic Reports RSS Feed.

Like us on FacebookFollow us on TwitterView our profile on LinkedInFind us on Google+Cannon Trading Futures Trading Resistance & Support Levels and Economic ReportsFind us on Yelp

1. Market Commentary
2. Futures Support and Resistance Levels – S&P, Nasdaq, Dow Jones, Russell 2000, Dollar Index
3. Commodities Support and Resistance Levels – Gold, Euro, Crude Oil, T-Bonds
4. Commodities Support and Resistance Levels – Corn, Wheat, Beans, Silver
5. Futures Economic Reports for Thursday May 2, 2013

Hello Traders,

For 2013 I would like to wish all of you discipline and patience in your trading! 


FOMC is now behind us and stock index futures look a little more vulnerable than before. My experience sugessts that many times, the bigger move and the direction of the move will take place the day followingn the FOMC, so I will close attention to market action tomorrow.

In between some good “trading , reading material ” to share with you:

Continue reading “Trading Levels and Economic Reports for May 2, 2013”