
June Emini S&P, CannonX Custom Time on the Chart, Levels; 3 Important Need-To-Knows for Trading Futures on May 20th, 2025

9dc1e02e d5f7 4ff4 abf7 1df60775f196

What to Know Before Trading Futures on May 20th, 2025

June Emini S&P

emini

Emini S&P

The June Emini S&P activated upside PriceCount objectives off the April low last month. Now, the chart is approaching its first count to the 6030 area where it would be normal to get a near term reaction in the form of a consolidation or corrective trade.

29d6df69 8503 4871 bee1 a285e9f170ec

The PriceCount study is a tool that can help to project the distance of a move in price. The counts are not intended to be an ‘exact’ science but rather offer a target area for the four objectives which are based off the first leg of a move with each subsequent count having a smaller percentage of being achieved.

It is normal for the chart to react by correcting or consolidating at an objective and then either resuming its move or reversing trend. Best utilized in conjunction with other technical tools, PriceCounts offer one more way to analyze charts and help to manage your positions and risk. Learn more at www.qtchartoftheday.com

Trading in futures, options, securities, derivatives or OTC products entails significant risks which must be understood prior to trading and may not be appropriate for all investors. Past performance of actual trades or strategies is not necessarily indicative of future results.

S
On a different note, here are some tips on creating a custom time chart interface using our FREE CannonX platform! (free demo)

How to create a custom Time on the charts?

Click on the arrow next to the current time interval

7862db77 9b30 4aca 8904 fbc25f21ca1e
Click on the custom option and type in the number of minutes or days you would like to see.
cba6258e 1077 416f 82aa 776d3f2d0a5b
Click ok and your new chart with custom time is available! In this example i selected 13 minutes.
8bfee785 e13b 4837 bd51 e65da93adb30

Daily Levels for May 20th, 2025

fbb3748e fceb 4c40 9b32 0c535da599f0

Want to feature our updated trading levels on your website? Simply paste a small code, and they’ll update automatically every day! 

Click here for quick and easy instructions.

822b33c5 2339 45ed bc84 e9c8f8c7358e

Economic Reports

provided by: ForexFactory.com

All times are Eastern Time (New York)

67ceaf55 65a4 4a59 927f 3b7ab33c0794

Find us on Trustpilot

stars

Trading Futures, Options on Futures, and retail off-exchange foreign currency transactions involves substantial risk of loss and is not suitable for all investors. 

You should carefully consider whether trading is suitable for you in light of your circumstances, knowledge, and financial resources. You may lose all or more of your initial investment.

Opinions, market data, and recommendations are subject to change at any time.

Join our Private Facebook group

Subscribe to our YouTube Channel

Listen to our podcast: Subscribe on AppleSpotify, Amazon

or wherever you listen to podcasts!

S
Facebook  Instagram  LinkedIn
S
ef3ab1c9 8d6d 4e60 a3f1 af5d9d4ecbb3
Services
Software
Tools
Community
Contact

Gold Soars, Wheat Shrinks: 7 Powerful Stats from a Wild Trading Day

9dc1e02e d5f7 4ff4 abf7 1df60775f196

Turbulence in Equities & Commodities

Gold & Wheat, Emini S&P COTD

Buckle your seatbelts, Turbulence in equities and Commodities

By John Thorpe, Senior Broker

Please speak with your broker about ways that you may not be aware of to assist you with your risk management plans. They may surprise you with the creative solutions you may find more efficient than simple stop orders or the old “hand on the mouse blow yourself out” strategy.

Wheat

wheat

Why the turbulence in the Grain markets? USDA prospective plantings report was revealed, although largely in line with expectations, it’s a surprise that planted acres are down for soybeans, wheat and 12% lower for cotton while farmers are switching out of beans and planting corn instead, as seed and fertilizer costs are lower for these compliments in production.

Wheat for all winter varieties planted is the second smallest crop since records have been kept from 1919. The weather market begins now in earnest for the Wheat complex for the next 8 weeks.

    Market volatility is here to stay for the foreseeable future

Choose your opportunities wisely.

 What in the world was going on with equity prices today, first the big dump was attributed to Liberation Tariff Day, coined by the media, only to see the markets stage a brave comeback against all talking point odds! Was this merely a technical correction? Or a combination of oversold and some positive tariff news?

 Mini Dow’s range today? 786 points $value? = $3930.00 from hi to lo

  Mini S & P’s range today? 111.25 points $ Value? = $5562.50 from hi to lo

Mini Nasdaq’s range today? 439 points $value? = 8785.00 from hi to lo

How Gold is your Portfolio?

Gold

gold nugg

All-time highs in gold today. 3162.00 per troy gold ounce currently trading @ 3155.00 + over $40.00 per gold oz. yet the industrial metals were negative today, Dr. Copper and Silver. We offer all exchange traded contract sizes, from 1 oz to 100 ounces.

Secondary tariffs on Russian oil talk had the Crude oil futures up over $2 per bbl safely above the $70.00 /bbl price level.

Tomorrow:

Econ Data:  Redbook, ISM Mfg. Final, JOLTS, Dallas Fed.

FED Speak: Quiet

Earnings: Quiet

Tariff news: Anything goes!

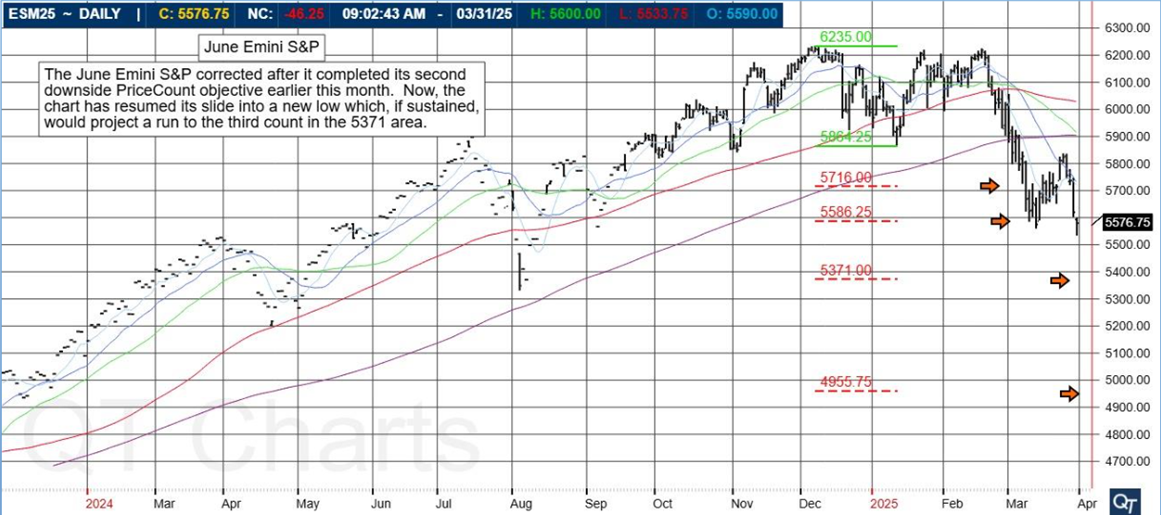
June Emini S&P

The June Emini S&P corrected after it fompleted its second downside PriceCount objective earlier this month. Now, the chart has resumed its slide into a new low which, if sustained, would project a run to the third count in the 5371 area.
6dfca21b 9511 45be b78f 66b38af600f1

Emini

Chart above is provided by QT Market Center, A Swiss army knife charting package that’s not just for Hedgers, Cooperatives and Farmers alike but also for Spread traders, Swing traders and shorter time frame application for intraday traders with a unique proprietary indicator that can be applied to your specific trading needs.

Free Trial Available

The PriceCount study is a tool that can help to project the distance of a move in price. The counts are not intended to be an ‘exact’ science but rather offer a target area for the four objectives which are based off the first leg of a move with each subsequent count having a smaller percentage of being achieved.

It is normal for the chart to react by correcting or consolidating at an objective and then either resuming its move or reversing trend. Best utilized in conjunction with other technical tools, PriceCounts offer one more way to analyze charts and help to manage your positions and risk.

Learn more at www.qtchartoftheday.com

Trading in futures, options, securities, derivatives or OTC products entails significant risks which must be understood prior to trading and may not be appropriate for all investors. Past performance of actual trades or strategies is not necessarily indicative of future results.
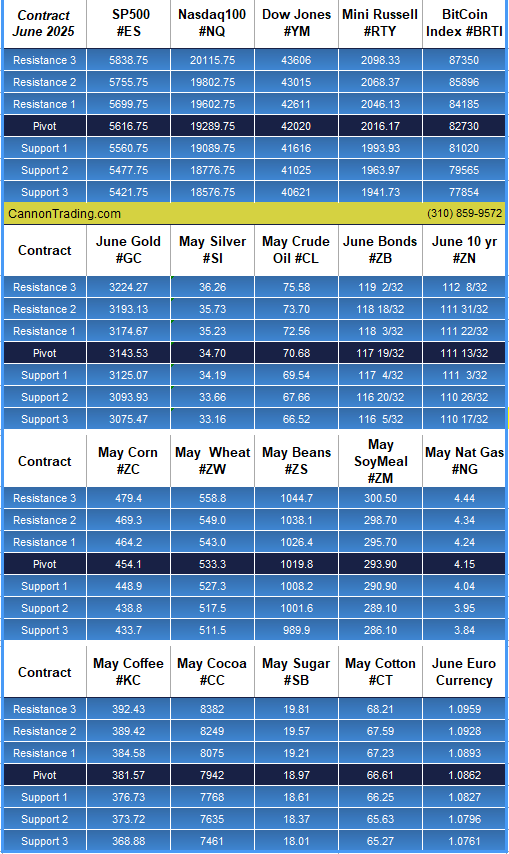
Daily Levels for April 1st, 2025

35cfa502 7631 46b8 a728 7d67424929ec

Want to feature our updated trading levels on your website? Simply paste a small code, and they’ll update automatically every day!

 Click here for quick and easy instructions.

822b33c5 2339 45ed bc84 e9c8f8c7358e

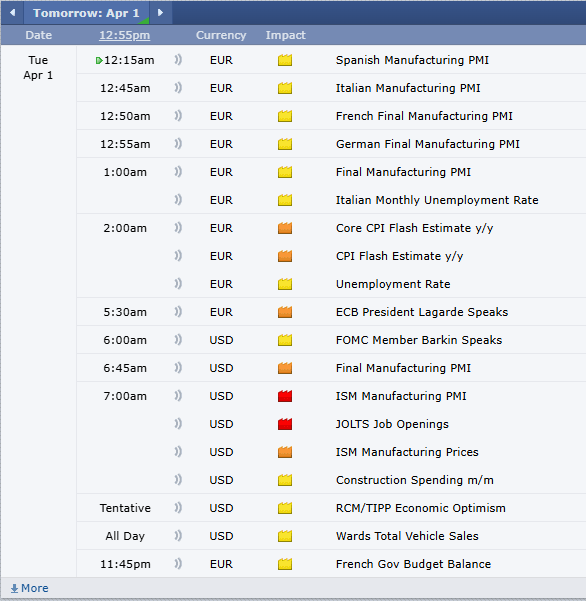
Economic Reports

provided by: ForexFactory.com

All times are Eastern Time (New York)
4a8c4696 3d99 4100 b8f3 fe3b0ae2d6d4

Find us on Trustpilot

stars

Trading Futures, Options on Futures, and retail off-exchange foreign currency transactions involves substantial risk of loss and is not suitable for all investors. You should carefully consider whether trading is suitable for you in light of your circumstances, knowledge, and financial resources. You may lose all or more of your initial investment. Opinions, market data, and recommendations are subject to change at any time.

Call Now

Join our Private Facebook group

Subscribe to our YouTube Channel

Listen to our podcast: Subscribe on AppleSpotify, Amazon

or wherever you listen to podcasts!

S
Facebook  Instagram  LinkedIn
S
ef3ab1c9 8d6d 4e60 a3f1 af5d9d4ecbb3
Services
Software
Tools
Community
Contact

E-Mini S&P 500: Origins, Viability, and the Rise of Micro S&P Products

Find out more about trading E-Mini S&P 500 contracts with Cannon Trading Company here.

The E-Mini S&P 500 is a widely traded stock index futures contract that provides exposure to the S&P 500 index. In this article, we will explore the history of the E-Mini S&P 500, understand its viability as a futures contract, and examine the evolution of micro S&P products. We will delve into the conception of trading the S&P 500 index as an E-Mini futures contract, the reasons behind its success, and the subsequent development of micro S&P contracts.

I.Origins of the E-Mini S&P 500:

The E-Mini S&P 500 came into existence as a response to market demands and advancements in technology. Its creation was driven by the Chicago Mercantile Exchange (CME), which sought to introduce a more accessible and cost-effective way for traders to gain exposure to the S&P 500 index.

  1. Conception of E-Mini Futures: The concept of trading the S&P 500 index as an E-Mini futures contract was conceived by the CME. The exchange recognized the need for smaller-sized contracts that would allow individual traders to participate in stock market index trading without the capital requirements of full-sized contracts.
  2. Introduction of E-Mini S&P 500: In September 1997, the CME launched the E-Mini S&P 500 futures contract, marking a significant milestone in the evolution of stock index futures trading. The E-Mini S&P 500 contracts represented a fraction of the value and margin requirements of their full-sized counterparts, making them more accessible to a wider range of market participants.

II. Viability of the E-Mini S&P 500 Futures Contract:

Several factors contribute to the viability of the E-Mini S&P 500 as a futures contract:

  1. Broad Market Exposure: The S&P 500 index is widely regarded as a benchmark for the overall performance of the U.S. stock market. Comprising 500 large-cap U.S. companies, it represents a diverse range of sectors and industries. The E-Mini S&P 500 futures contract provides traders with exposure to this broad market index, allowing them to speculate on or hedge against market movements.
  2. Liquidity and Efficiency: The E-Mini S&P 500 is one of the most liquid futures contracts globally. Its popularity and high trading volume ensure ample liquidity and tight bid-ask spreads. This liquidity, combined with electronic trading platforms, allows for efficient price discovery and ease of trade execution.
  3. Market Influence and Visibility: The S&P 500 index’s importance in the financial industry contributes to the E-Mini S&P 500’s viability as a futures contract. The index is widely followed by investors, analysts, and market participants worldwide. Its performance influences market sentiment and serves as a reference point for various investment strategies.

III. Evolution of Micro S&P Products:

Building upon the success of the E-Mini S&P 500, the CME introduced micro S&P products to further enhance accessibility and cater to individual traders.

  1. Introduction of Micro E-Mini S&P 500: In May 2019, the CME launched Micro E-Mini S&P 500 futures contracts. These contracts are one-tenth the size of the E-Mini S&P 500, allowing traders to participate in the market with even smaller capital requirements. Micro E-Mini S&P 500 futures provide greater flexibility and precision for traders with limited capital or those seeking to fine-tune their exposure.
  2. Advantages of Micro S&P Products: Micro S&P products offer several advantages. They require lower margin requirements, making them more accessible to retail traders and smaller institutional investors. Additionally, they enable traders to more precisely tailor their positions, adjust risk levels, and scale their exposure based on their trading strategies and capital availability.
  3. Micro E-Mini Success: The introduction of micro E-Mini S&P 500 contracts has gained significant traction in the futures market. The smaller contract size, lower margin requirements, and high liquidity have made micro S&P products popular among individual traders and allowed for increased participation and diversity in the market.

The E-Mini S&P 500, conceived by the CME, revolutionized stock index futures trading by providing accessible and cost-effective exposure to the S&P 500 index. Its viability stems from the broad market exposure, liquidity, and market influence associated with the S&P 500 index. The subsequent introduction of micro S&P products, such as the Micro E-Mini S&P 500, further enhanced accessibility, flexibility, and precision for traders. The rise of micro S&P products has attracted retail traders and smaller institutional investors, fostering increased participation and diversification in the futures market. Overall, the E-Mini S&P 500 and micro S&P products have played instrumental roles in democratizing access to stock index trading and shaping the landscape of futures markets.

Ready to start trading futures? Call 1(800)454-9572 and speak to one of our experienced, Series-3 licensed futures brokers and start your futures trading journey with Cannon Trading Company today.

DisclaimerTrading Futures, Options on Futures, and retail off-exchange foreign currency transactions involves substantial risk of loss and is not suitable for all investors.  Past performance is not indicative of future results. You should carefully consider whether trading is suitable for you in light of your circumstances, knowledge, and financial resources. You may lose all or more of your initial investment. Opinions, market data, and recommendations are subject to change at any time.